
Gamma correction
The gamma correction is a correction function frequently used particularly in the field of image processing for converting a physically proportional (d. E. Linear) increasing size in a human feeling according to non-linearly increasing size. From a mathematical point of view, this function is a power function with an exponent, often just called gamma , as the only parameter.
introduction

The gamma correction converts an input variable I in into an output variable I out according to a mapping rule :

The following applies:

and

Depending on the size of the exponent γ (gamma), a distinction is made between three cases:
- γ = 1: I out = I in , the mapping is linear.
- γ <1: The image is concave . Small input values are expanded widely, large input values are compressed.
- γ> 1: The image is convex . Small input values are compressed, large ones are expanded.
Three example curves are drawn in the graphic for γ = 3, 0.3 and 1.
Sometimes the reciprocal of the exponent is also called gamma: γ → 1 / γ
history
The standard text of DIN EN 61966-2 Annex A (color measurement and color management) refers to the initial use of the term gamma correction in photography by Ferdinand Hurter and Vero Charles Driffield since the 1890s. In photography it is sometimes used synonymously for rise, gradient and contrast. Definitions for screen rendering are from Irving Langmuir in the 1910s and Oliver in the 1940s.
A distinction must also be made between “ electron gun ” gamma values and “ fluorescent ” gamma values. The DIN EN standard 61966-A therefore speaks of an "ambiguity in the definition of the term 'gamma'" and recommends that the term no longer be used in normative contexts.
Perception and gamma correction
The brightness perceived by humans rises more steeply in dark areas and less steeply in light areas. The Stevens power function assigns the human eye a gamma of approx. 0.3 to 0.5. If the brightness signal of a display device, for example a monitor, is to be perceived linearly, it must therefore be pre-distorted with the reciprocal of the above gamma value (approx. 3.3 to 2) so that both non-linearities cancel each other out again for the viewer. A typical value for screens is about a gamma of 2.2.
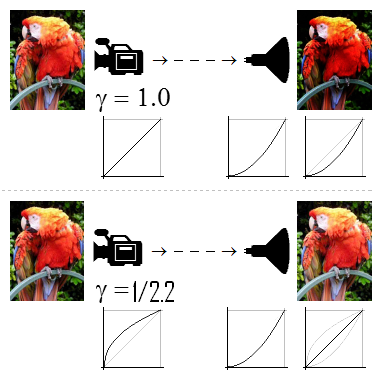 above: linear image sensor (e.g. CCD) leads to a high-contrast but unnatural image on display with gamma> 1
below: image recorder with intentional gamma <1 leads to an image that is perceptible true to the original when displayed with a suitable gamma> 1
(right below is each the gamma curve that describes the overall behavior of the system)

Example monitors
The middle original image shows a grayscale wedge and three step wedges in the saturated colors red , green and blue , each of which has 32 fields with linearly increasing brightness . The left picture shows the picture after a gamma correction with the exponent and the right picture after a gamma correction with the exponent . The brightness of the darkest and brightest fields are always retained. The 17th field from the left in the original image ( ) has a brightness of 50%, in the left image ( ) a brightness of and in the right image a brightness of .


|

|

|
Windows
The gamma value of an average monitor operated with Windows is 2.2. This setting is recommended because photographic laboratories also work with a gamma of 2.2, and an image that is found to be good on the monitor is exposed accordingly. The gamma can be set indirectly by specifying an output color profile. Here the use of the sRGB profile is recommended for the “normal” user, who is based on a gamma of approximately 2.2.
macOS
Until recently, the same monitor on a Mac was operated by default with a gamma of 1.8. The reasons come from the time before the ICC's color management . A gamma of 1.8 was intended for a workflow without color management, so that the monitor display better corresponded to the tone value reproduction of black and white printers. Nowadays the gamma values are supplemented by color profiles (e.g. from the ICC); the standard Mac color profile has a gamma of 1.8. From Mac OS X 10.6 (Snow Leopard) the standard gamma value is 2.2.
Gamma test graph

In the gamma test image, a single colored area consists largely of a checkered pattern with 0% and 100% brightness. The observer's eye sees this as 50% relative luminance and integrates it into a brightness accordingly . This relationship is known as the Weber-Fechner law , more precisely Stevens power function , and applies to all sense organs. The single-colored areas have a brightness corresponding to the entered gamma value. A gamma of 1.0 has the brightness 50%, gamma 1.8 has 68% and gamma 2.2 has 73%.

The two upper bars allow calibration of contrast and brightness. Eight three-digit numbers are displayed in each bar. A well adjusted monitor shows the right six numbers in both bars, a bad monitor only shows the right four numbers.
The colors are matched in the order green, red, and blue because of the color sensitivity of the eye. The comparison takes place either via the color balance adjustment of the operating system or via the primary color- specific brightness setting of the graphics card configuration program. As of MS Windows 7, there is the dccw.exe program, with which gamma correction and color adjustment can be set at the operating system level. Other programs can also create and load an ICC profile. See Monitor Calibration for instructions on setting up your monitor, graphics card and operating system for good reproduction.
Once you have found out the actual gamma value of your monitor, you can use the graphics settings on your computer to set your own value that is independent of the factory settings. By setting the reciprocal of the found value as gamma in the graphics settings, the monitor's gamma correction is (theoretically) neutralized; the result is an actual gamma value of 1. If one wants an actual gamma value of z. If you get 2.2, for example, you have to multiply the reciprocal value by 2.2 and set this value as the gamma value. Has one z. If, for example, an actual gamma value of 1.3 is determined, you have to set the value 0.77 in the graphics settings to neutralize the gamma correction and 1.69 to adjust the actual gamma value of 2.2 to reach.
Example image processing
Tone value corrections such as changes in brightness, contrast etc. convert color values of an image into other color values of the same color space. If the correction function is a power function of the form A = E , one speaks of a gamma correction. In a rough simplification, when using gamma values <1, such a correction increases the brightness of image areas that are too dark, while when using gamma values> 1 - conversely - it reduces the brightness of image areas that are too bright. With a gamma value = 1, since E 1 = E, everything stays the same.

Some image processing programs (e.g. GIMP ) do not specify the gamma value itself for the gamma correction , but the reciprocal value 1 / gamma, so that an increase in the value corresponds to an increase in brightness.


Original image

Image selectively brightened with = 0.3

Image selectively darkened with = 3


If the brightness value is increased in a picture that is too dark, all color tones are lightened by the same value. The lightest and darkest shades are lost. The very light tones turn into pure white. Black and the very dark tones become a shade of gray. Overall, the brightness spectrum of the picture is reduced and a light veil appears to be covering the picture. This can be partially compensated for by increasing the contrast. The dark colors are restored in this way. However, the conversion of the light tones to white is still increasing.
On the other hand, lightening an image by changing the gamma value has the advantage that the dark tones are brightened more than the light tones. The overall brightness spectrum is also retained. The spectrum (the variance ) of the light tones is "compressed", while that of the dark tones increases.
Many image processing programs offer the option of processing the correction curves shown in the graphic individually in order to adapt them to the desired brightness distribution or that of the original image.
The correction function having a coefficient multiplied ( ), this results in addition to the actual gamma correction yet a contrast enhancement ( ) or reducing ( ), in adding an additive constant contrast ( ) via the gamma correction, a brightness increase ( ) or reducing ( ). In practice, the two additional options just mentioned quickly lead to a confusing variety of correction options - the above figure on the right therefore shows the characteristics of the brightness, contrast and gamma value correction separately.


Example of digital video technology
First, an imaging system with ideal linear behavior is considered:
- 1st example
- A CCD chip (e.g. DV cam) accepts a gray wedge designed for human vision . The chip supplies non-linearly increasing voltages to the individual color fields, since the fields have non-linearly increasing degrees of reflection, because these fields were optically calibrated by a person through his light perception (see also Weber-Fechner law ). The stored values are now output again on an ideally linear television. The result would be satisfactory, since again non-linear values would lead to the same brightness perception as the filmed gray wedge.
So much for the simplest example of a closed system that is precisely coordinated and disregards all IT requirements. In reality, however, we are dealing with open systems and want to process the data via the camera on the computer, output it on the various output media and always see the same result.
- 2nd example
- The DV cam takes on the same gray wedge again. The output voltages of the CCD chip are normalized so that the range of values lies in an interval of [0.1]. For example, the values now run through the following function:
- For a value of 0.45:
- In simple terms, it can now be said that the values are adapted to the human optical system. (In reality, the individual color channels are adapted to the color stimulus function of the eye, see standard spectral value curve ). If the values are normalized in such a way that they are in the value range of [0.255], we get the well-known 8-bit RGB triples, which increase linearly to our perception of light. This now enables various digital image processing operations.
- Let's move on to the output of the image data:
- In order to display the data correctly for the human eye, it has to be adapted again, since a linear increase in voltage would not produce a linear brightness perception on an ideally linear screen. So we adjust the values to the eye with another gamma correction. Before that, the values are of course normalized to 1 again.
- Now with one of usually 2.2 (PC) → this results from the reciprocal value of 0.45:


- The result corresponds to the filmed gray card.
Since there are no ideal linear systems, two (or six) gamma corrections have to be added in this process. On the one hand, the chip has a non-linear behavior for the three color channels of different types. These must each be compensated for by a further gamma correction. On the other hand, the three phosphors of a screen behave non-linearly. The color corrections are component-related and are usually implemented in the devices themselves. Only the age of a device will make the result of this correction worse. As a rule, the user does not notice these corrections. If the correction is out of date, there is usually a color shift (a color cast of different colors and intensity over a gray wedge gradient).
Every imaging system has to deal with the problem of the perception of brightness. This has resulted in an abundance of gamma corrections. The color television systems PAL and NTSC , the operating systems Microsoft Windows and Mac OS Classic as well as Unixoid systems, but also printer manufacturers know the problem (see also tone value increase ).
Gamma correction for linearization
RGB - Monitors and TV devices have different brightness profiles and often require a correction to optimally represent the image.
Ideally, an output device would display the brightness value 0 as black and the brightness value 1 as white and display all values in between as linear between black and white as different gray values. This would correspond to a gamma of 1.
Due to production-related factors such is linearity in recording devices (. Eg cameras or) output devices (eg. As picture tubes ) can not be achieved. The non-linear input characteristic of an image converter (e.g. an LCD ) or a camera CCD chip usually plays the decisive role. This means that in the case of an image with a constant change in brightness from black to white with a gamma deviating from 1, either the light and dark areas are displayed in disproportionate detail or the medium gray levels.
So that no brightness information is lost or overemphasized in the further production process, every device that has a non-linear transfer function has the option of gamma correction to linearize the imaging performance .
If a device has several image converters for different colors, such as B. a three-tube camera , a gamma correction for each individual color channel may be necessary there due to different sensitivities.
Gamma correction is also known as a power transformation in digital image processing .
Details
The relationship between the digital and the radiometric data is referred to in the literature as the cathode ray tube transfer function (gamma) . For the sake of clarity, we will split this overall function into two parts, the digital part D (graphics card) and the analog part A (monitor input, screen).
The relationship between the monitor input voltage and the resulting brightness (luminance) of the individual pixel, i.e. our function A, follows a general power function. In the simplest model is:

with : input voltage standardized to 1 and : brightness standardized to 1.

The basis for this is the behavior of the accelerated electrons inside the picture tube, the main effect being based on the shielding effect of the electron cloud in the vicinity of the cathode. This simple model is extended by adding constants that represent various monitor parameters. The optimum would be a linear relationship with zero point at zero, maximum output signal with maximum input signal and a linear relationship, i.e. H. .

The luminance dependence of the color phosphors with regard to the current intensity can also be described with a power function, the exponent of which is approx. 0.9. This results in a total exponent of 1.6 (television) via 1.8 (Mac systems) to 2.2 (IBM PC-compatible systems) for computer monitors.
The resulting dependency can be described by:

with the parameters
- : Intensity [0..H]
- : maximum brightness of the picture tube
- : Gain (contrast)
- : Offset (brightness)
- : normalized pixel color value, simply connected subset from [0..1], typical pixel color values are in the interval [0..255]
- : Gamma exponent


origin

The term gamma was first introduced in sensitometry , i.e. to describe the sensitivity of photographic material. In addition to the gamma value, there are also various other parameters that characterize photographic material in this regard.
To determine the gamma of a photographic material, e.g. B. black and white film or photo paper, one examines the steepness of its optical density with the help of a density or gradation curve (see example image ). H. Blackening, depending on the exposure, and defines as the gamma value ( ) the slope of a tangent to the straight part of this curve. Since the blackening of photographic material increases logarithmically with the exposure, its logarithm must be used in the mathematical formulation of this relationship instead of the exposure itself:
.

On the basis of the gamma value determined in this way, you can then e.g. B. differentiate photo papers according to their gradation into "hard" and "soft", d. H. those that are more sensitive than “normal” or less sensitive to an increase in exposure. The gamma value observed is often incorrectly used to describe linear tonal value corrections (see above), although in this context it is more of a measure of the contrast of the image.

Simulation of "soft" photo paper with linear

Histogram for a "soft" linear tonal value correction

Simulation of "hard" photo paper with linear

Histogram for a "hard" linear tonal value correction


swell
- ↑ Han-Kwang Nienhuys: Gamma calibration . 2008. Retrieved November 30, 2018: "The reason for using 48% rather than 50% as a luminance is that many LCD screens have saturation issues in the last 5 percent of their brightness range that would distort the gamma measurement."
- ^ Peter Andrews: The Monitor calibration and Gamma assessment page . Retrieved November 30, 2018: "the problem is caused by the risetime of most monitor hardware not being sufficiently fast to turn from full black to full white in the space of a single pixel, or even two, in some cases."
- ^ Charles Poynton: The rehabilitation of gamma . Retrieved July 3, 2020: "Gamma summarizes, in a single numerical parameter, the nonlinear relationship between code value - in an 8-bit system, from 0 through 255 - and luminance."
- ^ Charles Poynton: Digital Video and HD - Algorithms and Interfaces , 2nd Edition, Morgan Kaufmann, 2012, p. 633 (accessed December 10, 2018): "Lightness: An objective quantity defined by the CIE, approximately the 0.42-power of relative luminance. "
- ^ Norman Koren: Monitor calibration and gamma . Retrieved November 30, 2018: "Gamma is estimated by locating the position where the average luminance across the gamma pattern is constant."
- ↑ Getting the best viewing experience for your monitor - calibrating the display . Microsoft. Retrieved December 10, 2018: "If you have a device and software for screen calibration, you should use this instead of" Calibrating the screen colors "as it will achieve better calibration results."
- ↑ Eberhard Werle: Quickgamma . Retrieved on December 10, 2018: "QuickGamma is a tool with which you can quickly and easily optimally set a PC screen without expensive measuring devices."
- ↑ Mike Walters: Monitor Calibration Wizard . Retrieved on December 10, 2018: "Easy wizard for creating color profiles for you monitor."
- ↑ Berns RS 1993a; CRT colorimetry. Part I: Theory and Practice; Color Research and Applications, 18. (1993) 299-314
literature
- Irving Langmuir : The effect of space charge and residual gases on thermionic current in high vacuum . In: Phys. Rev. Band 2 , 1913, pp. 450-486 .
- BM Oliver: Tone rendition in television . In: Proc. IRE . tape 38 , 1950, pp. 1288-1300 .
- Katoh: Corresponding Color Reproduction from Softcopy Images to Hardcopy Images . PhD thesis; Chiba Univ. Japan, 2002
- CIE: The Relationship between Digital and Colorimetric Data for Computer Controlled CRT Displays . (CIE Publication No. 122-1996). Commission Internationale de l'Eclairage, Vienna 1996
- Wilhelm Burger, Mark James Burge: Digital image processing: A compact introduction with Java and ImageJ . 2nd Edition. Springer, Berlin 2006, ISBN 978-3-540-30940-6 .
Web links
- Gamma Correction, archived at https://web.archive.org/web/20170106112023/http://www.graphics.cornell.edu/~westin/gamma/gamma.html
- Display gamma estimation applet, http://www.tsi.enst.fr/~brettel/TESTS/Gamma/Gamma.html
- The Monitor calibration and Gamma assessment page, http://www.photoscientia.co.uk/Gamma.htm
- Gamma correction test page, http://entropymine.com/jason/testbed/gamma/
- Edit gamma of colors with Gimp
- Digital Images - Gamma Correction , Digital Imaging Techniques , Wikibooks (2011)