Mossy
| Mossy | ||
|
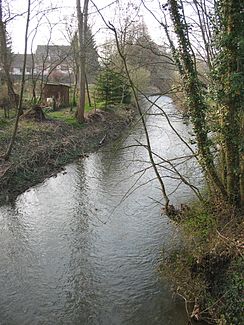
The Mossig at Soultz-les-Bains |
||
| Data | ||
| Water code | FR : A28-0200 | |
| location |
France
|
|
| River system | Rhine | |
| Drain over | Bruche → Ill → Rhine → North Sea | |
| source | near Schneematt , in the municipality of Wangenbourg-Engenthal 48 ° 36 '24 " N , 7 ° 16" 19 " E |
|
| Source height | 678 m | |
| muzzle | near Avolsheim in the Bruche Coordinates: 48 ° 33 ′ 56 " N , 7 ° 29 ′ 58" E 48 ° 33 ′ 56 " N , 7 ° 29 ′ 58" E |
|
| Mouth height | 163 m | |
| Height difference | 515 m | |
| Bottom slope | 16 ‰ | |
| length | 33 km | |
| Catchment area | 169.9 km² | |
| Drain at the mouth |
MQ |
581 l / s |
|
Avolsheim confluence of the Mossig in the Bruche |
||
The Mossig is a tributary of the Bruche in the French department of Bas-Rhin .
geography
course
The Mossig rises at an altitude of 620 meters near a settlement called Schneematt, in the municipality of Wangenbourg-Engenthal and is 33 km long. On its way it is flanked by hills and passes the villages Engenthal-le-Bas , Romanswiller , Wasselonne , Marlenheim , Kirchheim , Odratzheim , Scharrachbergheim-Irmstett , Soultz-les-Bains and Avolsheim . At Avolsheim it flows into the Bruche .
Tributaries
- Loechelbach ( right ), 5.4 km
- Ziegbach ( left ), 1.3 km
- Sommereau ( left ), 9.8 km
- Sathbach ( right ), 8.8 km
- Heiligenbach ( left ), 5.2 km
- Flossgraben ( left ), 1.5 miles
- Bruegel ( left ), 3 miles
- Kohbach ( right ), 6.0 km
- Kehlbach ( right ), 3.6 km
Hydrology
At the confluence of the Mossig in the Bruche , the mean flow rate (MQ) is 0.58 m³ / s; the catchment area here covers 169.9 km².
At the Soultz-les-Bains gauge, the average annual runoff of the Mossig was calculated over a period of 41 years (1970–2010) . The catchment area at this point corresponds to 163 km², about 96% of the entire catchment area of the river.
The flow rate fluctuates quite strongly over the course of the year. The highest water levels are measured between January and March. The flow rate reached its peak in February at 2.13 m³ / s. From April onwards the discharge decreases and reaches its lowest level in September with 0.66 m³ / s, after which it increases again from month to month.
measured at the Soultz-les-Bains hydrological station.
Data calculated from the values for the years 1970–2010

Individual evidence
- ↑ Mossig at SANDRE (French)
- ↑ a b see web link: Débits caractéristiques de la Mossig
- ↑ Banque Hydro - A2842010 La Mossig à Soultz-les-Bains (menu item: Synthèse)
Web links
- Débits caractéristiques de la Mossig (French; PDF; 17 kB)

