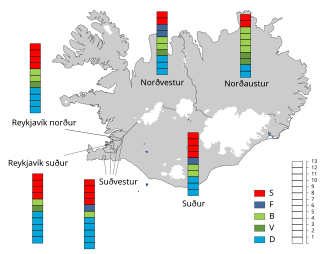
General election in Iceland 2003
The 2003 general election in Iceland took place on May 10, 2003. In the election, the 63 MPs of the Althing were redefined.
The election brought a narrow victory for the Independence Party under Prime Minister Davíð Oddsson . It was able to unite 33.7% of the votes.
This enabled the joint government of the Independence Party and the Progress Party to continue despite the loss of votes .
Electoral system
Compared to the previous election in 1999, the number of constituencies was reduced to six. In each of these multi-person constituencies, 9, i.e. a total of 54 members, were elected. In addition, there were 9 compensatory mandates, which were distributed to the parties according to the share of the vote in order to ensure an approximately proportional representation.
Survey
| Survey period | D. | B. | F. | S. | V |
|---|---|---|---|---|---|
| May 2003 | 33 | 16 | 7th | 34 | 9 |
| April 2003 | 34 | 13 | 10 | 33 | 10 |
| March 2003 | 35 | 14th | 5 | 35 | 10 |
| February 2003 | 36 | 12 | 2 | 36 | 10 |
| January 2003 | 36 | 14th | 3 | 38 | 9 |
| December 2002 | 40 | 12 | 2 | 32 | 13 |
| November 2002 | 41 | 14th | 2 | 32 | 11 |
| October 2002 | 40 | 18th | 1 | 27 | 12 |
| September 2002 | 38 | 17th | 1 | 29 | 14th |
| August 2002 | 41 | 17th | 3 | 24 | 14th |
| July 2002 | 41 | 18th | 2 | 26th | 12 |
| June 2002 | 42 | 17th | 2 | 25th | 12 |
| Election 1999 | 40.7 | 18.4 | 4.2 | 26.8 | 9.1 |
Election result
Of the 211,304 eligible voters, 185,392 voted, corresponding to a turnout of around 87.7%. 2,220 or around 1.2% of the votes were invalid.
Overall result
In detail, the following results were obtained:
| Political party | be right | Seats | ||||
|---|---|---|---|---|---|---|
| number | % | +/- | number | +/- | ||
| Independence Party (D) | 61,701 | 33.7 | −7.0 | 22nd | −4 | |
| Alliance (S) | 56,700 | 31.0 | +4.2 | 20th | +3 | |
| Progress Party (B) | 32,484 | 17.7 | −0.7 | 12 | - | |
| Left-Green Movement (V) | 16,129 | 8.8 | −0.3 | 5 | −1 | |
| Liberal Party of Iceland (F) | 13,523 | 7.4 | +3.2 | 4th | +2 | |
| Others | 2,635 | 1.4 | +0.6 | - | - | |
| total | 183.172 | 100.0 | 63 | |||
| Valid votes | 183.172 | 98.8 | ||||
| Invalid votes | 2,220 | 1.2 | ||||
| voter turnout | 185.392 | 87.7 | ||||
| Eligible voters | 211,304 | 100.0 | ||||
| Source: | ||||||
Result by constituency
| Political party | northwest | Northeast | south | southwest | Reykjavík South | Reykjavík North | |||||||
|---|---|---|---|---|---|---|---|---|---|---|---|---|---|
| % | Seats | % | Seats | % | Seats | % | Seats | % | Seats | % | Seats | ||
| D. | 29.60 | 3 | 23.50 | 2 | 29.20 | 3 | 38.40 | 5 | 38.00 | 5 | 35.50 | 4th | |
| S. | 23.20 | 2 | 23.40 | 2 | 29.70 | 4th | 32.80 | 4th | 33.30 | 4th | 36.30 | 4th | |
| B. | 21.70 | 2 | 32.80 | 4th | 23.70 | 2 | 14.90 | 1 | 11.30 | 1 | 11.60 | 2 | |
| V | 10.60 | 1 | 14.10 | 2 | 4.70 | - | 6.20 | - | 9.30 | 1 | 9.80 | 1 | |
| F. | 14.20 | 2 | 5.60 | - | 8.70 | 1 | 6.70 | 1 | 6.60 | - | 5.50 | - | |
| total | 10 | 10 | 10 | 11 | 11 | 11 | |||||||
See also
Web links
- Official website of the Icelandic Parliament Althing (Icelandic, English, Danish)
Individual evidence
- ↑ a b Results of parliamentary elections ( memento of the original from November 13, 2012 in the Internet Archive ) Info: The archive link was automatically inserted and not yet checked. Please check the original and archive link according to the instructions and then remove this notice. statice.is (English)
- ↑ Erakondade toetusreitingud Þjóðarpúls Gallup (Icelandic)
- ^ A b electionresources.org: Wahl zum Althing 2003
- ↑ Thorkell Helgason: Apportionment of Seats to Althingi, the Icelandic Parliament: Analysis of the Elections on May 10, 2003, May 12, 2007, April 25, 2009 and April 27, 2013. (PDF) Icelandic Election Commission, November 2013, accessed on October 29, 2017 (English).
