
Polonnaruwa (District)
Coordinates: 7 ° 57 ' N , 81 ° 0' E
| District Polonnaruwa පොළොන්නරුව දිස්ත්රික්කය பொலநறுவை மாவட்டம் |
|
|---|---|

|
|
| Province : | North Central Province |
| Administrative headquarters : | Polonnaruwa |
| Area : | 3,239 km² |
| of which land area: | 3,077 km² |
| of which inland waters: | 215 km² |
| Residents : | 406088 |
| Population density : | 132 people / km² |
The Polonnaruwa District ( Sinhala : පොළොන්නරුව දිස්ත්රික්කය , Tamil : மாவட்டம் பொலநறுவை ) is a district in the North Central Province of Sri Lanka . The main town is Polonnaruwa .
geography
The Polonnaruwa District is located in the northern interior of Sri Lanka and belongs to the north-central province . It has an area of 3,239 square kilometers (of which 3,077 square kilometers are land and 216 square kilometers inland water). This makes it the fifth largest district in Sri Lanka in terms of area.
Neighboring districts are Anuradhapura in the northwest, Trincomalee in the northeast, Batticaloa in the east, Ampara in the southeast and Matale in the southwest.
history
The district is one of the new foundations after the Second World War. It was created in 1958 from parts of the previous Anuradhapura district .
population
According to the 2012 census, the Polonnaruwa district has 406,088 inhabitants. With 131 inhabitants per square kilometer, the population density is well below the Sri Lankan average (325 inhabitants per square kilometer). Of the residents, 200,780 (49.44%) were male and 205,308 (50.56%) were female. The population is very young. This is illustrated by a look at the age distribution.
| Age | 0–9 years | 10–19 years | 20-29 years | 30–39 years | 40-49 years | 50–59 years | 60–79 years | 80 years and more |
| number | 74,375 | 63,743 | 62,497 | 65,180 | 55,060 | 45.296 | 36,598 | 3,339 |
| proportion of | 18.31% | 15.70% | 15.39% | 16.05% | 13.56% | 11.15% | 9.01% | 0.82% |
District population by ethnic group
Sinhalese
More than 90% of the residents belong to the Sinhalese ethnic group . Almost only members of their ethnic group live in the Dimbulagala, Elahera, Hingurakgoda and Medirigiriya divisions. They are also clearly in the majority in the remaining three divisions. The Sinhala population ranges from 71.46% in Lankapura to 99.84% in Elahera.
Moors
The second largest ethnic group and thus the largest minority are the Moors or Tamil-speaking Muslims. They form strong population groups in the divisions Lankapura (28.40% Moors), Thamankaduwa (15.82%) and Welikanda (14.54%). There are few members of their ethnic group in the Dimbulagala and Elahera divisions. Their share ranges between 0.02% in Elahera and 28.40% in Lankapura.
Sri Lankan Tamils
The Sri Lankan Tamils are the third largest ethnic group. They are particularly well represented in the Welikanda (10.89% Sri Lankan Tamils) and Dimbulagala (3.04%) divisions. There are almost no Sri Lankan Tamils in the three divisions of Elahera, Lankapura and Medirigiriya. Their share ranges between 0.04% in Medirigiriya and 10.89% in Welikanda.
Other ethnic groups
The Indian-born Tamils, Malays and Burghers, Sri Lankan Chetties and Bharathas are small minorities. They live scattered across all divisions of the district.
| year | Sinhalese 1 | Sri Lankan Tamils 2 | Tamils 2 | Moors 3 | Burgher | Malays | Others 4 | Total | ||||||||
|---|---|---|---|---|---|---|---|---|---|---|---|---|---|---|---|---|
| No. | % | No. | % | No. | % | No. | % | No. | % | No. | % | No. | % | No. | % | |
| 1981 | 238.965 | 91.36% | 5,267 | 2.01% | 124 | 0.05% | 16,636 | 6.36% | 59 | 0.02% | 109 | 0.04% | 403 | 0.15% | 261,563 | 100.00% |
| 2001 | 324.403 | 90.37% | 7,034 | 1.96% | 194 | 0.05% | 27,075 | 7.54% | 62 | 0.02% | 48 | 0.01% | 168 | 0.05% | 358.984 | 100.00% |
| 2012 | 368.197 | 90.67% | 7,301 | 1.80% | 161 | 0.04% | 30,177 | 7.43% | 88 | 0.02% | 46 | 0.01% | 118 | 0.03% | 406.088 | 100.00% |
| Source: Sri Lanka censuses in 1981, 2001 and 2012 | ||||||||||||||||
1 lowland and Kandy Sinhalese together 2 Sri Lankan Tamils and Indian Tamils separately 3 only Sri Lankan moors 4 thereof in 2001 65 Sri Lanka Chetties and 1 Bharatha and 2012 3 Sri Lanka Chetties and 5 Bharathas
Population of the district by confession

The distribution of creeds is a reflection of ethnic relationships. Almost all Sinhala residents of Polonnaruwa are Buddhist . The Islam , which includes the Moors and Malays, is the second largest religious group. Hinduism follows in third place , to which the majority of Sri Lankan and Indian Tamils belong. The only exception is Christianity , to which, in addition to the Burghern, a small minority of the Sinhalese and Tamils belong.
| year | Buddhists | Hindus | Muslims | Catholics | other Christs | Other | Total | |||||||
|---|---|---|---|---|---|---|---|---|---|---|---|---|---|---|
| No. | % | No. | % | No. | % | No. | % | No. | % | No. | % | No. | % | |
| 1981 | 235,758 | 90.13% | 4,781 | 1.83% | 17,090 | 6.53% | 3,471 | 1.33% | 351 | 0.13% | 112 | 0.04% | 261,563 | 100.00% |
| 2001 | 320.489 | 89.28% | 6,592 | 1.84% | 27,225 | 7.58% | 3,883 | 1.08% | 691 | 0.19% | 104 | 0.03% | 358.984 | 100.00% |
| 2012 | 364.229 | 89.69% | 6,886 | 1.70% | 30,465 | 7.50% | 3,192 | 0.79% | 1,276 | 0.31% | 40 | 0.01% | 406.088 | 100.00% |
| Source: Sri Lanka censuses in 1981, 2001 and 2012 | ||||||||||||||
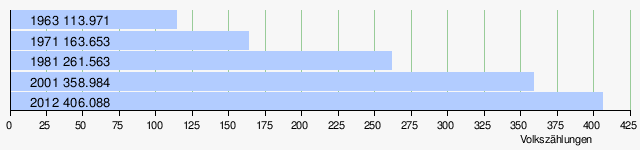
Population development
The population of the Polonnaruwa district has been growing faster than the Sri Lankan average since the turn of the millennium. In the period from 2001 to 2012 (the last two census years) the increase was 47,104 people. This is a growth of 13.12%. Since the start of independence, the population has increased by 256%.
Significant places
The only big place is Polonnaruwa .
Local administration
The head of the district holds the title of District Secretary. The district is further divided into seven divisions (under a Division Secretary). The cities and larger towns have their own administration (municipal parliament or council). There are 295 village administrations (Grama Niladharis) for the 637 villages in the entire district.
| Surname | main place | Residents 2012 |
Area in km² |
density | GN | Villages |
|---|---|---|---|---|---|---|
| Dimbulagala | Manampitiya | 79,661 | 534 | 149 | 56 | 78 |
| Elahera | Bakamuna | 43,915 | 349 | 63 | 28 | 87 |
| Hingurakgoda | Hingurakgoda | 64,289 | 696 | 92 | 53 | 140 |
| Lankapura | Thalpatha | 36,452 | 184 | 198 | 28 | 49 |
| Medirigiriya | Medirigiriya | 65,575 | 537 | 122 | 45 | 111 |
| Thamankaduwa | Thamankaduwa New Town | 82,426 | 445 | 185 | 55 | 126 |
| Welikanda | Welikanda | 33,770 | 548 | 62 | 30th | 46 |
| Polonnaruwa District | Polonnaruwa | 406.088 | 3,077 | 132 | 295 | 637 |
Individual evidence
- ↑ Final result of the 2012 census
- ↑ Data from Polonnaruwa District after the 2012 census
- ^ Map of the ethnic distribution after the 2012 census
- ^ Map of religious distribution after the 2012 census
- ↑ Data from Polonnaruwa District after the 2012 census
- ↑ Polonnaruwa District Handbook 2011, Table 1.1
- ↑ Statistical Abstract 2013 of Sri Lanka, Table 1.2 ( Memento of the original from February 13, 2015 in the Internet Archive ) Info: The archive link was inserted automatically and has not yet been checked. Please check the original and archive link according to the instructions and then remove this notice.
Web links
- Website of the district (English)
Ampara | Anuradhapura | Badulla | Batticaloa | Colombo | Bile | Gampaha | Hambantota | Jaffna | Kalutara | Kandy | Kegalle | Kilinochchi | Kurunegala | Mannar | Matale | Matara | Moneragala | Mullaitivu | Nuwara Eliya | Polonnaruwa | Puttalam | Ratnapura | Trincomalee | Vavuniya