Process visualization
Process visualization is the graphic representation of processes on a user interface . Process visualization is used for quality management , automation technology , process engineering , management processes, business processes, etc., but also in research and development for the simulation of processes.
presentation
The simplest representation of a process is the black box as a symbol for "input-processing-output" ( EVA principle ). Depending on the focus, the core processes, the management processes or the supporting processes or the entire company are presented.
The process map describes the structure of the company processes and the interaction of the individual sub-processes. It is often represented by means of vector-oriented graphics software , but can also be shown quite impressively by the workforce on e.g. B. a long wrapping paper can be painted on the wall.
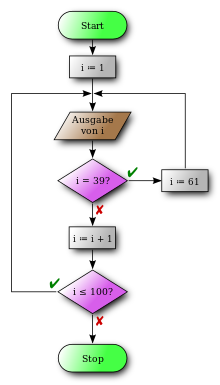
The more precise visualization then describes the chronological-logical sequence of processes in the company and the link between these processes. The process structure (interaction of the sub-processes) as well as the individual processes are visualized, and then the monitoring and control (status of individual measured values and their change over time) in the application.
Depending on the objective, the processes are presented in different levels of detail, from a rough overview to individual procedural instructions and rules for decisions and control. See also business process modeling .
Examples
- Distillation of mineral oil, with the parameters pressure, temperature and concentration
- Picking and packaging in a logistics center, with the parameters throughput, number of goods movements and picking orders
- Flow of goods (order, incoming goods, production, delivery, invoicing), with the parameters of lead time , costs and resource allocation
- Contract management (offer preparation-contract conclusion-contract extension-distribution), with the parameters insured sum, commission , term and interest
Process visualization in process engineering
In automation technology one has to deal with numerous variables that are measured or calculated. Often these are physical quantities such as temperature , force , speed , current , pressure, etc.
These variables are displayed dynamically in the production area by a process visualization , either as text / table or graphically. The operator can intervene in the process via input fields (switch, keyboard, touch-sensitive screen) in order to change states or setpoints individually or to manage them using a recipe .
Process visualizations must be adapted to the respective plant and the respective process. The individual masks of the visualization are designed with graphic design tools. The programming of the logic within the process visualization can also be carried out visually or with conventional programming with source text . Conventional programming has greater flexibility than visual programming, which may be more convenient for the developer to solve simple problems, but requires the visualization developer to have at least basic programming knowledge. The boundaries between visual and conventional programming are often blurred, as scripts or macros can be stored in the visual elements or the source text is embedded in a framework .
The data supply can take place in different ways:
- ( Real time ) database
- OPC
- Corba
- Industry PC
- Interface driver for PLC
- Shared memory
There are a number of special operating devices available on the market, which their manufacturers naturally propagate; However, common IT technologies are more powerful and cost-effective.
Process visualization in Six Sigma
With the process optimization method Six Sigma , many of the described options for process visualization are used, with the so-called process mapping in Six Sigma recording the actual processes to be optimized. Visualizations of target processes as they are e.g. B. are common in quality manuals, play a subordinate role in Six Sigma.


