
Arctic oscillation
The Arctic Oscillation (AO) (English also Northern Hemispheric Annular Mode (NAM)) is an expression of the air pressure difference between the arctic and the middle latitudes in the northern hemisphere . Arctic - and Antarctic oscillations - are large systems of teleconnection of the earth, also polar vortex .
Basics
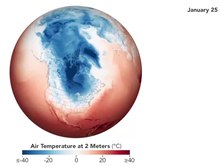
The Arctic Oscillation is caused by the large temperature differences between the extremely cold polar regions and the moderate mid-latitudes. The winds that develop as a result are deflected to the east due to the Coriolis force . It is closely related to the North Atlantic Oscillation (NAO), which describes the Atlantic component of these dynamics of the climate system in more detail. It is based on oscillations in the course of the jet stream , which sometimes runs evenly in the west wind belt , but sometimes begins to oscillate itself and then swings far north and south ( Rossby waves of west wind drift). Therefore, the Arctic Oscillation affects the general weather patterns of the entire northern hemisphere .
AO and AAO index


The extent and strength of the (Ant) Arctic Oscillation is measured with the AO or AAO index .
AO index
This refers to three meteorological action centers :
- the high pressure in the Aleutians (" Aleutian high "),
- gravure printing in Iceland ( " Iceland Deep ") and
- the high pressure over the Bay of Biscay (" Western Europe high ").
The first is the Northern component of the North Pacific highs , The second one, the Atlantic component of the polar vortex and dritteres the Northeast component of the Azores high , three permanent basic characters of the climate system.
To calculate the long-term monthly mean of the 1000 hPa altitude anomaly from 20 ° north latitude to the North Pole , a statistical main component analysis is then carried out for the mean position of the air masses (Emperical Orthogonal Function, EOF), and the variance is determined. This is still being adjusted and weighted. The AO index is the mean daily deviation from this monthly base value. This methodology also takes into account the influences of all other known teleconnection patterns .
Phases of the AO and consequences for the environment and climate

Like all currents, the AO can be divided into two phases:
- In the positive phase, strong westerly winds drive the warm Atlantic air to Northern Europe and Siberia as well as the polar regions in winter. This has a direct negative impact on the ice thickness there.
- In the negative phase, cold polar air can penetrate further south. This can result in cooler temperatures in Europe (with a higher probability over the winter months).
The variance of the monthly AO base indices is large in winter (around 2), in the summer half-year small (around 0.5). That represents the stability of the weather conditions.
Special weather events in connection with the AO (selection)
- Cold wave in Europe in 2012 : Here the very rare deviation of the AO from the North Atlantic Oscillation (NAO) was that it was negative, while the NAO index was positive, which resulted in the shift of the polar jet stream: instead of the regular west-east direction flow he in the high phase of the cold spell on a loop Northern Scandinavia - British Isles - Northern Spain - Libya around Europe; the event was also closely related to a simultaneous maximum of the " La Niña period".
- Cold anomaly in Europe in 2018 : At the end of February 2018, both the A and NAO indices slid massively negative.
See also
- Antarctic Oscillation (AAO) in the southern hemisphere
Web links
- NOAA Climate Prediction Center , cpc.ncep.noaa.gov: Daily Arctic Oscillation Index (current values and forecasts of the AO)
- National Snow and Ice Data Center , nsidc.org: Patterns in Arctic Weather and Climate ("Patterns in Arctic Weather and Climate", relationship between centers of action and oscillations)
- naturgewalten.de: NAO / AO / Gulf Stream
Individual evidence
- ↑ Arctic Weather Plunges into North America. January 29, 2019, accessed April 7, 2020 .
-
↑ a b c Teleconnection Pattern Calculation Procedures: 2. North Atlantic Oscillation / Pacific - North American pattern (NAO / PNA). cpc.ncep.noaa.gov > Monitoring Weather & Climate> Teleconnections;
and Technique for Identifying the Northern Hemisphere Teleconnection Patterns. cpc.ncep.noaa.gov > Monitoring and Data> Oceanic & Atmospheric Data> Northern Hemisphere Teleconnection Patterns (both accessed November 25, 2017). - ↑ a b What is the AO index value? weather forecast- weather forecast.de
- ↑ Markus Becker: Can the polar ice withstand the growing greenhouse effect? (PDF; 27 kB) December 2000, accessed on May 10, 2010 .
- ^ IG Rigor, JM Wallace, and RL Colony: Response of sea ice to the Arctic oscillation. J. Clim. 15 (2002), pp. 2648-2663
- ↑ Jeff Masters: Harsh winter weather continues in Europe; rare snowstorm hits Libya. In: Dr. Jeff Masters' Miracle Blog. February 7, 2012, accessed February 15, 2012 .
- ^ Justin Grieser: Deadly cold snap grips Europe, snow strands thousands in Serbia, Bosnia , section What's causing the extreme cold? In: Washington Post online March 2, 2012
- ^ NOAA National Centers for Environmental Information: State of the Climate: Global Analysis for Annual 2012. January 2013, accessed January 10, 2017; especially graphic 2012 Global Significant Weather and Climate Events and section Top Ten Global Weather / Climate Events for 2012.
- ↑ on NAO / AO – La Niña Teleconnection, see also James A. Bradbury, Cameron P. Wake, Airmap / NOAA: El Niño, the North Atlantic Oscillation and New England Climate; Winter Season Teleconnections and Climate Prediction ( Memento from January 21, 2012 in the Internet Archive ) . Airmap / NOAA (en, about the weather on the American east coast, explanations transferable: Normally the USA and Europe have about the same winters, with NAO different)