Window function
In digital signal processing , a window function defines the weighting with which the sampled values obtained during the sampling of a signal within a section (window) are included in subsequent calculations. Window functions are used in frequency analysis (e.g. using discrete Fourier transform ), filter design, beamforming and other signal processing applications.
Applications
Frequency analysis
A continuous signal is usually processed in blocks. As block lengths are, in practice, finally, there is the so-called spectral leakage ( English leakage effect ), when the block length is not a multiple of the period natürlichzahliges of the signal. The calculated frequency spectrum is too wide, figuratively speaking it is "smeared". This effect results from the properties of the Fourier transform .
By using a suitable window function, the effect can be reduced, but not completely avoided. The signal is mostly "faded in" at the beginning of the window and "faded out" at the end of the window, which leads to an artificial periodization of the signal within the time window length.
In addition to the spectral broadening, the window function also influences the frequency selectivity and the maximum possible spectral error. There are various window functions of varying complexity. The selection of a suitable window function is therefore always a compromise that takes into account the special requirements of the respective application.
Filter design
A frequently used method for the design of digital filters with a finite impulse response (FIR filter) is the window method .
The desired frequency response of the filter is defined and the ideal impulse response is determined using the inverse Fourier transformation . The result of the inverse Fourier transform is usually infinitely long. In order to obtain a finite impulse response with the desired filter length N , a section of the infinite impulse response is selected using a window function. The actual frequency response of the filter thus corresponds to the multiplication of the desired frequency response by the Fourier transform of the window function.
In the filter design, wide (selective) window functions lead to steep transitions between pass band and stop band, but to low stop attenuation. Narrow (non-selective) window functions lead to flat transitions between the pass band and stop band, but in return to high stop attenuation.
Examples of window functions
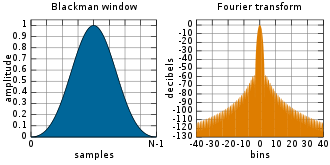
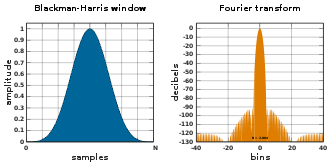
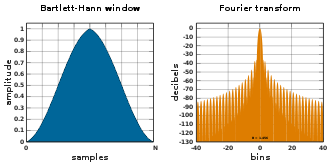
Common window functions are shown below. In the graphics on the left, the discrete window function is shown with N values; outside the area shown, each window function has the value 0, which is not explicitly shown in the graphics. The right representation shows the frequency spectrum assigned to the window function with 128 frequency components and how it is obtained by the discrete Fourier transformation (DFT). The signal is folded in the frequency domain with this spectrum of the window function , the evaluation of ideal window functions usually being characterized by a narrow spectrum around the center frequency and strong attenuation outside.
Here is an integer window width. The current index of the input signal is . Unless otherwise noted, it goes in the following representations , the maximum is at . In addition, an equal and shifted in phase and balanced representation to 0, as does English -zero phase called. In this case the index goes from
the maximum is in this form of representation at .
Rectangle window
The rectangular window function , also referred to as a Dirichlet window (after Peter Gustav Lejeune Dirichlet ), is 1 in the entire window area and 0 outside of it. The function is given as:
The simple processing of the input signal in blocks corresponds to the use of this window function. The amount spectrum corresponds to the amount curve of the si function . Only in special case where the window width exactly comprises an integer multiple of the period of the harmonic signal oscillation, the windowing occurs at time-discrete signals according to the rectangular window no spectral leakage on.
Von-Hann window
The Von Hann window is based on a superposition of three spectrally shifted si functions in order to achieve a stronger suppression of the sidelobes compared to the rectangular window with only one si function in the spectrum. The disadvantage is a reduction in frequency resolution. The Von Hann window with the Haversine function is also known as the raised cosine window , with the following function:
With
This is also shown in the adjacent figure.
In addition, the symmetrical representation with the Havercosine function around and without phase shift is also used in the literature :
and in this case with the index in the range
The name Hann window comes from the publication " Particular Pairs of Windows " by RB Blackman and John W. Tukey , who named it after Julius von Hann . The widespread designation Hanning window comes from this article , although only the application of the Hann window is referred to as “ hanning ” (derived from “ to hann ”).
Hamming window
The function is given as
where is the window width and the current index of the input signal.
This window function is named after Richard Hamming and represents a modification of the Von-Hann window. In general, the Von-Hann and Hamming windows with the two coefficients and can be expressed as:
The two coefficients are 0.5 for the Von Hann window. The maximum of the window function is the same . If the window is normalized in such a way that , one degree of freedom remains. In the Hamming window, the coefficients are chosen so that the zeros of the two adjacent and largest side lobes are suppressed to the maximum. This corresponds to a different weighting of the individual si functions in the spectrum of the window function. This condition results in
Rounding to two decimal places for practical implementations results in an attenuation of the first two sidelobes of approx. −42.76 dB in the Hamming window.
Blackman Window (3-Term)
Blackman windows are defined as:
With
and
Usually, the classic Blackman window is chosen.
Blackman Harris window
Function:
With
Frederic J. Harris published this function in 1978 as a modification of the Blackman window function.
Blackman Nuttall Window
Function:
With
Except for the four almost identical coefficients, the Blackman-Nuttall window is identical to the Blackman-Harris window, which shows the influence of the necessary precision in the implementation of the coefficients in this class of window functions.
Flat top window
The flat-top window is a partially negative window function, which is used, among other things, in spectrum analyzers for measuring and evaluating the amount of individual amplitudes . The flat-top window has a comparatively small amplitude error; the disadvantage is the poor frequency resolution.
As an example, the following flat-top window function is used in the SR785 spectrum analyzer from Stanford Research Systems (SRS), as shown in the figure below:
With
Bartlett window
This window function is named after Albert Charles Bartlett :
A closely related variation of the Bartlett window function is based on the triangle function and has no zero values as a difference between the start and end values. It is defined as
The triangular function window can be interpreted as a convolution of two rectangular windows, the main lobe is twice as wide as the rectangular window and the next side lobe has an attenuation of −26 dB.
Bartlett-Hann window
This is a combination of the triangle function of the Bartlett function with the Hann window function:
With
Cosine window
The cosine window function is also known as the sine window function. It is defined as:
Tukey window
The Tukey window function, named after John W. Tukey , can be understood as a cosine window function which is flattened to sample values and which is convoluted with a rectangular window of width . For the Tukey window function goes into the rectangular window. For it corresponds to the Hann window.
Lanczos window
The Lanczos window is based on the normalized si function , similar to the Lanczos filter :
Kaiser window
The window is defined by the function:
Here is the modified Bessel function of zero order. The window width is and is a real factor that determines the shape of the window. The larger , the narrower the window and corresponds to a rectangular window.
The Fourier transform of the window is defined by the function
for the normalized frequency .
The function can be used to determine the width of the main maximum
and the relative damping of the secondary maximum
to calculate. As a result, when it becomes larger, the width of the main maximum increases and the relative amplitude of the secondary maximum decreases.
Gaussian window
The Gaussian window is based on the Gaussian bell curve , which expands to infinity and therefore has to be executed for a limited time. This means a combination with the rectangle window.
The window is given as:
With
Further
Comparison of the window functions
Evaluation criteria for window functions
All common evaluation criteria relate to the transfer function (Fourier transformation of the window function) in the frequency domain. The following evaluation criteria are used to compare and select the correct window function:
Width of the main maximum (main lobe)
A broadening of the main maximum leads to a more rapid decrease in the secondary maxima (secondary lobes), increases the dynamics of the window function and reduces the leakage effect. However, the frequency selectivity is thereby reduced. Window functions with a broad main maximum are therefore also referred to as nonselective, dynamic windows , and those with a narrow main maximum as selective, non-dynamic windows .
The width of the main maximum is usually given as the 3 dB cutoff frequency. This is the frequency at which the amplitude of the main maximum has dropped by 3 dB. The entire width of the maximum up to the zeros is also rarely given.
Relative amplitude of the secondary maximum
Strong secondary maxima of a window function increase the leakage effect in the frequency analysis and indicate a low dynamic of the window function.
The ratio between the amplitude of the main maximum and the amplitude of the highest secondary maximum is used as the evaluation criterion.
Leak factor
The leakage effect is reduced by low secondary maxima. The leakage factor is defined as the ratio of the performance under all secondary maxima to the performance of the entire function.
Maximum sampling error
The maximum sampling error is defined as the ratio of the amplitude of the main maximum to the amplitude at the frequency / window length.
Comparison according to the above evaluation criteria
Broadening the main maximum leads to a faster decrease in the secondary maxima. This is shown by way of example in the illustration on the right using rectangular and Hamming windows.
| Window designation | rel. Amplitude of the secondary maximum |
Width of the main maximum |
Max. Sampling error |
|---|---|---|---|
| rectangle | −13 dB | 3.92 dB | |
| Triangle (Bartlett) | −25 dB | 1.82 dB | |
| from Hann | −31 dB | 1.42 dB | |
| Hamming | −41 dB | 1.78 dB | |
| Kaiser-Bessel ( ) | −46 dB | 1.46 dB | |
| Kaiser-Bessel ( ) | −82 dB | 0.89 dB | |
| Blackman | −57 dB | 1.10 dB |
literature
- Karl-Dirk Kammeyer, Kristian Kroschel: Digital signal processing . 9th edition. Teubner, 2018, ISBN 3-8348-1644-2 .
Individual evidence
- ↑ Julius O. Smith III: Generalized Hamming Window Family. Center for Computer Research in Music and Acoustics (CCRMA), Stanford University, accessed August 31, 2014 .
- ^ RB Blackman, JW Tukey: Particular pairs of windows . In: The measurement of power spectra, from the point of view of communications engineering . Dover, New York 1959, pp. 95-101, here pp. 98-99 .
- ^ A b Julius O. Smith III: Hamming Window. Center for Computer Research in Music and Acoustics (CCRMA), Stanford University, accessed August 30, 2014 .
- ^ A b c F. J. Harris: On the use of windows for harmonic analysis with the discrete Fourier transform . In: Proceedings of the IEEE . Vol. 66, 1978, pp. 51-83 , doi : 10.1109 / PROC.1978.10837 .
- ↑ Steven W. Smith: The Scientist and Engineer's Guide to Digital Signal Processing . Ed .: California Technical Publishing. San Diego, California, USA 2011 ( dspguide.com [accessed February 14, 2013]).
- ^ G. Heinzel, A. Rüdiger, R. Schilling: Spectrum and spectral density estimation by the Discrete Fourier transform (DFT), including a comprehensive list of window functions and some new flat-top windows . Max Planck Institute (MPI) for Gravitational Physics / Laser Interferometry & Gravitational Wave Astronomy, 2002, 395068.0 ( mpg.de [accessed February 10, 2013]).
- ^ Julius O. Smith III: Properties. ( Memento of July 6, 2008 in the Internet Archive ) In: Spectral Audio Signal Processing. March 2007 (draft).
- ↑ JW Tukey: An introduction to the calculations of numerical spectrum analysis . In: Spectral Analysis of Time Series . 1967, p. 25-46 .
- ^ J. Kaiser, RW Schafer: On the use of the I0-sinh window for spectrum analysis . In: IEEE Transactions on Acoustics, Speech and Signal Processing . tape 28 , no. 1 , February 1980, p. 105-107 , doi : 10.1109 / TASSP.1980.1163349 .


![{\ displaystyle w (n) = {\ frac {1} {2}} \ left [1- \ cos \ left ({\ frac {2 \ pi n} {M-1}} \ right) \ right] = \ operatorname {hvs} \ left ({\ frac {2 \ pi n} {M-1}} \ right),}](https://wikimedia.org/api/rest_v1/media/math/render/svg/c0ce27c6d8d18a9b1c6bc2d6a734b450acf8ceea)

![{\ displaystyle w (n) = {\ frac {1} {2}} \ left [1+ \ cos \ left ({\ frac {2 \ pi n} {M-1}} \ right) \ right] = \ operatorname {hvc} \ left ({\ frac {2 \ pi n} {M-1}} \ right)}](https://wikimedia.org/api/rest_v1/media/math/render/svg/efe4df346a4c497a96a3d74ddc0d01192a0b869e)


![{\ displaystyle w (n) = {\ begin {cases} {\ frac {1} {2}} \ left [1+ \ cos \ left (\ pi \ left ({\ frac {2n} {\ alpha (M -1)}} - 1 \ right) \ right) \ right] = \ operatorname {hvc} \ left (\ pi \ left ({\ frac {2n} {\ alpha (M-1)}} - 1 \ right ) \ right), & {\ text {if}} 0 \ leq n \ leq {\ frac {\ alpha (M-1)} {2}}, \\ 1, & {\ text {if}} {\ frac {\ alpha (M-1)} {2}} \ leq n \ leq (M-1) (1 - {\ frac {\ alpha} {2}}), \\ {\ frac {1} {2 }} \ left [1+ \ cos \ left (\ pi \ left ({\ frac {2n} {\ alpha (M-1)}} - {\ frac {2} {\ alpha}} + 1 \ right) \ right) \ right] = \ operatorname {hvc} \ left (\ pi \ left ({\ frac {2n} {\ alpha (M-1)}} - {\ frac {2} {\ alpha}} + 1 \ right) \ right), & {\ text {if}} (M-1) (1 - {\ frac {\ alpha} {2}}) \ leq n \ leq (M-1). \ end {cases }}}](https://wikimedia.org/api/rest_v1/media/math/render/svg/260031252ad49bcd3605f5de5c85d0415a37060d)


![{\ displaystyle w (n) = {\ frac {I_ {0} \ left (\ alpha \ left [1- \ left ({\ frac {2n} {M}} \ right) ^ {2} \ right] ^ {\ frac {1} {2}} \ right)} {I_ {0} \ left (\ alpha \ right)}}, \ quad n = - {\ frac {M} {2}}, \ dotsc, { \ frac {M} {2}} - 1}](https://wikimedia.org/api/rest_v1/media/math/render/svg/6960c88e5eab960a4b5a395ae4eb7484af8dc5da)


![A _ {{\ mathrm {SL}}} = 20 \ cdot \ log _ {{10}} \ left [{\ frac {\ sinh \ alpha} {0 {,} 217234 \ alpha}} \ right]](https://wikimedia.org/api/rest_v1/media/math/render/svg/e7dd4a09658269036a350a182efda74e75e78619)


