
Descriptive statistics
The aim of descriptive (also: descriptive ) statistics is to clearly display and organize empirical data using tables, key figures (also: measures or parameters) and graphics. This is particularly useful when there is a large amount of data, as it cannot be easily surveyed.
Differentiation from other sub-areas of statistics
In addition to descriptive statistics, statistics also include
- the exploratory data analysis (also: exploratory statistics ) and
- the Mathematical Statistics (also: inferential statistics , inferential statistics or inductive statistics ).
The aim of exploratory statistics is to find previously unknown structures and relationships in the data and thereby generate new hypotheses. These hypotheses based on sample data can then be examined for their general validity within the framework of the conclusive statistics using methods of probability theory.
From the inductive or inferential statistics (inferential) the descriptive statistics differs in that it no statements on a going beyond the cases studied population does and does not allow testing hypotheses. Descriptive statistics do not use stochastic models (the basis of inductive statistics), so that the statements made are not secured by error probabilities.
The methods of descriptive statistics can therefore be applied to any type of sample, while the methods of inductive statistics have to meet a number of requirements, including sampling. The methods of exploratory statistics are mostly identical to those of descriptive statistics; rather, the aim of the analysis is to determine what distinguishes the two areas.
Methods of descriptive statistics
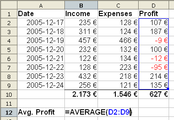
Example of a table: Spreadsheet with OpenOffice.org
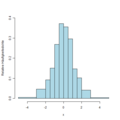
Example of a diagram: histogram of a variable
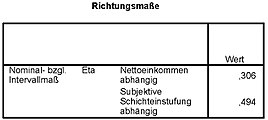
Example of a parameter: coefficients for two variables


There are essentially three methods to display the data:
- Tables
- In tables, data is displayed in a matrix with rows and columns if the data structure allows this. One line usually corresponds to an observation and one column to a data variable. The disadvantage of a table is that even with small data sets, the structure of the data is difficult to grasp. Sometimes rearranging columns or rows can help.
- Diagrams
- In diagrams and graphics, the data or certain aspects of the same are graphically presented clearly. However, this usually requires a summary of the data, so that information from the data is lost. For example, in a scatter plot of two variables, the relationship between the data can be clearly seen, but the number of observations with the same numerical values is lost ( overplotting ).
- parameter
- In parameters (also measures or key figures ), an aspect of the data is reduced to a single number (aggregated). In order to describe the data, a large number of different parameters are then calculated to compensate for the loss of information due to the strong summary.
| table | diagram | parameter | |
|---|---|---|---|
| Aggregation of data | low | medium | high |
| Clarity | low | medium | high |
| Information content | high | medium | low |
Parameters (statistical parameters)
Three types of metrics are mainly of interest:
- Location dimensions
- as a central tendency of a frequency distribution. The skewness and excess of a frequency distribution can be determined from the position of the various values for the central tendency to one another .
- Measures of dispersion
- for the variability (scatter or dispersion) of a frequency distribution and
- Measures of connection
- for the connection (also: correlation) of two variables.
The choice of suitable parameters depends on the scale or measurement level of the data and on the robustness of the parameter.
Examples
- Representation of the average temperature and the temperature fluctuations in a region by means of mean value and dispersion; Information on how often certain temperatures are exceeded ( quantile ); Comparison by region and / or time period using graphs or tables.
- Comparison of the final grades of two school years in a subject with the respective mean values and scatter.
- There are five red and four blue balls in an urn . Three balls are drawn from this urn without replacing. If you define the random variable as the number of red balls among the three drawn, it is hypergeometrically distributed with the number of red balls in the urn, the total number of balls in the urn and the number of attempts. All information about the distribution of can be obtained here.


See also
- Frequency distribution
- Contingency table
- Lorenz curve
- Significant places in measurement technology
- Design of experiments
- Time stock
literature
- Literature on descriptive statistics in the catalog of the German National Library
- Hans Benninghaus : Descriptive Statistics. Stuttgart 1976.
- Georg Bol: Descriptive Statistics. Textbook and workbook. 6th revised edition. Oldenbourg, Munich et al. 2004, ISBN 3-486-57612-7 .
- M. Burkschat, E. Cramer , U. Kamps : Descriptive statistics. Basic methods. Springer, Berlin et al. 2004, ISBN 3-540-03239-8 ( EMILeA-stat ).
- Ansgar Steland: Basic knowledge of statistics. Compact course for users from business, IT and technology. Springer, Berlin et al. 2007, ISBN 978-3-540-74204-3 ( Springer textbook ).
Web links
- Rößler, Irene / Ungerer, Albrecht: Collection of formulas for descriptive statistics (PDF; 3.1 MB)
- von der Lippe, Peter: Descriptive statistics: formulas, tasks, exam training (2006, 7.3 MB)
Individual evidence
- ^ Jürgen Bortz: Statistics for human and social scientists . 6th edition, Springer, Heidelberg 2005, ISBN 354021271X , p. 1.