
Hypergeometric distribution


The hypergeometric distribution is a probability distribution in stochastics . It is univariate and is one of the discrete probability distributions . In contrast to the general hypergeometric distribution , it is also called the classic hypergeometric distribution .
Elements are randomly taken from a dichotomous population in a sample without replacement . The hypergeometric distribution then provides information about the probability with which a certain number of elements will occur in the sample that have the desired property. This distribution is therefore important in quality controls, for example .

The hypergeometric distribution is modeled on the urn model without replacement (see also variation without repetition ). In this context, an urn with two kinds of balls is specifically considered. Balls are removed without replacing. The random variable is the number of balls of the first kind in this sample.

The hypergeometric distribution thus describes the probability that for given elements ("population of the circumference "), which have the desired property, exactly hits will be achieved when selecting specimens ("sample of the circumference ") . H. the probability of success in experiments.


Example 1: There are 30 balls in an urn, 20 of which are blue, so 10 are not blue. What is the probability p of drawing exactly thirteen blue balls from a sample of twenty balls (without replacing)? Answer: p = 0.3096. This corresponds to the blue bar at k = 13 in the diagram "Probability function of the hypergeometric distribution for n = 20".
Example 2: There are 45 balls in an urn, 20 of which are yellow. What is the probability p of drawing exactly four yellow balls from a sample of ten balls? Answer: p = 0.269. The example is calculated below .
definition
The hypergeometric distribution depends on three parameters:
- the number of elements in a population .
- the number of elements with a certain property in this basic set (the number of possible successes).
- the number of elements in a sample.


The distribution now provides information on how likely it is that elements with the property to be checked (successes or hits) are in the sample. The result space is therefore .


A discrete random variable is subject to the hypergeometric distribution with the parameters , and , if they are the probabilities

for owns. The binomial coefficient denotes " over ". Then you write or .


The distribution function then indicates the probability that at most elements with the property to be tested are in the sample. This cumulative probability is the sum

- .

Alternative parameterization
Occasionally it is also called a probability function

used. This goes over with and into the above variant.


Properties of the hypergeometric distribution
Symmetries
The following symmetries apply:
- Interchanging drawn balls and successes:
- Swap successes and failures:


Expected value
The expected value of the hypergeometrically distributed random variable is
- .

mode
The mode of hypergeometric distribution is
- .

Here is the Gaussian bracket .

Variance
The variance of the hypergeometrically distributed random variable is
- ,

The last fraction is the so-called correction factor ( finiteness correction ) in the model without replacement.
Crookedness
The skewness of the hypergeometric distribution is
- .
![\ operatorname {v} (X) = {\ frac {(N-2M) (N-1) ^ {{\ frac {1} {2}}} (N-2n)} {[nM (NM) (Nn )] ^ {{\ frac {1} {2}}} (N-2)}}](https://wikimedia.org/api/rest_v1/media/math/render/svg/f3eefdb795a903c7d0de1861f81c8590aab99ad7)
Characteristic function
The characteristic function has the following form:

Where denotes the Gaussian hypergeometric function .

Moment generating function
The torque generating function can also be expressed using the hypergeometric function:

Probability generating function
The probability generating function is given as

Relationship to other distributions
Relationship to the binomial distribution
In contrast to the binomial distribution , with the hypergeometric distribution the samples are not returned to the reservoir for further selection. If the size of the sample is relatively small (roughly ) compared to the size of the population , the probabilities calculated by the binomial distribution and the hypergeometric distribution do not differ significantly from one another. In these cases, the approximation is often carried out using the binomial distribution, which is mathematically easier to handle.

Relationship to the Pólya distribution
The hypergeometric distribution is a special case of the Pólya distribution (choose ).

Relationship to the urn model
The hypergeometric distribution arises from the discrete uniform distribution through the urn model . From an urn with a total of balls are colored and balls are drawn. The hypergeometric distribution indicates the probability that colored balls will be drawn. Otherwise, the binomial distribution can also be used for modeling in practice. See also the example.

Relationship to the multivariate hypergeometric distribution
The multivariate hypergeometric distribution is a generalization of the hypergeometric distribution. It answers the question about the number of balls of one color drawn from an urn if the urn contains more than two different colors of balls. For two colors it agrees with the hypergeometric distribution.
Examples
Various examples
There are 45 balls in a container, 20 of which are yellow. 10 balls are removed without replacing.
The hypergeometric distribution indicates the probability that exactly x = 0, 1, 2, 3, ..., 10 of the balls removed are yellow.
An example of the practical application of hypergeometric distribution is the lottery : In the number lottery there are 49 numbered balls; 6 of these will be drawn at the draw; 6 numbers are crossed on the lottery ticket.
indicates the probability of achieving exactly x = 0, 1, 2, 3, ..., 6 "hits".

- Probability in the German lottery

in linear application
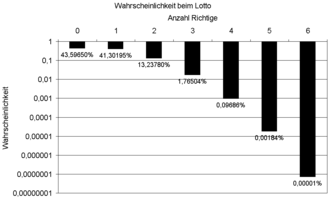
in logarithmic application
.png&filetimestamp=20060626194109&)
_log.png)
Detailed calculation example for the balls

For the example of the colored balls given above, the probability is to be determined that exactly 4 yellow balls result.
| Total number of balls | |
| Number with the property "yellow" | |
| Sample size | |
| Aimed for yellow |


So .

The probability results from:
- Number of possibilities to choose exactly 4 yellow (and therefore exactly 6 purple) balls
- divided by
- Number of ways to choose exactly 10 balls of any color
There are

Ways to pick exactly 4 yellow balls.
There are

Ways to pick exactly 6 purple balls.
Since every “yellow possibility” can be combined with every “violet possibility”, this results

Possibilities for exactly 4 yellow and 6 purple balls.
There are altogether

Ways to draw 10 balls.
So we get the probability
- ,

that is, in around 27 percent of cases, exactly 4 yellow (and 6 purple) balls are removed.
Alternatively, the result can also be found using the following equation

There are 4 yellow balls in the sample . The remaining yellow balls (16) are in the 35 remaining balls that do not belong to the sample.
Numerical values for the examples
|
|
||||||||||||||||||||||||||||||||||||||||||||||||||||||||||||||||||||||||||||||||||||||||||||||
| x | Number of possible results |
Probability in% |
|---|---|---|
| 0 | 6.096.454 | 43.5965 |
| 1 | 5,775,588 | 41.3019 |
| 2 | 1,851,150 | 13.2378 |
| 3 | 246.820 | 1.765 |
| 4th | 13,545 | 0.0969 |
| 5 | 258 | 0.0018 |
| 6th | 1 | 0.0000072 |
| ∑ | 13,983,816 | 100.0000 |
| Expected value | 0.7347 | |
| Variance | 0.5776 | |
Web links
Individual evidence
- ^ Hans-Otto Georgii: Stochastics . Introduction to probability theory and statistics. 4th edition. Walter de Gruyter, Berlin 2009, ISBN 978-3-11-021526-7 , p. 36 , doi : 10.1515 / 9783110215274 .