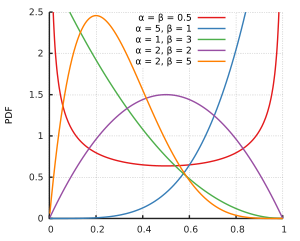
Beta distribution for different parameter values

Cumulative distribution function for various parameter values
The beta distribution is a family of continuous probability distributions over the interval , parameterized by two parameters, which are often referred to as p and q - or also as α and β . In Bayesian statistics , the beta distribution is the conjugate a priori probability distribution for the Bernoulli, binomial, negative binomial, and geometric distributions.

definition
The beta distribution is defined by the probability density

Outside the interval it is continued with. For can be replaced by . The beta distribution has the real parameters and (in the adjacent graphics and ). In order to guarantee that they can be standardized, (or ) is required.


![[0.1]](https://wikimedia.org/api/rest_v1/media/math/render/svg/738f7d23bb2d9642bab520020873cccbef49768d)


The prefactor is used for correct normalization. The expression


stands for the beta function after which the distribution is named. The gamma function denotes .

The distribution function is corresponding

With

The function is also called the regularized incomplete beta function .

properties
Expected value
The expected value is calculated as
-
 .
.
mode
The mode , so the maximum point of the density function is for ,


-
 .
.
Variance
The variance results from
-
 .
.
Standard deviation
For the standard deviation results
-
 .
.
Coefficient of variation
The coefficient of variation is obtained directly from the expected value and the variance
-
 .
.
Crookedness
The skew arises too
-
 .
.
Higher moments
The torque-generating function results in the k-th moments
-
 .
.
symmetry
The beta distribution is for symmetrical around with the skewness .


Moment generating function
The moment-generating function of a beta-distributed random variable is
-
 .
.
The representation is obtained
with the hypergeometric function 
-
 .
.
Characteristic function
The characteristic function is obtained analogously to the torque-generating function
-
 .
.
Relationships with other distributions
Special cases
If and are independent gamma distributed random variables with parameters and , then the size is beta distributed with parameters and , for short


Relationship to constant uniform distribution
If independent random variables are uniformly distributed, then the order statistics are beta-distributed. More precisely applies


for .

Mixed distributions
A binomial distribution whose parameters are beta-distributed is called a beta binomial distribution . This is a special case of mixed distribution .
example
The beta distribution can be determined from two gamma distributions : The quotient of the stochastically independent random variables and , both of which are gamma distributed with the parameters and or , is beta distributed with the parameters and . and can be interpreted as chi-square distributions with or degrees of freedom .


Using the linear regression is an estimated regression line by a " point cloud " with pairs of values of two statistical features and down, in such a way that the sum of squares of the vertical distances of the values of the straight line is minimized.


The spread of the estimated values around their mean value can be measured by and the dispersion of the measured values around their mean value can be measured by. The former represents the "(by regression) explained sum of squares " ( sum of squares explained ' , in short: SSE ) and the latter is the " total sum of squares " ( sum of squares total , in short SST ) is the. Quotient of these two variables is the coefficient of determination :


-
 .
.
The "non-declared (by regression) square sum" or the " residual sum " ( residual sum of squares , shortly SSR ) is by given. By decomposing the sum of squares , the coefficient of determination can also be represented as


-
 .
.
So it's beta distributed. Since the coefficient of determination is the square of the correlation coefficient of and ( ), the square of the correlation coefficient is also beta-distributed. However, the distribution of the coefficient of determination for the global F test can be specified using the F distribution , which is available in a table.


Generalization: Beta distribution on (a, b)
definition
The general beta distribution is defined by the probability density

where and are the upper and lower limits of the interval. The calculation of zu
results accordingly


properties
Is beta distributed on the interval with parameters , then is

beta distributed on the interval using the same parameters , . Conversely, if beta is distributed to , then is


beta distributed to .
example
In the triangle test , three samples are arranged in an equilateral triangle with one corner of the imaginary triangle pointing upwards. Two of the three samples belong to product A and one sample belongs to product B or vice versa. The test person's task is to find the product that only occurs once. The probability of giving the correct answer by mere guessing is .


Distribution of the success probabilities of a sample in the triangular test (black line) with a rate-success probability of (blue line)

The chances of success vary depending on sensory skills. Assuming that no test person deliberately gives a wrong answer, the probability of success is not lower for anyone . For gourmets or large differences in taste, this can theoretically increase to 100%. In the following, the beta distribution is derived for any rate-success probabilities using . For the reasons just mentioned, this probability density models the probands' success probabilities more realistically than a beta distribution .


The probabilities of success of the individual test persons are initially beta distributed to with parameters and . The corrected success probabilities on result from
. The probability density of can be determined using the transformation theorem for densities . The beta distribution of has a positive density in the interval . The transformation with is a diffeomorphism. This gives the inverse function . For the searched density function of one obtains


-
 .
.
This probability density of on is shown as a function of the probability density of on . The graph on the right shows an example of a beta distribution with parameters and . The expected value is . The average probability of success is thus higher than the rate-success probability of .


Individual evidence
-
↑ Brockhoff, Per Bruun. "The statistical power of replications in difference tests." Food Quality and Preference 14.5 (2003): 405-417.
Web links
Discrete univariate distributions
Continuous univariate distributions
Multivariate distributions


