Kohima (District)
| Kohima district | |
|---|---|

|
|
| State | Nagaland |
| Administrative headquarters : | Kohima |
| Area : | 1463 km² |
| Residents : | 267,988 (2011) |
| Population density : | 183 inhabitants / km² |
| Website : | www.kohima.nic.in |
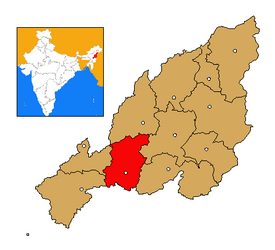
Kohima is a district in the center of the northeast Indian state of Nagaland .
The area is 1463 km². The administrative seat is the city of the same name Kohima . The administrative center of Nagaland is located in the district.
population
According to the 2011 census, the Kohima district has 267,988 inhabitants. With 183 inhabitants per square kilometer, the district is densely populated. The district is predominantly rural. Of the 267,988 residents, 146,900 people (54.82%) live in rural areas and 121,088 people live in urban communities.
The Kohima district is one of those areas of India that are mostly populated by members of the "tribal population" ( scheduled tribes ). Among them (2011) were 224,738 people (91.32 percent of the district population). There is not a single Dalit ( scheduled castes ) in the district.
215,925 people (80.57 percent of residents) were born in the district. A total of 19,601 people were born in other Indian states (including 7,179 people in Assam, 4,579 people in Manipur and 3,484 people in Bihar). Of the 2,003 foreign-born people, 1,885 are from Nepal and only 47 are from the nearby states of Bangladesh and Myanmar.
Population development
As everywhere in India, the population in the Kohima district has been growing rapidly for decades. The increase in the years 2001–2011 was 21.7 percent (21.72%). In those ten years the population increased by almost 48,000 people. From 1960 onwards there was a strong immigration to the then sparsely populated area. This resulted in a population growth of 546% in just 50 years. The following table illustrates the development:

Significant places
In the district there are two places with more than 10,000 inhabitants with the district capital Kohima and its suburb Kohima Village . Tseminyu is another place that is also considered a notified town.

District population by gender
As is common in India, the district always had significantly more male than female residents. Because of the high level of immigration, the surplus of men was above the Indian average for a long time. But this has normalized in recent years. Among the youngest residents (under 7 years of age) the proportions are 50.37% male to 49.63% female.
| Distribution of the population by gender in Kohima district | ||||||||||||||
| 1961 census | 1971 census | 1981 census | 1991 census | 2001 census | 2011 census | |||||||||
| number | proportion of | number | proportion of | number | proportion of | number | proportion of | number | proportion of | number | proportion of | |||
| TOTAL | 41,501 | 100% | 63,077 | 100% | 97.169 | 100% | 154.145 | 100% | 220.168 | 100% | 267,988 | 100% | ||
| Men | 22,266 | 53.65% | 35,259 | 55.90% | 52,855 | 54.39% | 82,371 | 53.44% | 116.025 | 52.70% | 138.966 | 51.85% | ||
| Women | 19,235 | 46.35% | 27,818 | 44.10% | 44,314 | 45.61% | 71,774 | 46.56% | 104.143 | 47.30% | 129.022 | 48.15% | ||
District population by language
The population of Kohima District is very linguistically mixed. Various angamidal eects are spoken by a total of 121,517 people (45.34 percent of the population). The main language among them is Angami with 25,036 speakers. This is followed by Rengma at a great distance. A total of nine languages are spoken by at least 1% of the population. The following table shows the most widely used languages:
| year | Rengma | Angami | Ao | Nepali | Lotha | Bengali | Hindi | Mao | Chakhesang | Total | ||||||||||
|---|---|---|---|---|---|---|---|---|---|---|---|---|---|---|---|---|---|---|---|---|
| number | % | number | % | number | % | number | % | number | % | number | % | number | % | number | % | number | % | number | % | |
| 2011 | 57,728 | 21.54 | 25,036 | 9.34 | 13,277 | 4.95 | 9,821 | 3.66 | 6,304 | 2.35 | 5,218 | 1.95 | 4,821 | 1.80 | 3,971 | 1.48 | 3,272 | 1.22 | 267,988 | 100.00% |
| Source: 2011 census result | ||||||||||||||||||||
Population of the district by confession
The Tibetan Burmese residents have converted almost entirely to Christianity in the past 100 years. The most important communities within Christianity are the Baptists, Presbyterians (Reformed), and Catholics. The Hindus and Muslims form religious minorities and are mainly immigrants from other regions of India. The following table shows the exact religious composition of the population:
| year | Buddhists | Christians | Hindus | Jainas | Muslims | Sikhs | Other | not specified | Total | |||||||||
|---|---|---|---|---|---|---|---|---|---|---|---|---|---|---|---|---|---|---|
| number | % | number | % | number | % | number | % | number | % | number | % | number | % | number | % | number | % | |
| 2011 | 1,519 | 0.57 | 234.955 | 87.67 | 25,496 | 9.51 | 80 | 0.03 | 4,384 | 1.64 | 998 | 0.37 | 335 | 0.13 | 221 | 0.08 | 267,988 | 100.00% |
| Source: 2011 census result | ||||||||||||||||||
education
Thanks to significant efforts, literacy has risen sharply in recent decades. In urban areas, nine out of ten people can read and write. Around 81 percent can read and write in rural areas. The strong differences between the sexes and the urban / rural population are typical of Indian conditions.
| Literacy in the Kohima District | ||||||
| unit | 2011 census | |||||
| number | proportion of | |||||
| TOTAL | 197,489 | 85.23% | ||||
| Men | 107.038 | 88.69% | ||||
| Women | 90,451 | 81.48% | ||||
| TOTAL CITY | 95.505 | 90.09% | ||||
| City men | 50,767 | 92.26% | ||||
| City women | 44,738 | 87.74% | ||||
| TOTAL COUNTRY | 101,984 | 81.14% | ||||
| Country men | 56,271 | 85.70% | ||||
| Country women | 45,713 | 76.15% | ||||
| Source: 2011 census result | ||||||
Administrative division
The district was divided into eight circles at the last census in 2011.
| Population in the Circles | ||||||||||||||||
| Botsa | Chiephobozou | Jakhama | Kezocha | Kohima Sadar | Sechu-Zubza | Tseminyu | Tsogin | |||||||||
| number | proportion of | number | proportion of | number | proportion of | number | proportion of | number | proportion of | number | proportion of | number | proportion of | number | proportion of | |
| TOTAL | 6,695 | 100% | 19,692 | 100% | 34,056 | 100% | 16,467 | 100% | 116,870 | 100% | 17,369 | 100% | 51,314 | 100% | 5,525 | 100% |
| Men | 3,346 | 49.98% | 10,400 | 52.81% | 17,626 | 51.76% | 9,256 | 56.21% | 60,551 | 51.81% | 9,577 | 55.14% | 25,382 | 49.46% | 2,828 | 51.19% |
| Women | 3,349 | 50.02% | 9,292 | 47.19% | 16,430 | 48.24% | 7.211 | 43.79% | 56,319 | 48.19% | 7,792 | 44.86% | 25,932 | 50.54% | 2,697 | 48.81% |
| city | 0 | 0% | 0 | 0% | 0 | 0% | 0 | 0% | 114,773 | 98.21% | 0 | 0% | 6.315 | 12.31% | 0 | 0% |
| country | 6,695 | 100% | 19,692 | 100% | 34,056 | 100% | 16,467 | 100% | 2,097 | 1.79% | 17,369 | 100% | 44,999 | 87.69% | 5,525 | 100% |

