Dimapur (district)
| Dimapur District | |
|---|---|

|
|
| State | Nagaland |
| Administrative headquarters : | Dimapur |
| Area : | 927 km² |
| Residents : | 378,811 (2011) |
| Population density : | 409 inhabitants / km² |
| Website : | www.dimapur.nic.in |
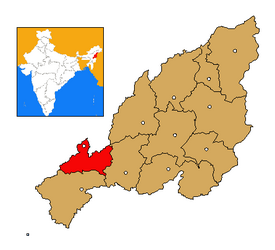
Dimapur is a district in the west of the northeast Indian state of Nagaland .
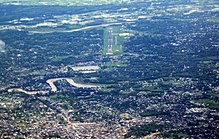
The area is 927 km². The administrative seat is the city of the same name, Dimapur .
population
According to the 2011 census, the Dimapur district has 378,811 inhabitants. With 409 inhabitants per square kilometer, the district is very densely populated. The district is predominantly urban. Of the 378,811 residents, 180,942 people live in rural areas and 197,869 (52.23%) people live in urban communities.
The Dimapur district is one of the areas of India that are predominantly populated by members of the "tribal population" ( scheduled tribes ). Among them were (2011) 223,989 people (59.13 percent of the district population). There is not a single Dalit ( scheduled castes ) in the district.
Of the residents, only 218,804 people (57.76 percent of residents) were born in the district. A total of 64,857 people were born in other Indian states (including 33,256 people in Assam, 10,941 people in Bihar, 5,727 people in Manipur and 2,657 people in West Bengal). Of the 2,634 foreign-born people, 2,199 are from Nepal and only 248 are from the nearby states of Bangladesh and Myanmar.
Population development
As everywhere in India, the population in the Dimapur district has been growing rapidly for decades. The increase in the years 2001-2011 was 22.9 percent (22.92%). In these ten years the population increased by over 70,000 people. From 1960 onwards there was a strong immigration to the then sparsely populated area. This resulted in a population growth of 2300% in just 50 years. The following table illustrates the development:

Significant places
In the district there are four places with more than 10,000 inhabitants with the district capital Dimapur, Chumukedima , Kuda and Diphupar 'A' . Medziphema, Puranabazar 'A' and Rangapahar are places that are also considered cities (notified towns).

District population by gender
As is common in India, the district always had significantly more male than female residents. Due to the high level of immigration, however, it has been well above the Indian average until recently. Among the youngest residents (under 7 years of age) the proportions are 50.86% male to 49.14% female.
| Distribution of the population by gender in the Dimapur district | ||||||||||||||
| 1961 census | 1971 census | 1981 census | 1991 census | 2001 census | 2011 census | |||||||||
| number | proportion of | number | proportion of | number | proportion of | number | proportion of | number | proportion of | number | proportion of | |||
| TOTAL | 15,767 | 100% | 42.002 | 100% | 111,594 | 100% | 176.925 | 100% | 308.174 | 100% | 378.811 | 100% | ||
| Men | 9,051 | 57.40% | 25,549 | 60.83% | 65,351 | 58.56% | 96,725 | 54.67% | 166.247 | 53.95% | 197.394 | 52.11% | ||
| Women | 6,716 | 42.60% | 16,453 | 39.17% | 46.243 | 41.44% | 80,200 | 45.33% | 141,927 | 46.05% | 181.417 | 47.89% | ||
District population by language
The population of the Dimapur district is linguistically very mixed. With Bengali, Nepali and Hindi, three of the five main languages are languages of immigrants. A total of 16 languages are used as mother tongue by at least 1 percent of the population. In addition to the languages listed below, these are Assamese (5,704 people), Dimasa (4,795 people), Manipuri (5,957 people), Sangtam (5,630 people), Sema (3,867 people), Yimchungre (4,357 people) and Zeliang (4,527 people). The following table shows the most widely used languages:
| year | Bengali | Ao | Nepali | Lotha | Hindi | Angami | Bhojpuri | Kuki | Chakhesang | Total | ||||||||||
|---|---|---|---|---|---|---|---|---|---|---|---|---|---|---|---|---|---|---|---|---|
| number | % | number | % | number | % | number | % | number | % | number | % | number | % | number | % | number | % | number | % | |
| 2011 | 57,622 | 15.21 | 41,527 | 10.96 | 21,596 | 5.70 | 18,353 | 4.84 | 17,964 | 4.74 | 13,464 | 3.55 | 8,511 | 2.25 | 7,549 | 1.99 | 6,820 | 1.80 | 378.811 | 100.00% |
| Source: 2011 census result | ||||||||||||||||||||
Population of the district by confession
The Tibetan Burmese residents have converted almost entirely to Christianity in the past 100 years. The most important communities within Christianity are the Presbyterians (Reformed), Baptists, and Catholics. The Hindus and Muslims form significant religious minorities and are mainly immigrants from other regions of India and from Bangladesh. Of the Hindus, 73,427 people (67.43 percent of all Hindus) live in the cities. Their share is 87.55% in Rangapahar, 50.12% in Kuda and 41.11% in Dimapur. The proportion of city dwellers is lower among Muslims than among Hindus. Only in the city of Dimapur are they represented well above average with 11.21 percent of the population. Christians are in the majority both in cities (52.46 percent of residents) and in rural areas (72.09 percent of residents). The following table shows the exact religious composition of the population:
| year | Buddhists | Christians | Hindus | Jainas | Muslims | Sikhs | Other | not specified | Total | |||||||||
|---|---|---|---|---|---|---|---|---|---|---|---|---|---|---|---|---|---|---|
| number | % | number | % | number | % | number | % | number | % | number | % | number | % | number | % | number | % | |
| 2011 | 1,270 | 0.34 | 234.239 | 61.84 | 108,900 | 28.75 | 2.148 | 0.57 | 31,212 | 8.24 | 566 | 0.15 | 157 | 0.04 | 319 | 0.08 | 378.811 | 100.00% |
| Source: 2011 census result | ||||||||||||||||||
education
Thanks to significant efforts, literacy has risen sharply in recent decades. In urban areas, seven out of eight people can read and write. In rural areas, almost 82 percent can read and write. The strong differences between the sexes and the urban / rural population are typical of Indian conditions.
| Literacy in the Dimapur district | ||||||
| unit | 2011 census | |||||
| number | proportion of | |||||
| TOTAL | 278.037 | 84.79% | ||||
| Men | 150.142 | 87.54% | ||||
| Women | 127,895 | 81.77% | ||||
| TOTAL CITY | 151.215 | 87.39% | ||||
| City men | 81,802 | 89.60% | ||||
| City women | 69,413 | 84.92% | ||||
| TOTAL COUNTRY | 126,822 | 81.88% | ||||
| Country men | 68,340 | 85.20% | ||||
| Country women | 58,482 | 78.32% | ||||
| Source: 2011 census result | ||||||
Administrative division
The district was divided into eight circles at the last census in 2011.
| Population in the Circles | ||||||||||||||||
| Aquqhnaqua | Chumukedima | Dansiripar | Dimapur Sadar | Kuhoboto | Medicine topic | Nihokhu | Niuland | |||||||||
| number | proportion of | number | proportion of | number | proportion of | number | proportion of | number | proportion of | number | proportion of | number | proportion of | number | proportion of | |
| TOTAL | 9,193 | 100% | 125,400 | 100% | 17,362 | 100% | 169,613 | 100% | 12,518 | 100% | 24,149 | 100% | 8,699 | 100% | 11,876 | 100% |
| Men | 4,548 | 49.47% | 64,337 | 51.31% | 8,933 | 51.45% | 89,948 | 53.03% | 6,297 | 50.31% | 13,077 | 54.15% | 4,349 | 49.99% | 5,905 | 49.72% |
| Women | 4,645 | 50.53% | 61,063 | 48.69% | 8,429 | 48.55% | 79,665 | 46.97% | 6.222 | 49.69% | 11,072 | 45.85% | 4,350 | 50.01% | 5,971 | 50.28% |
| city | 0 | 0% | 43,516 | 34.70% | 0 | 0% | 145.615 | 85.85% | 0 | 0% | 8,738 | 36.18% | 0 | 0% | 0 | 0% |
| country | 9,193 | 100% | 81,884 | 65.30% | 17,362 | 100% | 23,998 | 14.15% | 12,518 | 100% | 15,411 | 63.82% | 8,699 | 100% | 11,876 | 100% |

