Vavuniya (district)
Coordinates: 8 ° 45 ' N , 80 ° 29' E
| Vavuniya district வவுனியா மாவட்டம் වවුනියාව දිස්ත්රික්කය |
|
|---|---|

|
|
| Province : | Northern Province |
| Administrative headquarters : | Vavuniya |
| Area : | 1,967 km² |
| of which land area: | 1,861 km² |
| of which inland waters: | 106 km² |
| Residents : | 172115 |
| Population density : | 93 people / km² |
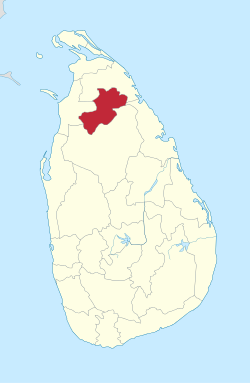
The district of Vavuniya ( Tamil : வவுனியா மாவட்டம் Vavuṉiyā Māvaṭṭam , Sinhala : වවුනියාව දිස්ත්රික්කය Vavuniyāva distrikkaya ) is a district in the northern province of Sri Lanka . The main town is the eponymous city of Vavuniya . The district of Vavuniya was one of the areas affected by the civil war in Sri Lanka from 1983 to 2009 .
geography
The district of Vavuniya is located inland in the north of the island of Sri Lanka and belongs to the northern province . Neighboring districts are Mullaitivu in the northwest, north and northeast, Anuradhapura in the southeast, south and southwest, and Mannar in the west.
The district of Vavuniya has an area of 1,967 square kilometers (1,861 square kilometers of which is land and 106 square kilometers of inland water). This puts it in 15th place among the districts of Sri Lanka in terms of area. The district area belongs to the Vanni region, which includes the northern part of the main island. A considerable part of the Vanni region is still overgrown with dense jungle: According to a survey from 2007, 45 percent of the area of the Vavuniya district is forested, 40 percent is used for agriculture.
history
After the fall of the Sinhalese kingdom of Polonnaruwa , the Vanni region came under the rule of local feudal rulers, the Vanniar , from the 13th century, who were tributaries to the kingdom of Jaffna . With the conquest of Jaffna by the Portuguese , Vanni was at least nominally under Portuguese rule from 1619, and then from 1658 under Dutch rule. In 1796 the Dutch possessions in Ceylon fell to the British . In 1803, the British defeated the Vanniar ruler Pandara Vannian , who had rebelled against them, effectively bringing the Vanni region under their control. In 1833 the area became part of the Northern Province through the reorganization of the Ceylon provinces . The forerunner of today's Vavuniya district was the Vanni district, which was established in 1879. In 1898 the district administration was moved to Mullaitivu , but in 1930 it returned to Vavuniya. At the time of Ceylon independence in 1948, Vavuniya was one of three districts in the Northern Province. In 1978 parts of the Vavuniya district were added to the newly founded Mullaitivu district.
The district of Vavuniya is one of the areas claimed by Tamil separatists as part of an independent Tamil Eelam state and was severely affected by the civil war in Sri Lanka from 1983 to 2009 . As the gateway to the Tamil dominated northern part of the island, Vavuniya was of strategic importance during the conflict. In the early stages of the civil war, the Jaffna Peninsula was still the stronghold of the Tamil rebels of the Liberation Tigers of Tamil Eelam (LTTE), but after the government troops captured Jaffna in December 1995 , the rebels made the Vanni region their main area of operation. In the subsequent phase of the conflict, Vavuniya City remained under the control of the government, while the northern part of the district was fought over several times between government troops and the LTTE. When a ceasefire was signed between the government and the rebels in February 2002, the demarcation line ran at Omanthai in the Vavuniya district. In January 2008, the government terminated the ceasefire agreement and began a northward offensive that eventually resulted in a victory over the LTTE.
population
According to the 2012 census, the Vavuniya district has 172,115 inhabitants. With only 93 inhabitants per square kilometer, it is very sparsely populated and the population density is well below the Sri Lankan average (325 inhabitants per square kilometer). The Vavuniya North division has only 13 inhabitants / km². Of the residents, 84,715 (49.22%) were male and 87,400 (50.78%) were female. The population is very young. This is illustrated by a look at the age distribution.
| Age | 0–9 years | 10–19 years | 20-29 years | 30–39 years | 40-49 years | 50–59 years | 60–79 years | 80 years and more |
| number | 30,980 | 34,123 | 29,259 | 25,760 | 20,550 | 16,458 | 13,659 | 1,326 |
| proportion of | 18.00% | 19.83% | 17.00% | 14.97% | 11.94% | 9.56% | 7.94% | 0.77% |
District population by ethnic group
The Sri Lankan Tamils make up the majority of the population of the Vavuniya district. But there are large minorities of other ethnic groups.
Sri Lankan Tamils The Sri Lankan Tamils are the largest ethnic group. In three of the four divisions they make up the majority of the population. They are represented above average in the Vavuniya North division (93.25% Sri Lankan Tamils). In the Vavuniya South division, they are only weakly represented with 493 people (3.76%).
Sinhalese The proportion of Sinhalese is low today. Nevertheless, Sinhalese settled villages had existed in the southern border areas for a long time. The 1881 census showed a number of 1,157 Sinhalese (7.43% of the population). From 1900 until 1971 more and more Sinhalese immigrated (1971: 15,541 people or 16.27%). Then there was a phase of stagnation until the beginning of the civil war. Many Sinhalese new settlers turned their backs on the area during the fighting. The district of Vavuniya South is almost entirely Sinhalese (share: 96.10%). There are only a few members of this ethnic group in the other three divisions. The Sinhala population ranges between 2.31% in Vengalacheddikulam and 96.10% in Vavuniya South.
Moors third largest ethnic group and thus the second largest minority are the Moors or Tamil-speaking Muslims. Almost all members of this population group live in the divisions Vengalacheddikulam (22.89% Moors) and Vavuniya (4.16%). Their share ranges between 0.02% in Vavuniya South and 22.89% in Vengalacheddikulam.
Indian Tamils The Tamils of Indian descent are descendants of immigrants from India during British colonial rule. At the 1946 census, their population in Vavuniya district was 4.16%. This value rose steadily and reached its peak in 1981 at 19.61%. Many Tamils of Indian origin fled during the civil war. Today their ethnic group is around 90% smaller than before the beginning of the civil war. Only in the Vavuniya division is there a larger number of them (1,686 people or 85% of their ethnic group).
Other ethnic groups The Malay and Burgher are small minorities. The ethnic group of the Indian Moors has almost completely disappeared (in 1946 still 0.54% of the residents or around 125 people).
| year | Sinhalese 1 | Sri Lankan Tamils 2 | Tamils 2 | Moors 3 | Burgher | Malays | Others 4 | Total | ||||||||
|---|---|---|---|---|---|---|---|---|---|---|---|---|---|---|---|---|
| No. | % | No. | % | No. | % | No. | % | No. | % | No. | % | No. | % | No. | % | |
| 1981 | 15,794 | 16.55% | 54.179 | 56.77% | 18,714 | 19.61% | 6,505 | 6.82% | 25th | 0.03% | 34 | 0.04% | 177 | 0.19% | 95,428 | 100.00% |
| 2012 | 17,138 | 9.96% | 141.144 | 82.01% | 1,979 | 1.15% | 11,748 | 6.83% | 58 | 0.03% | 8th | 0.00% | 40 | 0.02% | 172.115 | 100.00% |
| Source: Sri Lankan censuses in 1981 and 2012 | ||||||||||||||||
1 lowland and Kandy Sinhalese together 2 Sri Lankan Tamils and Indian Tamils separately 3 only Sri Lankan moors 4 of which in 2012 neither Sri Lanka Chetties nor Bharathas
Population of the district by confession
The distribution of creeds is partly a reflection of ethnic conditions. On closer inspection, there are significant differences from the rest of the country. The Hinduism , the Sri Lankan and Indian Tamils a majority of the plays, is in Mannar district, the strongest faith. Only fourth is Islam , to which the Moors and Malay belong. The Buddhism is the third largest religious group. However, around 23,000 Tamils (around 16% of their ethnic group) belong to Christianity . Christian Tamils are mainly found in the divisions Vavuniya South (around 35% Christians among the Tamils) and Vengalacheddikulam (around 25% Christians among the Tamils). For this reason, Christians are currently the second largest religious community

| year | Buddhists | Hindus | Muslims | Catholics | other Christs | Other | Total | |||||||
|---|---|---|---|---|---|---|---|---|---|---|---|---|---|---|
| No. | % | No. | % | No. | % | No. | % | No. | % | No. | % | No. | % | |
| 1981 | 15,754 | 16.51% | 65,574 | 68.72% | 6,740 | 7.06% | 6,493 | 6.80% | 845 | 0.89% | 0 | 0.00% | 95,428 | 100.00% |
| 2012 | 16,853 | 9.79% | 119.401 | 69.37% | 11,972 | 6.96% | 15.305 | 8.89% | 8,498 | 4.94% | 86 | 0.05% | 172.115 | 100.00% |
| Source: Sri Lankan censuses in 1981 and 2012 | ||||||||||||||
Population development
For decades, the population of the Vavuniya district grew faster than the country as a whole. This changed shortly before the civil war began. During the war, many people fled from the fighting areas to Vavuniya, which is on the other side of the front lines, so that the population of the district increased considerably. This led to a real population explosion. At the height of this development, around 207,000 people lived in the district in 2009. From 1981 to 2012 (the last two census years) the growth was 76,687 people. This is an increase of 80.4% - despite the emigration of 90% of Tamils of Indian descent during this period. The population has increased more than sevenfold since independence (+ 640%).
According to government statistics, there were 64,500 refugees and returnees living in the Vavuniya district in 2012. Among them were almost 35,000 refugees from other areas of Sri Lanka and almost 30,000 people were resettled after previous displacement.

Significant places
The district is rural. The district capital Vavuniya (2012: 34,816 inhabitants) is the most important city in the district.
Local administration
The head of the district holds the title of District Secretary. The district is further divided into eleven divisions (under a Division Secretary). The cities and larger towns have their own administration (municipal parliament or council). There are 102 village administrations (Grama Niladharis) for the 514 villages in the entire district.
| Surname | main place | Residents 2012 |
Area in km² |
density | GN | Villages |
|---|---|---|---|---|---|---|
| Vavuniya | Vavuniya | 117,533 | 609.7 | 193 | 42 | 214 |
| Vavuniya North | Nerdunky | 11,578 | 769.6 | 15th | 20th | 115 |
| Vavuniya South | Vavuniya | 13,118 | 188.5 | 70 | 20th | 91 |
| Vengalacheddikulam | Cheddikulam | 29,886 | 399.1 | 75 | 20th | 94 |
| Vavuniya district | Vavuniya | 172.115 | 1,861 | 92 | 102 | 514 |
Individual evidence
- ↑ Northern Provincial Council: Statistical Information 2010, p. 52. (PDF; 28.7 MB)
- ^ Map of the ethnic distribution after the 2012 census
- ^ Vavuniya district data after the 2012 census
- ^ Map of religious distribution after the 2012 census
- ^ Vavuniya district data after the 2012 census
- ↑ Migrants by reason of migration and district.
- ↑ Handbook of the District of Vavuniya 2011, Table 1.1
- ^ Statoids, Administrative Areas of Sri Lanka
- ↑ Handbook of the District of Vavuniya 2011, Table 1.5
Web links
- Website of the district (English)

