
Ampara (district)
Coordinates: 7 ° 17 ' N , 81 ° 40' E
| Ampara District අම්පාර දිස්ත්රික්කය அம்பாறை மாவட்டம் |
|
|---|---|

|
|
| Province : | Eastern Province |
| Administrative headquarters : | Ampara |
| Area : | 4,415 km² |
| of which land area: | 4,222 km² |
| of which inland waters: | 193 km² |
| Residents : | 649402 |
| Population density : | 154 inhabitants / km² |
Ampara ( Sinhala අම්පාර දිස්ත්රික්කය amipāra distrikkaya ; Tamil அம்பாறை மாவட்டம் Amparai māvaṭṭam ) is a district in the Eastern Province in Sri Lanka . The main town is Ampara .
geography
The Ampara district is mostly located in the southeastern coastal region and partly in the eastern interior of Sri Lanka and belongs to the Eastern Province . Neighboring districts are Polonnaruwa and Batticaloa in the north, Matale , Badulla and Moneragala in the west, Hambantota in the south and the Indian Ocean in the east.
The district of Ampara has an area of 4,415 square kilometers (of which 4,222 square kilometers are land and 193 square kilometers are inland water). This makes it the fourth largest district in Sri Lanka in terms of area.
population
According to the 2012 census, the Ampara district has 649,402 inhabitants. With 154 inhabitants per square kilometer, the population density is well below the Sri Lankan average (325 inhabitants per square kilometer). Of the residents, 314,352 (48.41%) were male and 335,050 (51.59%) were female. The population is very young. This is illustrated by a look at the age distribution.
| Age | 0–9 years | 10–19 years | 20-29 years | 30–39 years | 40-49 years | 50–59 years | 60–79 years | 80 years and more |
| number | 131.294 | 121,028 | 104,828 | 95,308 | 82.107 | 61,974 | 48,885 | 3,978 |
| proportion of | 20.22% | 18.63% | 16.14% | 14.68% | 12.64% | 9.54% | 7.53% | 0.61% |
District population by ethnic group
A relative majority of the residents of Ampara District are Moors, or Tamil-speaking Muslims. There are also large minority groups of Sinhalese and Tamils . The Sinhalese ethnic group has grown more rapidly since independence (1963–2012: +307%) than the Moors (+189%) and Tamils (+129%). In the twenty administrative units, the Moors are in the majority in eight, the Sinhalese in seven and the Tamils in five. The district is very ethnically mixed in three of these areas; the other 17 have clear ethnic majorities.
| year | Moors 1 | Sinhalese 2 | Sri Lankan Tamils 3 | Tamils from India 3 | Burgher | Malays | Others 4 | Total | ||||||||
|---|---|---|---|---|---|---|---|---|---|---|---|---|---|---|---|---|
| No. | % | No. | % | No. | % | No. | % | No. | % | No. | % | No. | % | No. | % | |
| 1963 | 97,621 | 46.11% | 61,996 | 29.28% | 49.185 | 23.23% | 1.312 | 0.62% | k.Ang. | ? | k. Ang. | ? | 1,618 | 0.76% | 211,732 | 100.00% |
| 1971 | 126,365 | 46.35% | 82,280 | 30.18% | 60,519 | 22.20% | 1,771 | 0.65% | k.Ang. | ? | k. Ang. | ? | 1,670 | 0.61% | 272,605 | 100.00% |
| 1981 | 161,568 | 41.54% | 146.943 | 37.78% | 77,826 | 20.01% | 1,411 | 0.36% | 697 | 0.18% | 168 | 0.04% | 357 | 0.09% | 388,970 | 100.00% |
| 2001 | 244,620 | 41.25% | 236,583 | 39.90% | 109,188 | 18.41% | 715 | 0.12% | 1,184 | 0.20% | 225 | 0.04% | 482 | 0.08% | 592.997 | 100.00% |
| 2007 | 268,630 | 43.99% | 228.938 | 37.49% | 111,948 | 18.33% | 58 | 0.01% | 929 | 0.15% | 163 | 0.03% | 53 | 0.01% | 610.719 | 100.00% |
| 2012 | 281,702 | 43.38% | 252,458 | 38.88% | 112,457 | 17.32% | 846 | 0.13% | 1,036 | 0.16% | 187 | 0.03% | 716 | 0.11% | 649.402 | 100.00% |
| Source: Sri Lanka censuses 1963 to 2001 and 2012; Special census 2007 | ||||||||||||||||
1 only Sri Lankan moors 2 lowland and Kandy Sinhalese together 3 Sri Lankan Tamils and Indian Tamils separately 4 of these: 1963 and 1971 with the Burghern and Malays; 2001: 136 Sri Lankan Chetties and 19 Bharathas; 2012: 5 Sri Lanka Chetties and no Bharatha
Population of the district by confession
Almost all Sinhala residents of Ampara are Buddhist , while the Moors and Malays are all Islamic . While Hinduism , to which the majority of Tamils belong, has a significant following, Christianity , to which a minority of Tamils and the Burgher belong, is only a small minority religion.

| year | Buddhists | Hindus | Muslims | Catholics | other Christs | Other | Total | |||||||
|---|---|---|---|---|---|---|---|---|---|---|---|---|---|---|
| No. | % | No. | % | No. | % | No. | % | No. | % | No. | % | No. | % | |
| 1981 | 145,687 | 37.45% | 72,809 | 18.72% | 162.140 | 41.68% | 5,643 | 1.45% | 2,387 | 0.61% | 304 | 0.08% | 388,970 | 100.00% |
| 2001 | 235,652 | 39.74% | 100.213 | 16.90% | 245.179 | 41.35% | 7,816 | 1.32% | 3,969 | 0.67% | 168 | 0.03% | 592.997 | 100.00% |
| 2012 | 251,427 | 38.72% | 102,829 | 15.83% | 281.987 | 43.42% | 7,588 | 1.17% | 5,541 | 0.85% | 30th | 0.00% | 649.402 | 100.00% |
| Source: Sri Lanka censuses in 1981, 2001 and 2012 | ||||||||||||||
Population development
The district's population is growing rapidly. In the period from 2001 to 2012 (the last two census years) the increase was 56,405 people. This is a growth of 9.51%. Since 1963 the population has more than tripled.

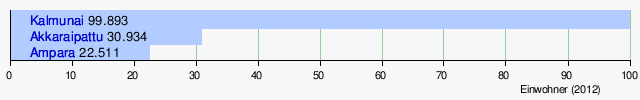
Significant places
The only big places are Akkaraipattu , Ampara and Kalmunai .
history
The district is a post-war re-establishment. It was created in 1958 from parts of the previous Batticaloa district .
Local administration
The head of the district holds the title of District Secretary. The district is further divided into twenty divisions (under a Division Secretary). The cities and larger towns have their own administration (municipal parliament or council). There are 503 village administrations (Grama Niladharis) for the 614 villages in the entire district.


| Surname | main place | Residents 2012 |
Area in km² |
density | GN | Villages |
|---|---|---|---|---|---|---|
| Addalachchenai | Addalachchenai | 41,968 | 52.5 | 799 | 32 | 20th |
| Akkaraipattu | Akkaraipattu | 39.166 | 102.2 | 383 | 28 | 11 |
| Alayadiwembu | Alayadiwembu | 22,458 | 127.5 | 176 | 22nd | 25th |
| Ampara | Ampara | 43,829 | 225 | 195 | 22nd | 29 |
| Damana | Damana | 38,692 | 426.2 | 91 | 33 | 81 |
| Dehiattakandiya | Dehiattakandiya | 60.178 | 432.5 | 139 | 13 | 47 |
| Iraq came | Iraq came | 14,383 | 84.3 | 171 | 12 | 24 |
| Kalmunai | Kalmunai | 44,632 | k.Ang. 5 | unb. | 29 | 7th |
| Kalmunai Tamil | Kalmunai Tamil | 29,800 | k.Ang. 5 | unb. | 29 | 5 |
| Karaitivu | Karaitivu | 16,839 | 31.3 | 538 | 17th | 18th |
| Lahugala | Lahugala | 8,914 | 616.9 | 14th | 12 | 19th |
| Mahaoya | Mahaoya | 20,828 | 583.6 | 36 | 17th | 73 |
| Navithanveli | Navithanveli | 18,727 | 57.7 | 325 | 20th | 21st |
| Ninthavur | Ninthavur | 26,361 | 55.6 | 474 | 25th | 9 |
| Padiyathalawa | Padiyathalawa | 18,290 | 464.4 | 39 | 20th | 75 |
| Pothuvil | Pottuvil | 34,809 | 367.5 | 95 | 27 | 36 |
| Sainthamarathu | Sainthamarathu | 25,461 | 6th | 4,244 | 17th | 1 |
| Samanthurai | Samanthurai | 60,465 | 114.7 | 527 | 51 | 37 |
| Thirukkovil | Thirukkovil | 25,277 | 190.6 | 133 | 22nd | 11 |
| Uhana | Uhana | 58,325 | 415.6 | 140 | 55 | 65 |
| Ampara District | Ampara | 649.402 | 4,222 | 154 | 503 | 614 |
5 Kalmunai and Kalmunai Tamil together 60.9 km²; results in an average density of 1,222 people / km²
Individual evidence
- ↑ Final result of the 2012 census
- ^ Map of the ethnic distribution after the 2012 census
- ↑ Ampara district data after the 2012 census
- ^ Map of religious distribution after the 2012 census
- ↑ Ampara district data after the 2012 census
- ↑ Handbook of the District Ampara 2011, table 1.1
- ^ Statoids, Administrative Areas of Sri Lanka
- ↑ Handbook of the District Ampara 2011, Table 1.5
Web links
- Website of the district (English)
Ampara | Anuradhapura | Badulla | Batticaloa | Colombo | Bile | Gampaha | Hambantota | Jaffna | Kalutara | Kandy | Kegalle | Kilinochchi | Kurunegala | Mannar | Matale | Matara | Moneragala | Mullaitivu | Nuwara Eliya | Polonnaruwa | Puttalam | Ratnapura | Trincomalee | Vavuniya