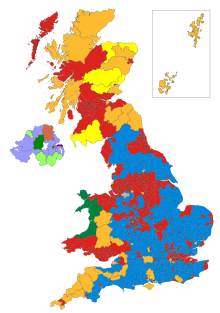
British general election 1997
The 1997 general election of May 1, 1997 brought the first change of government in 18 years. The Labor Party under Tony Blair defeated the previously ruling Conservative Party under John Major . This election was referred to as a "bloodbath" for the Conservatives. They lost more than half of their previous mandates, including all in Scotland and Wales . Labor won the largest majority for any party in British history (179).
Various prominent Conservatives, including several cabinet members, were voted out of office. These included Secretary of Defense Michael Portillo , Secretary of State Malcolm Rifkind , Minister of Commerce and Industry Ian Lang and Minister of Scotland Michael Forsyth .
The Liberal Democrats more than doubled their mandates and achieved their best result since the 1920s, when they were last represented in government. The referendum party , which demanded a vote to leave the EU , reached fourth place with more than 800,000 votes, but could not win any seats. Still, it stole valuable votes from the conservatives.
Election results
| Political party | be right | Mandates | ||||
|---|---|---|---|---|---|---|
| number | % | +/- | number | +/- | ||
| Labor Party | 13,517,911 | 43.2 | +8.8 | 418 | +147 | |
| Conservative party | 9,600,940 | 30.7 | −11.2 | 165 | −171 | |
| Liberal Democrats | 5,243,440 | 16.8 | −1.0 | 46 | +26 | |
| Referendum party | 811,829 | 2.6 | +2.6 | - | - | |
| Scottish National Party | 622.260 | 2.0 | +0.1 | 6th | +3 | |
| Ulster Unionist Party | 258,349 | 0.8 | - | 10 | +1 | |
| Social Democratic and Labor Party | 190.814 | 0.6 | +0.1 | 3 | −1 | |
| Plaid Cymru | 161.030 | 0.5 | - | 4th | - | |
| Sinn Féin | 127.144 | 0.4 | +0.2 | 2 | +2 | |
| Democratic Unionist Party | 107,348 | 0.3 | - | 2 | −1 | |
| UK Independence Party | 106.001 | 0.3 | +0.3 | - | - | |
| Independent | 64,482 | 0.2 | - | 1 | - | |
| Green Party of England and Wales | 64,452 | 0.2 | -0.3 | - | - | |
| Alliance Party of Northern Ireland | 62,972 | 0.2 | - | - | - | |
| Socialist Labor Party | 52.110 | 0.2 | +0.2 | - | - | |
| Liberal party | 45.229 | 0.1 | -0.1 | - | - | |
| British National Party | 35,519 | 0.1 | +0.1 | - | - | |
| Independent Labor | 34,418 | 0.1 | - | - | - | |
| Natural Law Party | 30,713 | 0.1 | -0.1 | - | - | |
| Speaker | 23,969 | 0.1 | - | 1 | - | |
| Independent Conservative | 20,279 | 0.1 | - | - | - | |
| Prolife Alliance | 19,017 | 0.1 | +0.1 | - | - | |
| UK Unionist Party | 12,817 | 0.0 | - | 1 | +1 | |
| Progressive Unionist Party | 10,934 | 0.0 | - | - | - | |
| National Democrats | 10,829 | 0.0 | - | - | - | |
| Others | 53,302 | 0.3 | - | - | - | |
| total | 31.288.108 | 100.0 | 659 | |||
| Eligible voters | 43,784,559 | |||||
| voter turnout | 71.46% | |||||
| Source: | ||||||
See also
Individual evidence
- ↑ a b Summary results of the 1997 election. United Kingdom Election Results (English)
