
Results of the parliamentary elections in the canton of Basel-Stadt

The following list shows the results of the parliamentary elections in the canton of Basel-Stadt (consisting of Basel , Riehen and Bettingen ). The results of the elections to the Grand Council from 1902 are given.
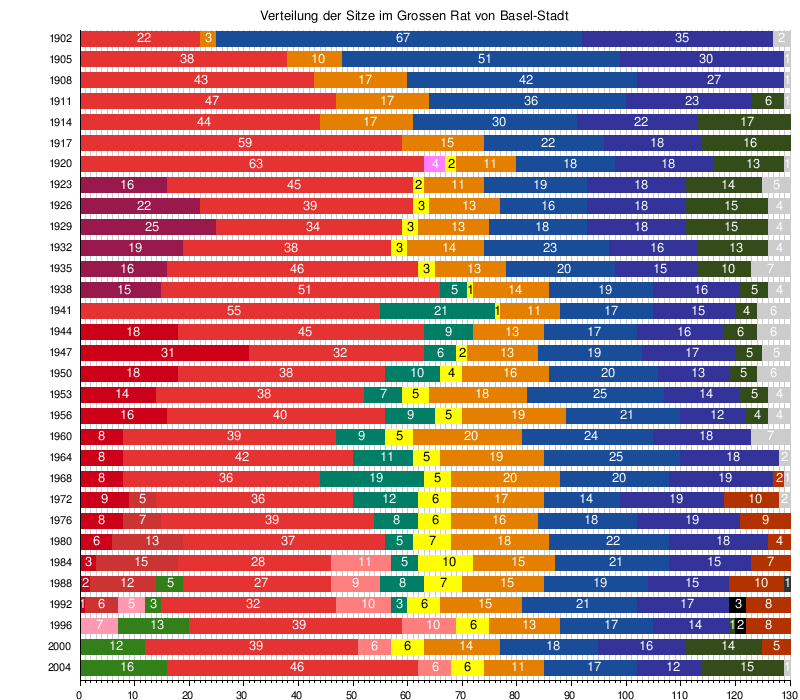
In the percentage distribution of the number of voters, only those parties are listed that have received at least 1.95 percent of the votes in at least one Grand Council election. The field of the party that received the most votes or seats in the respective election is marked in color.
Parties
The abbreviations used in the tables correspond to the following parties:
- BastA: Basel's strong alternative → election results in GB
- CVP: Christian Democratic People's Party
- until 1960: Catholic People's Party
- 1964–1968: Catholic-Christian Social People's Party
- since 1972: Christian Democratic People's Party
- DSP: Democratic Social Party (SPF split off, dissolved in 2009)
- EDU: Federal Democratic Union → 2008 election results for the SD
- EPP: Evangelical People's Party of Switzerland
- until 2004: Association of Protestant Voters
- since 2008: Evangelical People's Party
- 2012 and 2016: List association with BDP
- FDP: Liberal Democratic Party
- FraP: women make politics!
- GB: Green Alliance
- glp: Green Liberal Party
- GPS: Swiss Green Party
- LDP: Liberal Democratic Party (Basel) (member of the FDP Switzerland since 2009)
- until 1956: Liberal Party
- 1960–1976: Liberal Democratic Citizens' Party
- since 1980: Liberal Democratic Party
- until 1938: Communist Party of Switzerland (banned in 1940)
- since 1944: Swiss Labor Party
- until 1988: National action against foreign infiltration of people and homeland
- from 1992: Swiss Democrats
- 1911–1917: Progressive Citizens' Party (split from the FDP)
- 1920–1932: Civil and trade party
- 1935–1941: National People's Party
- 1944–1956: Citizen and Trade Party
- 1957: Merger with the Liberal Party to form the Liberal Democratic Citizens' Party
- 1991: Re-establishment of the Swiss People's Party in Basel-Stadt
- VA: People's action against too many foreigners and asylum seekers in our homeland (split from the SD)
Grand Council elections
Percentage distribution of the number of voters
| year | PLC | SVP | LDP | GB 3 | FDP | CVP | glp | EPP 2 | DSP | SD 1 | FraP | POB | GPS | LdU | PdA |
|---|---|---|---|---|---|---|---|---|---|---|---|---|---|---|---|
| 1926 | 30.2 | 11.6 | 13.4 | 12.5 | 9.4 | 17.1 | |||||||||
| 1929 | 25.7 | 11.5 | 13.5 | 14.0 | 9.7 | 3.3 | 19.7 | ||||||||
| 1932 | 29.4 | 10.4 | 11.6 | 17.0 | 11.0 | 3.0 | 15.0 | ||||||||
| 1935 | 32.6 | 8.1 | 11.7 | 15.0 | 10.4 | 2.9 | 13.0 | ||||||||
| 1938 | 35.7 | 4.4 | 12.0 | 14.6 | 10.2 | 2.3 | 4.3 | 11.7 | |||||||
| 1941 | 39.8 | 4.3 | 10.5 | 12.7 | 9.3 | 2.4 | 15.9 | ||||||||
| 1944 | 34.6 | 5.2 | 11.2 | 12.3 | 10.4 | 7.4 | 12.9 | ||||||||
| 1947 | 25.3 | 4.7 | 12.2 | 13.1 | 10.3 | 2.8 | 4.2 | 23.2 | |||||||
| 1950 | 28.1 | 5.1 | 10.3 | 14.3 | 11.3 | 3.4 | 6.9 | 14.6 | |||||||
| 1953 | 28.3 | 4.5 | 10.5 | 18.1 | 13.0 | 4.3 | 5.9 | 12.3 | |||||||
| 1956 | 30.2 | 3.7 | 9.7 | 15.4 | 13.5 | 4.2 | 8.3 | 13.1 | |||||||
| 1960 | 29.2 | 13.4 | 17.7 | 14.4 | 4.9 | 7.8 | 6.5 | ||||||||
| 1964 | 29.8 | 14.2 | 19.3 | 14.4 | 5.0 | 9.3 | 7.1 | ||||||||
| 1968 | 26.3 | 14.9 | 14.0 | 14.5 | 5.7 | 2.3 | 14.3 | 5.8 | |||||||
| 1972 | 25.6 | 0.8 | 14.4 | 11.3 | 13.1 | 5.8 | 7.9 | 3.6 | 9.0 | 6.4 | |||||
| 1976 | 28.6 | 14.8 | 13.2 | 12.7 | 5.9 | 6.8 | 5.5 | 6.7 | 5.3 | ||||||
| 1980 | 26.5 | 13.7 | 15.6 | 13.1 | 7.3 | 3.8 | 9.1 | 5.2 | 4.4 | ||||||
| 1984 | 19.9 | 10.1 | 15.2 | 11.9 | 8.3 | 8.2 | 5.7 | 8.9 | 1.8 | 5.4 | 2.6 | ||||
| 1988 4 | 18.3 | 11.0 | 13.9 | 10.6 | 6.2 | 8.2 | 7.8 | 7.8 | 5.4 | 5.7 | 2.0 | ||||
| 1992 | 20.7 | 3.8 | 12.5 | 15.1 | 10.4 | 5.3 | 7.8 | 5.5 | 4.0 | 5.2 | 3.5 | 2.5 | 1.4 | ||
| 1996 | 27.0 | 3.5 | 10.7 | 9.4 | 12.4 | 9.5 | 5.8 | 8.2 | 6.1 | 5.7 | GB | ||||
| 2000 | 26.0 | 10.0 | 11.3 | 9.6 | 12.6 | 9.9 | 5.6 | 6.0 | 4.6 | GB | |||||
| 2004 | 31.2 | 12.1 | 8.6 | 10.9 | 11.7 | 8.1 | 5.5 | 4.8 | 2.9 | ||||||
| 2008 | 28.2 | 13.9 | 9.0 | 13.0 | 10.1 | 9.3 | 5.1 | 5.2 | 3.2 | 2.2 | |||||
| 2012 | 30.7 | 15.0 | 9.6 | 11.8 | 11.1 | 7.3 | 5.0 | 5.3 | |||||||
| 2016 | 32.5 | 14.3 | 13.8 | 13.4 | 9.2 | 5.9 | 4.3 | 4.0 |
Distribution of seats
| year | Ges. | PLC | SVP | LDP | GB | FDP | CVP | glp | EPP | DSP | SD | FraP | POB | GPS | LdU | PdA | Otherwise. |
|---|---|---|---|---|---|---|---|---|---|---|---|---|---|---|---|---|---|
| 1902 | 130 | 22nd | 35 | 67 | 3 | 3 | |||||||||||
| 1905 | 130 | 38 | 30th | 51 | 10 | 1 | |||||||||||
| 1908 | 130 | 43 | 27 | 42 | 17th | 1 | |||||||||||
| 1911 | 130 | 47 | 6th | 23 | 36 | 17th | 1 | ||||||||||
| 1914 | 130 | 44 | 17th | 22nd | 30th | 17th | |||||||||||
| 1917 | 130 | 59 | 16 | 18th | 22nd | 15th | |||||||||||
| 1920 | 130 | 63 | 13 | 18th | 18th | 11 | 2 | 5 | |||||||||
| 1923 | 130 | 45 | 14th | 18th | 19th | 11 | 2 | 16 | 5 | ||||||||
| 1926 | 130 | 39 | 15th | 18th | 16 | 13 | 3 | 22nd | 4th | ||||||||
| 1929 | 130 | 34 | 15th | 18th | 18th | 13 | 3 | 25th | 4th | ||||||||
| 1932 | 130 | 38 | 13 | 16 | 23 | 14th | 3 | 19th | 4th | ||||||||
| 1935 | 130 | 46 | 10 | 15th | 20th | 13 | 3 | 16 | 7th | ||||||||
| 1938 | 130 | 51 | 5 | 16 | 19th | 14th | 1 | 5 | 15th | 4th | |||||||
| 1941 | 130 | 55 | 4th | 15th | 17th | 11 | 1 | 21st | 6th | ||||||||
| 1944 | 130 | 45 | 6th | 16 | 17th | 13 | 9 | 18th | 6th | ||||||||
| 1947 | 130 | 32 | 5 | 17th | 19th | 13 | 2 | 6th | 31 | 5 | |||||||
| 1950 | 130 | 38 | 5 | 13 | 20th | 16 | 4th | 10 | 18th | 6th | |||||||
| 1953 | 130 | 38 | 5 | 14th | 25th | 18th | 5 | 7th | 14th | 4th | |||||||
| 1956 | 130 | 40 | 4th | 12 | 21st | 19th | 5 | 9 | 16 | 4th | |||||||
| 1960 | 130 | 39 | LDP | 18th | 24 | 20th | 5 | 9 | 8th | 7th | |||||||
| 1964 | 130 | 42 | 18th | 25th | 19th | 5 | 11 | 8th | 2 | ||||||||
| 1968 | 130 | 36 | 19th | 20th | 20th | 5 | 2 | 19th | 8th | 1 | |||||||
| 1972 | 130 | 36 | 19th | 14th | 17th | 6th | 10 | 5 | 12 | 9 | 2 | ||||||
| 1976 | 130 | 39 | 19th | 18th | 16 | 6th | 9 | 7th | 8th | 8th | |||||||
| 1980 | 130 | 37 | 18th | 22nd | 18th | 7th | 4th | 13 | 5 | 6th | |||||||
| 1984 | 130 | 28 | 15th | 21st | 15th | 10 | 11 | 7th | 15th | 5 | 3 | ||||||
| 1988 | 130 | 27 | 15th | 19th | 15th | 7th | 9 | 10 | 12 | 5 | 8th | 2 | 1 | ||||
| 1992 | 130 | 32 | 17th | 21st | 15th | 6th | 10 | 8th | 5 | 6th | 3 | 3 | 1 | 3 | |||
| 1996 | 130 | 39 | 1 | 14th | 13 | 17th | 13 | 6th | 10 | 8th | 7th | 2 | |||||
| 2000 | 130 | 39 | 14th | 16 | 12 | 18th | 14th | 6th | 6th | 5 | GB | ||||||
| 2004 | 130 | 46 | 15th | 12 | 16 | 17th | 11 | 6th | 6th | 1 | |||||||
| 2008 | 100 | 32 | 14th | 9 | 13 | 11 | 8th | 5 | 4th | 3 | 1 | ||||||
| 2012 | 100 | 33 | 15th | 10 | 13 | 12 | 8th | 5 | 1 | 3 5 | |||||||
| 2016 | 100 | 34 | 15th | 14th | 14th | 10 | 7th | 4th | 1 | 1 6 |
Footnotes
1 SD: until 2004: SD, 2008: SD / EDU
2 EVP: until 2004: VEW, 2008: EVP, 2012: EVP / GDP: 3.9%, EVP: 1.4%, 2016: EVP / GDP: 2 , 6%, EVP: 1.4%
3 GB: 1996: GB, 2000: BastA (Greens and FraP), from 2004: GB
4 1988: additionally: PvA: 2.0%
5 VA: 2 seats, AB (active Bettingen): 1 seat
6 AB (Active Bettingen): 1 seat
Graphic representation

Individual evidence
- ↑ a b Canton of Basel-Stadt: national and cantonal elections since 1919. Federal Statistical Office, October 20, 2019, accessed on February 7, 2020 .
- ↑ Allocation of seats in the Grand Council of the Canton of Basel-Stadt since 1902. Statistical Office of the Canton of Basel-Stadt, accessed on February 7, 2020 .
- ↑ Jan Krieger: Halfway through the legislative period 1972/1976. In: Basler Stadtbuch. Christoph Merian Foundation, accessed on February 8, 2020 .