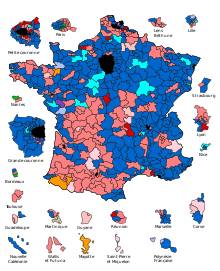
Parliamentary election in France 2007
First ballot
%
40
30th
20th
10
0
39.54
24.73
7.61
4.29
4.29
3.41
3.25
2.47
10.41
Gains and losses
compared to 2002
% p
8th
6th
4th
2
0
-2
-4
-6
-8th
+6.24
+0.62
+2.75
-0.53
-7.05
+0.94
-1.26
-1.18
-0.53
The 2007 parliamentary elections in France took place on June 10th and 17th, 2007. All 577 seats in the National Assembly were newly elected.
Starting position
In the elections, 7,639 candidates ran for 577 seats. After the first round of elections on June 19, 2007, a large majority for the UMP presidential party was predicted by Nicolas Sarkozy and parties that support it. In the second round of the election, however, the race became tighter in the election results and the left-wing parties gained ground. Nevertheless, the coalition of the ruling parties under Nicolas Sarkozy achieved a majority. The National Assembly elections took place shortly after the 2007 French presidential election.
Results
| political parties |
Votes (first ballot) |
Votes (second ballot) |
Seats | |||||||||
|---|---|---|---|---|---|---|---|---|---|---|---|---|
| absolutely | in % | +/-% | Elected MPs |
absolutely | in % | +/-% | Elected MPs |
Elected MPs |
+/- | |||
| Extreme left | 888.250 | 3.41 | +0.62 | 0 | - | - | - | - | 0 | ± 0 | ||
| Parti communiste français (PCF) | 1,115,663 | 4.29 | −0.53 | 0 | 464.739 | 2.28 | −0.98 | 0 | 15th | −6 | ||
| Parti socialiste (PS) | 6,436,520 | 24.73 | +0.62 | 1 | 8,624,861 | 42.27 | +6.99 | 185 | 186 | +46 | ||
| Parti radical de gauche (PRG) | 343,565 | 1.32 | −0.23 | 0 | 333.194 | 1.63 | −0.52 | 7th | 7th | ± 0 | ||
| Various lefts ( Divers gauche ) | 513,407 | 1.97 | +0.88 | 0 | 503,556 | 2.47 | +1.20 | 15th | 15th | +8 | ||
| Les Verts | 845.977 | 3.25 | −1.26 | 0 | 90.975 | 0.45 | −2.74 | 4th | 4th | +1 | ||
| Green parties | 208,456 | 0.80 | −0.37 | 0 | - | - | - | - | 0 | ± 0 | ||
| Regional parties | 133,473 | 0.51 | +0.25 | 0 | 106,484 | 0.52 | +0.38 | 1 | 1 | +1 | ||
| Chasse, pêche, nature, traditions (CPNT) | 213,427 | 0.82 | −0.85 | 0 | - | - | - | - | 0 | ± 0 | ||
| Other | 267.760 | 1.03 | +1.03 | 0 | 33,068 | 0.16 | +0.16 | 1 | 1 | +1 | ||
| Union for French Democracy (UDF) | 1,981,107 | 7.61 | +2.76 | 0 | 100.115 | 0.49 | −3.43 | 3 | 3 | -24 | ||
| Majorité Présidentielle (MAJ) | 616.440 | 2.37 | +2.37 | 8th | 433.057 | 2.12 | 13 | 22nd | +22 | |||
| Union for a Popular Movement (UMP) | 10,289,737 | 39.54 | +6.24 | 98 | 9.460.710 | 46.36 | −0.89 | 215 | 313 | −47 | ||
| Mouvement pour la France (MPF) | 312,581 | 1.2 | +0.40 | 1 | - | - | - | - | 1 | ± 0 | ||
| Various rights ( Divers droite ) | 641,842 | 2.47 | −0.82 | 2 | 238,588 | 1.17 | −0.12 | 7th | 9 | −2 | ||
| Front National (FN) | 1,116,136 | 4.29 | −7.05 | 0 | 17,017 | 0.08 | −1.17 | 0 | 0 | ± 0 | ||
| Extreme rights | 102.124 | 0.39 | −0.94 | 0 | - | - | - | - | 0 | ± 0 | ||
| Registered voters | 43,895,833 | 100.0 | 35.225.248 | 100.0 | ||||||||
| Non-voters | 17,374,011 | 39.58 | 14.096.209 | 40.02 | ||||||||
| Voting total | 26,521,822 | 60.42 | 21.129.039 | 59.98 | ||||||||
| Invalid votes and blank ballot papers | 495.357 | 1.13 | 722.585 | 2.05 | ||||||||
| Total votes | 26,026,465 | 59.29 | 20,406,454 | 57.93 | ||||||||
| Source: French Ministry of the Interior | ||||||||||||
Composition of the 13th National Assembly
A total of 577 seats
- Left : 24
- Socialists : 204
- Non-attached: 6
- New center : 23
- UMP : 320
| fraction | Chairman | Parties | Seats | Affiliates ( Apparentés ) | All in all | |
|---|---|---|---|---|---|---|
|
UMP Group ( Union pour un Mouvement Populaire ) |
Jean-François Copé | UMP , Divers droite | 314 | 6th | 320 | |
|
Socialists , Radicals and Citizens Group ( Groupe socialiste, radical et citoyen ) |
Jean-Marc Ayrault | PS , PRG , Divers gauche , MRC | 186 | 18th | 204 | |
|
Democratic and republican left ( Gauche démocrate et républicaine ) |
Jean-Claude Sandrier | PCF , Parti de gauche , Les Verts , Mouvement Indépendantiste Martiniquais , Parti communiste réunionnais | 24 | 0 | 24 | |
|
New Center-Presidential Majority ( Nouveau Center-Majorité Présidentielle ) |
François Sauvadet | Nouveau Center - Parti social liberal européen , divers droite | 20th | 3 | 23 | |
| Non-attached | MoDem , DLR , MPF | 6th | 0 | 6th | ||
| All in all: | 551 | 26th | 577 | |||
Web links
Commons : French legislative elections (2007) - collection of pictures, videos and audio files

