Sun position diagram
A sun position diagram is an axis diagram of the position of the sun as a function of the horizontal coordinates, height and direction ( azimuth ) of the sun .
As a rule, an xy-axis diagram is made and the equatorial coordinates of the hour and angle of declination at rest are entered as parameters :
- Hour angle: mostly coded as time of day,
- Declination angle: mostly coded as a day of the year.
horizontal to equatorial coordinates: see conversion
A sun position diagram is only valid for locations with the same geographical latitude and only for a single location if it is not parameterized with the local solar time (true or mean), but with zone time . From a sun position diagram of a place you can read the sun position there at any time of day and on any day of the year and also the changing duration of sunshine .
The dial of a sundial with a point that casts a shadow can be expanded into a sun position diagram if it is also provided with an altitude and an azimuth scale. The parameter curves for the time of day and the season are available. They are used to indicate when the sundial is used as intended. A common axis diagram is obtained by scaling the dial of a hollow cylinder vertical sundial accordingly, unfolding it in the plane, mirroring it around the vertical axis and turning it upside down.

Sun position diagram ( height above azimuth )
for all locations with φ = 49 ° North :
parameterized with true local time on hour lines

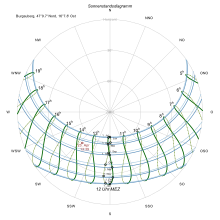
Polar diagram of the position of the sun for Burgauberg (47.16 ° N, 16.13 ° E, see also the corresponding xy-axis diagram)
Representations
Sun position diagram with hour lines
In the course of a day, the sun appears to move along an arc from east to south to west ¹) in order to set there. This day arc is drawn in the sun position diagram in Figure 1 for twelve days of the year (around the beginning of the zodiac). Each sheet is valid for two different days of the year except for the solstices , which is why the diagram only contains seven sheets.
¹) Day arcs in Central Europe: in summer from northeast to south to northwest, in winter from southeast to southwest.
It is made for true solar time (or true local time): When the sun is in the south, it is 12 o'clock and true noon. Same true hours of the year are connected with simple lines. At the chosen latitude of 49 ° the longest day of the year is 16 hours (4h to 20h), the shortest is 8 hours (8h to 16h).
The position of the sun to be determined is repeated year after year. This means that the very slow changes in the (apparent) course of the sun are not taken into account. The position of the sun is drawn in a year diagram that can be used repeatedly, from which it can even be read with sufficient accuracy in both common and leap years .
The solar declination between the limits δ = ± 23.44 ° is given for equal parts of the ecliptic, for example every 30 ° with δ = ± 23.44 °, ± 20.15 °, ± 11.47 ° and 0 °.
For example, for whole true hours, the hour angle τ = 0 ° ± n15 ° (n = 1 for the first hour before and after true noon, etc.)
Sun position diagram with hourly loops (analemmas)
In order to be able to use a sun position diagram for mean solar time (or mean local time) or, as is mainly the case for zone time ( e.g. CET ), it is parameterized with loops for mean hours ( analemmas ) instead of straight hour lines. Such hour loops are also used on sundials to make corrections (see equation of time ) for displaying the mean solar time.
In the diagram in Figure 2, in addition to the correction of the equation of time, the time shift from about 14 minutes earlier to CET has been made. It therefore only applies to Munich with a longitude more westerly than 15 ° East (CET = mean solar time at 15 ° East).
Sun position diagram in polar coordinates
A sun position diagram shown in polar coordinates has the compass rose as a base and clearly shows the azimuth of the sun (Figure 5).) An xy-axis diagram is a more abstract representation compared to this.
Individual evidence
- ↑ Willy Leenders: Largest vertical sundial in Belgium. Picture on page 2: Hollow cylinder sundial in New Haven (USA) (PDF; 226 kB)
- ↑ Example also in: G.Waller: Sun position diagram and radiation balances , page 8: Sun position diagram for Kiel ( Memento from February 28, 2013 in the Internet Archive ) (PDF 337 kB)


