
Botad (district)
| Botad district | |
|---|---|

|
|
| State | Gujarat |
| Administrative headquarters : | Botad |
| Area : | 2564 km² |
| Residents : | 656.005 (2011) |
| Population density : | 256 people / km² |
| Website : | botaddp.gujarat.gov.in |
The Botad District is a district in Gujarat State in India . The city of the same name Botad is the capital of the district. The last census in 2011 showed a total population of 656,005 people.
history
The district emerged in 2013 from the Barwala and Ranpur sub-districts of the Ahmedabad district and the Botad and Gadhada sub-districts of the Bhavnagar district .
population
The number of Adivasi (scheduled castes) is relatively small at 43,270 people or 6.6 percent. The same applies to the indigenous people / "tribesmen" (scheduled tribes), to which only 1298 people (0.2 percent) belonged.
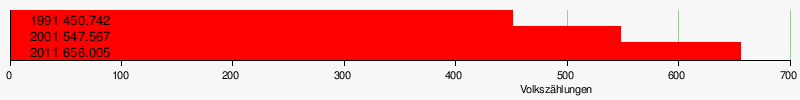
Population development
As everywhere in India, the population in the Botad district has been growing rapidly for decades. The increase in the years 2001–2011 was around 20 percent (19.8%). In those ten years the population increased by almost 110,000 people. The following table shows the exact numbers:
Significant places

The most populous place in the district is the district capital Botad with over 100,000 inhabitants. Other important cities are Gadhada, Barwala and Ranpur. With 209,542 people, the urban population makes up 31.94 percent of the total population.

District population by gender
In 2011, the district had more male than female residents, which is common in India. Of the 656,005 inhabitants, 337,234 (51.4 percent) were male and 318,771 female.
Population of the district by confession

A clear vast majority of the population are Hindus. The Muslims and Jainas are significant minorities. The following table shows the exact religious composition of the population:
| year | Buddhists | Christians | Hindus | Jainas | Muslims | Sikhs | Other | not specified | Total | |||||||||
|---|---|---|---|---|---|---|---|---|---|---|---|---|---|---|---|---|---|---|
| number | % | number | % | number | % | number | % | number | % | number | % | number | % | number | % | Residents | % | |
| 2011 | 66 | 0.01% | 461 | 0.07% | 612.159 | 93.32% | 5,835 | 0.89% | 37,066 | 5.65% | 152 | 0.02% | 15th | 0.00% | 251 | 0.04% | 656.005 | 100.00% |
| Source: 2011 Indian Census | ||||||||||||||||||
District population by language
Almost the entire population speaks Gujarati . Of the 656,005 inhabitants in the 2011 census, 653,748 people (99.66 percent) said Gujarati was the language. A small minority of 1,420 people (0.22 percent) speak Hindi . The speakers of Hindi are immigrants from other parts of India.
Literacy
The enrollment rate in the district has increased from decade to decade thanks to efforts by the administration. This is why the number of residents who are able to read has increased significantly in the past few decades. Yet there are huge differences. While illiteracy is an exception among men in urban areas, many rural women cannot read or write.
| Literacy in the Botad district | ||||||
| unit | 2011 census | |||||
| number | proportion of | |||||
| TOTAL | 412,386 | 73.16% | ||||
| Men | 238.184 | 82.54% | ||||
| Women | 174.202 | 63.32% | ||||
| Source: 2011 census result | ||||||
District Administration
Local administration
The district is divided into 4 talukas .
| Taluka | Population (2001) |
Population (2011) |
Population (%) (2011) |
Area (km²) | Surface (%) | Population density (2011) |
main place |
|---|---|---|---|---|---|---|---|
| Barwala | 67,301 | 75,986 | 11.58 | 486.40 | 18.97 | 156 | Barwala |
| Botad | 228.491 | 286,618 | 43.69 | 749.44 | 29.22 | 382 | Botad |
| Gadhada | 175,647 | 200,475 | 30.56 | 897.89 | 35.01 | 223 | Gadhada |
| Ranpur | 76.128 | 92,926 | 14.17 | 430.67 | 16.79 | 216 | Ranpur |
Web links
- Map of the Botad District
- Ahmedabad District Statistical Handbook
- Statistical Handbook of Bhavnagar District
Individual evidence
Coordinates: 22 ° 10 ′ N , 71 ° 40 ′ E

Ahmedabad | Amreli | Anand | Aravalli | Banaskantha | Bharuch | Bhavnagar | Botad | Chhota Udaipur | Dahod | Dang | Devbhoomi Dwarka | Gandhinagar | Gir Somnath | Jamnagar | Junagadh | Kachchh | Kheda | Mahisagar | Mehsana | Morbi | Narmada | Navsari | Panchmahal | Patan | Porbandar | Rajkot | Sabarkantha | Surat | Surendranagar | Tapi | Vadodara | Valsad