Population development of Mainz
This article shows the population development of the city of Mainz in tabular and graphical form. The development can also be traced using the article on the city's history .
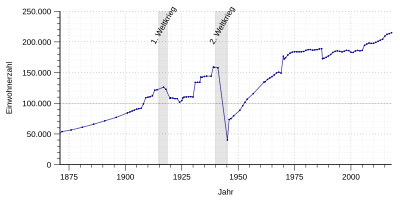
On December 31, 2019, the “ official number of inhabitants ” for Mainz was 218,578 according to an update by the Rhineland-Palatinate State Statistical Office (only main residences and after comparison with the other state offices ). This is the tenth year in a row that the population has reached a new all-time high. During this time (December 31, 2011) the city also exceeded the limit of 200,000 inhabitants.
Population development
In the 1st century, the total number of inhabitants was up to 50,000, depending on the stationing of Roman legions, whereby the number of civilians in Mogontiacum is likely to have been in the lower five-digit range. Only a few thousand people lived in the city between the 5th and 8th centuries. In the year 1300 Mainz had 24,000 inhabitants. The decline in the population in 1463 to 5,750 is mainly due to the effects of the plague and the unfavorable outcome of the Mainz collegiate feud for the city . In the centuries that followed, the population rose slowly due to epidemics, wars and famine.
From 1853, Mainz experienced a strong population growth due to the settlement of industry and the connection to the railway network . In 1852 only 37,000 people lived in the city, in 1900 there were already 84,000. In 1908 the population of the city of Mainz exceeded the limit of 100,000, which is why it is categorized as a large city .
In the first half of the 20th century, the city grew mainly through numerous incorporations (the number of inhabitants in brackets): on April 1, 1907 Mombach (6650), on April 1, 1908 Kastel with Amöneburg (9070), on January 1, 1913 Kostheim (7700), on January 1, 1930 Bretzenheim (6100), Weisenau (6600), Bischofsheim (5950), Ginsheim and Gustavsburg (4950) and on April 1, 1938 Gonsenheim (10,350).
The importance of Mainz as a garrison town in the First World War is evident from the results of the census of December 5, 1917. A total local population of 122,876 people was determined. According to the Economics Department of the War Food Office, 22,857 of these were military personnel and 868 prisoners of war. Their share in the total population was 19.3 percent. 79 temporarily absent military personnel are not included in the statistics.
Shortly before the start of the Second World War , in the census of May 17, 1939, 158,533 inhabitants were counted. The war initially spared the city. The first heavy bombing raids did not take place until 1942 . The worst attack occurred on February 27, 1945 when Mainz was almost completely destroyed by British bombers and 1,200 people were killed. A firestorm was sparked by incendiary bombs . At the end of the war, the city was 80 percent destroyed. When the American army took Mainz on March 22, 1945, 40,000 people were still living in the ruins. Overall, the city lost 75 percent of its residents.
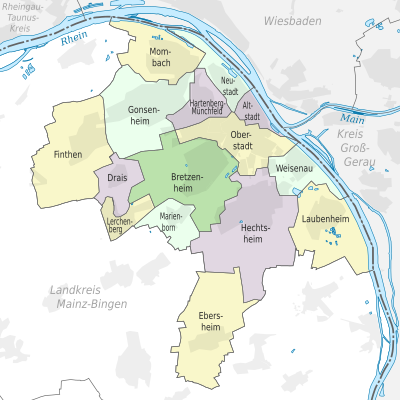
On August 10, 1945, the population fell due to the spin-off of the districts on the right bank of the Rhine from Mainz (1946 = 18,266 inhabitants; 2,261.99 hectares, 1950 = 21,407 inhabitants). With the return of the forced evacuees and the influx of refugees and displaced persons from the German eastern regions , the number of inhabitants rose again over the limit of 100,000 by 1952. It was only through the incorporation of numerous places ( Drais , Ebersheim , Finthen , Hechtsheim , Laubenheim , Marienborn ) on June 8, 1969, that the pre-war status was reached again. The population grew by about 23,000 people due to the incorporation.
According to official updates, the population rose to 189,290 by May 24, 1987. The decrease in the number of inhabitants by almost 17,000 to 172,529 in the census on May 25, 1987 results on the one hand from an incorrect update due to the long period since the last census in 1970 and on the other hand from the introduction of the term “population at the place of the main residence”. Since students often only have a second residence in the university town, the statistical offices do not count these as residents of the relevant location, in contrast to the definition of “ resident population ”.
The increase in the population by 8,000 to 194,000 in 2005 is due to the introduction of a second home tax . In 2018, the city with 217,118 inhabitants was 36th among the major German cities and in first place within Rhineland-Palatinate .
The following overview shows the number of inhabitants according to the respective territorial status . Up to 1815 these are mostly estimates, then census results (¹) or official updates by the city administration (until 1970) and the State Statistical Office (from 1971). From 1834 the information relates to the “customs clearance population”, from 1871 to the “local population”, from 1925 to the “resident population” and since 1987 to the “population at the place of the main residence”. Before 1834, the number of inhabitants was determined according to inconsistent survey methods.
From AD 50 to 1870
(respective territorial status)
|
|
|
¹ census result
From 1871 to 1944
(respective territorial status)
|
|
|
¹ census result
Source: City of Mainz
The results of the consumer group statistics , which were obtained from the food allocation data and published by the Federal Statistical Office in 1953, provide a more realistic assessment of the population development in World War II . According to the small consumer group statistics, the civilian population served in Mainz comprised 131,460 people at the beginning of February 1943 (including 4,727 group caterers), at the beginning of February 1944 130,576 (including 9,553 group caterers) and in mid-October 1944 129,159 people (including 11,286 group caterers).
From 1945 to 1989
(respective territorial status)
|
|
|
Sources: City of Mainz (until 1970), State Statistical Office Rhineland-Palatinate (from 1971)
¹ census result
Since 1990
(respective territorial status)
|
|
|
¹ After the introduction of a second home tax
Source: State Statistical Office Rhineland-Palatinate
Population structure
The population figures refer to the city of Mainz as the main residence.
| population | As of June 30, 2018 |
|---|---|
| Residents | 216.055 |
| of which female | 110,854 |
| German | 142,647 |
| of which female | 74,751 |
| Germans with a migration background | 33.193 |
| of which female | 16,825 |
| Foreigners | 40,215 |
| of which female | 19,278 |
| Proportion of foreigners in percent | 18.6 |
Source: population register of the state capital Mainz; Office for Urban Development, Statistics and Elections; Statistical office
age structure
The following overview shows the age structure as of December 31, 2011 (main residences).
| Age | population | Percentage |
|---|---|---|
| under 2 | 3,617 | 1.8 |
| 2-5 | 6,832 | 3.4 |
| 6-9 | 6.230 | 3.1 |
| 10-15 | 9,445 | 4.7 |
| 16-19 | 7,033 | 3.5 |
| 20-34 | 53,455 | 26.6 |
| 35-49 | 43,809 | 21.8 |
| 50-64 | 35,368 | 17.6 |
| 65-79 | 25,522 | 12.7 |
| over 80 | 9,646 | 4.8 |
| total | 200,957 | 100.0 |
Source: State Statistical Office Rhineland-Palatinate
Districts
The population figures refer to the city of Mainz as the main residence as of December 31, 2014.
| No. |
District |
Area (km²) |
Residents |
Inhabitants per km² |
Foreigners |
Foreigners (%) |
|---|---|---|---|---|---|---|
| 15th | Old town | 2.4 | 17,282 | 7,201 | 3,016 | 17.4 |
| 16 | Neustadt | 3.7 | 27,452 | 7,419 | 5,992 | 21.8 |
| 24 | Upper Town | 5.9 | 21,123 | 3,580 | 3,067 | 14.5 |
| 25th | Hartenberg-Münchfeld | 3.5 | 16,889 | 4,825 | 3,067 | 18.2 |
| 31 | Mombach | 6.3 | 13,462 | 2.137 | 3,182 | 23.6 |
| 41 | Gonsenheim | 10.6 | 23,875 | 2,252 | 2,982 | 12.5 |
| 42 | Finthen | 11.1 | 14,344 | 1,292 | 1,825 | 12.7 |
| 51 | Bretzenheim | 10.7 | 19,636 | 1,835 | 2,489 | 12.7 |
| 52 | Marienborn | 3.0 | 4,293 | 1,431 | 766 | 17.8 |
| 53 | Lerchenberg | 2.4 | 6,287 | 2,620 | 977 | 15.5 |
| 54 | Drais | 3.1 | 3,108 | 1.003 | 151 | 4.9 |
| 61 | Hechtsheim | 15.1 | 15,179 | 1.005 | 1,785 | 11.8 |
| 62 | Ebersheim | 9.8 | 5,650 | 576 | 567 | 10.0 |
| 71 | Weisenau | 3.9 | 11,835 | 3,034 | 2,366 | 20.0 |
| 72 | Laubenheim | 8.8 | 8,987 | 1,021 | 847 | 9.4 |
| State capital Mainz | 97.8 | 209.402 | 2.141 | 33,923 | 16.2 |
See also
literature
- Franz Dumont, Ferdinand Scherf, Friedrich Schütz (eds.): Mainz - The history of the city , 2nd edition, Verlag Philipp von Zabern, Mainz, 1999
- Imperial Statistical Office (Ed.): Statistical Yearbook for the German Empire , 1880–1918
- Statistisches Reichsamt (Ed.): Statistical yearbook for the German Reich , 1919–1941 / 42
- German Association of Cities (Ed.): Statistical Yearbook of German Communities , 1890 ff.
- Federal Statistical Office (Ed.): Statistical Yearbook for the Federal Republic of Germany , 1952 ff.
- Bertelsmann Stiftung (Ed.): Guide to Demographic Change 2020. Analyzes and action plans for cities and municipalities. Bertelsmann Stiftung Publishing House, Gütersloh 2006, ISBN 3-89204-875-4
Individual evidence
- ↑ State Statistical Office of Rhineland-Palatinate - population status 2019, districts, communities, association communities ( help on this ).
- ^ Karl-Viktor Decker , Wolfgang Selzer : Mainz from the time of Augustus to the end of Roman rule. In: Hildegard Temporini , Wolfgang Haase (Hrsg.): Rise and decline of the Roman world : History and culture of Rome in the mirror of recent research . Volume II.5.1, Walter de Gruyter, Berlin 1976, ISBN 3-11006-690-4 , p. 504
- ↑ a b Ceremony 50 years of incorporation. Speech by Mayor Michael Ebling . State capital Mainz, June 8, 2019, accessed on June 10, 2020 .
- ↑ Federal Statistical Office (Ed.): Statistical Reports, Work No. VIII / 19/1, The civilian population of the German Empire 1940–1945. Results of the consumer group statistics. Wiesbaden 1953, p. 37
- ↑ Population register of the state capital Mainz; Office for Urban Development, Statistics and Elections; Statistics office: statistical information on urban development. August 9, 2018, accessed January 10, 2019 .
- ^ City of Mainz: residents of the state capital Mainz according to the population register on December 31, 2014 (created on February 10, 2015) ( Memento from February 17, 2015 in the Internet Archive ) (PDF), population register; Office for Urban Development, Statistics and Elections
Web links
- Residents of the state capital Mainz according to the register of residents on December 31, 2014 ( memento from February 17, 2015 in the Internet Archive )
- State Statistical Office Rhineland-Palatinate: Population and area
- City of Mainz: Office for Urban Development, Statistics and Elections
- Bertelsmann Foundation: Guide to Demographic Change


