
Feynman diagram

Feynman diagrams are standard pictorial representations of quantum field theoretical interactions used in particle and solid state physics , which were developed in 1949 by Richard Feynman using the example of quantum electrodynamics . The diagrams are strictly translatable into mathematical terms.
Importance and application
Feynman diagrams are an abstract, graphical representation of the interactions of particles , which are mathematically described by Lagrange densities . For example, the interaction between electrons and photons is described by the following Lagrange density:


Here is the Dirac spinor corresponding to the electron (or positron), the complex-conjugated field, the electrical charge , the mass of the electron, the Dirac matrices and the electromagnetic four-potential corresponding to the photon . The derivative describes the propagation of the electron in space-time , while the expression couples the electrical charge of the electron with the photon. The indices and represent the four dimensions of the Minkowski space ( for the coordinates ). Einstein's sum convention applies , and the units are chosen in such a way that applies.


Such expressions are generally very complicated, but can be clearly translated into corresponding Feynman diagrams, which provide a simplified and clear representation. Feynman diagrams, however, do not allow a simple calculation of the mathematical expressions. For this purpose, the mathematical formulas must be used.
Feynman diagrams are usually used to calculate scattering processes in relativistic quantum field theories, e.g. B. in quantum electrodynamics or quantum chromodynamics to organize. For this purpose, the total amplitude of a scattering process can be broken down as the sum of all valid Feynman diagrams in a power series developed according to the coupling constant . The individual contributing amplitudes can then be calculated.
In addition, Feynman diagrams are used in non-relativistic solid-state physics, especially in many -body physics and statistical physics .
construction
Feynman diagrams are made up of basic symbols, each of which depicts certain types of elementary particles . Fermions (particles of matter) are represented according to the usual convention by means of solid lines with arrows. The antiparticle is often referred to as a particle moving against time. The direction of the arrow therefore indicates whether it is a particle (in the direction of time) or an antiparticle (against the direction of time). There are different conventions for labeling the lines of the particles and antiparticles. Usually the exact symbol of the particle is written. However, some authors use a shorter and more general notation that can designate both the particle and the antiparticle (e.g. instead of and ), since the information as to whether it is a particle or an antiparticle is already in the direction of the arrow . The direction of the time axis is sometimes chosen from bottom to top, sometimes from left to right.


The calibration bosons , which mediate the interaction of particles, are usually represented by wavy or spiral lines, depending on the interaction, scalar particles are typically represented by dashed lines. There are deviations from these conventions, for example W bosons can be symbolized as dashed lines.
The time is shown below from left to right.
| symbol | meaning |
|---|---|
|
|
Fermion |
|
|
Antifermion |
|
|
Gauge bosons of the electroweak interaction |
|
|
Gluon g (gauge boson of the strong interaction) |
|
|
Higgs boson (or generally scalar bosons, more rarely also for vector bosons) |
|
|
Terminator (e.g. interaction of the Higgs boson with a condensate ) |
In addition, labels can be used to define which elementary particle is meant.
|
|


Feynman diagrams have outer lines that run into or out of interaction points and inner lines that connect pairs of interaction points. Incoming and outgoing particles correspond to the outer lines. The points of interaction where the lines meet are also called vertices . Particles can be created, destroyed or scattered at a vertex.
While keeping the time fixed (from left to right), the rotation around a vertex leads to different interpretations:
- Confluence and splitting processes

Annihilation of an electron and a positron to a photon
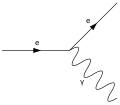
Emission of a photon by an electron

Absorption of a photon by a positron

Pair formation of an electron and a positron by a photon


It should be noted here that a Feynman diagram only consists of vertices connected by particles.
Propagators
The inner lines are called propagators and interpret them as virtual particles . Virtual particles cannot be observed. Because of this, there is an ambiguity. All diagrams with the same incoming and outgoing lines are equivalent and are summed.
Examples
Bhabha dispersion
To calculate the scattering of a fermion and antifermion - the Bhabha scattering - one looks at Feynman diagrams with an incoming and an outgoing electron-positron pair.
The images show the scatter in the lowest order ( tree-level ). The four outer lines stand for the incoming and outgoing electrons and positrons , the inner wavy line for the virtual photon that causes the electromagnetic interaction .

A fermion and antifermion (e.g. electron and positron) with a mediating virtual gauge boson (e.g. photon)

An equivalent diagram of the Bhabha dispersion with a different propagator.


Each of these diagrams corresponds to a contribution to the spread, the entire spreading process is represented by the sum of all the diagrams.
Compton effect
As a further example, the Compton effect in the lowest order is listed here. The possible diagrams are also added up here.
| Compton effect = |
|
+ |
|


The calculation of this scatter and, more generally, the Feynman rules for the mathematical expressions that correspond to the lines and vertices, can be found in many textbooks on particle physics (see web links ).
grind
In addition to the tree-level diagrams, named after their tree-like structure, the so-called higher-order loop diagrams are also important for an exact calculation .

no loop
( tree-level )
one loop
( 1-loop )
two loops
( 2-loop )
two loops
( 2-loop )


The possible Feynman diagrams can be ordered according to the number of inner loops, which is called the loop order , and added up in the course of a series expansion :
- .

Any number of diagrams are possible. However, higher-order contributions with the corresponding power of the coupling constants are suppressed. With a sufficiently high order, the contributions then become numerically negligible according to the working hypothesis of perturbation theory , since they have hardly any effect on the result.

Feynman rules
The Feynman rules describe which interactions are possible and which are not.
Photons
Photons interact with all electrically charged elementary particles. Illustrations for electrons and muons:

Interaction between electron, positron and photon

Interaction between muons and photons

Z bosons
The Z boson interacts between all other elementary particles of the Standard Model except gluons, with photons, however, only at the same time as W bosons. In particular, neutrinos ( , and ) do not interact with photons; therefore one has to rely on Z bosons and W bosons for their generation and detection.


Interaction between Z boson and neutrinos
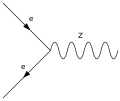
Interaction between electron, positron and Z boson

Interaction between muon, anti-muon and Z boson


W bosons
The W boson mediates on the one hand between neutrinos and the charged leptons l (electrons, muons and tauons) and on the other hand between up-type quarks and down-type quarks. The W boson is the carrier of a positive (W + ) or negative (W - ) electrical charge. Due to the electrical charge, the W boson is subject to interaction with the photon; it also interacts with the Z boson and other W bosons.

Interaction between negatively charged lepton, neutrino and W boson

Interaction between neutrino, positively charged lepton and W boson

Interaction between two differently charged W bosons. Timeline runs from top to bottom

Interaction between two differently charged W bosons and two photons. Timeline runs from top to bottom

Interaction between two differently charged W bosons and two Z bosons. Timeline runs from top to bottom

Interaction between two differently charged W bosons, a Z boson and a photon. Timeline runs from top to bottom


W bosons are particularly interesting because they allow a change in flavor . This means that the number of electrons, neutrinos, etc. can change. This property plays an important role in β decay , for example .


Gluons

Gluons mediate the strong interaction between quarks .
Quarks have a color charge . In contrast to the electrical charge, which can be "positive" (+) or "negative" (-), the possible color charges are "red", "green" and "blue" and as an anti-color charge "anti-red" ("cyan") ), "Anti-Green" ("Magenta") and "Anti-Blue" ("Yellow"). To neutralize the color charge, quarks with the color charges {red, green, blue}, {cyan, magenta, yellow}, {red, cyan}, {green, magenta} or {blue, yellow} have to be connected via gluons.
Gluons each carry a color charge and an anti-color charge. As a result, they themselves are subject to the strong interaction and can thus connect with each other. Theoretically, gluon balls can also be generated in this way, which only consist of gluons and “get by” without quarks. However, they could not be detected so far (2019).
Higgs bosons
The Higgs boson interacts with all massive elementary particles, including itself (self - interaction). Only with photons and gluons there is no interaction. According to the standard model of particle physics, elementary particles only acquire their mass through this interaction (see Higgs mechanism ).
Types of Feynman diagrams
- Related charts
- If every vertex is connected to every other vertex via inner lines and other vertices, then the diagram is referred to as connected, otherwise as disconnected. For every connected part of the diagram, the sum of the energies, impulses and charges of the incoming particles is equal to the sum of the energies, impulses and charges of the outgoing particles.
- One-particle irreducible diagrams
- If a connected diagram cannot be divided into two disconnected diagrams by cutting an inner line, it is called one-particle irreducible. In such diagrams, integrations occur that cannot be systematically simplified as the product of simpler integrals.
- Amputee diagrams
- If you omit corrections ( self-energies , see below) to the outer lines in a diagram , it is called amputated.
- Self energy diagrams
- A diagram with a loop and outer lines on only two vertices is called (after amputation) a self-energy diagram. Its value depends only on the energy and momentum flowing in through external lines at one vertex and out the other.
- Skeleton diagrams
- A diagram without a self-energizing subdiagram is called a skeleton diagram.
Solid state analogy
The usual transfer to solid-state physics is obtained by going from the curved photon line , i.e. from the quanta of electromagnetic waves, to the so-called phonons , i.e. to the quanta of sound waves, and by not using the backward-moving electron as a positron in the Meaning of quantum electrodynamics, but interpreted as a defect electron in the sense of solid-state theory. In this way you get u. a. the essential diagrams for the creation of superconductivity and in general for confluence and splitting processes through the destruction or generation of an elementary fermionic excitation (e.g. a (negatively charged) electron or a (positively charged) defect electron or a polaron ) together with an incoming (or outgoing) bosonic quasiparticle , e.g. B. the already mentioned phonon or a so-called magnon (quantized spin waves ) or a plasmon (a quantized plasma oscillation ).
In all interaction processes involving the mentioned stimuli, the sum of the energies (frequencies times ) or the pulses (wave numbers times ) is retained, so that the diagrams shown correspond to well-defined mathematical expressions for the amplitudes of the interaction

Implementation in art

The Feynman graphs have also found their way into contemporary art . In 2000, the German glass artist Karl-Martin Hartmann created a choir window for the St. Nicolai Church in Kalkar , which he designed from a grid of Feynman graphs. Physical knowledge and the beauty of the natural sciences should enter into a dialogue with the teachings and messages of religion in this sacred context.
literature
- Otto Nachtmann: Phenomena and concepts of elementary particle physics. Vieweg, Braunschweig 1986, ISBN 3-528-08926-1 .
Web links
- Using Feynman diagrams to illustrate particle interactions in the Standard Model. CERN , accessed February 27, 2013 .
- Martin Bäker: How do Feynman diagrams work? In: ScienceBlogs . Retrieved February 27, 2013 (Simple explanation of the calculation of Feynman diagrams).
- Plip Tanedo: Let's draw Feynman diagrams! In: Quantum Diaries . USLHC , Cornell University , accessed February 27, 2013 .
- Carl Brannen: Feynman Diagrams for the Masses (part 1). Retrieved February 27, 2013 .
- Carl Brannen: Feynman Diagrams for the Masses (part 2). Retrieved February 27, 2013 .
Individual evidence
- ^ RP Feynman: Space-Time Approach to Quantum Electrodynamics. Phys. Rev. 76, p. 769 (pdf; 4.8 MB)
- ↑ Abrikosov, Gor'kov, Dzyaloshinskii: Quantum field theory methods in statistical physics. Dover, 1961 and 1977, ISBN 0-486-63228-8 .
- ^ Demystifying the Higgs Boson with Leonard Susskind. In: YouTube . Stanford University , August 16, 2012, accessed February 27, 2013 .
- ↑ www.pro-physik.de/details/articlePdf/1106933/issue.html Sacral Physics: Interview with the artist in Physik Journal 3 (2004) No. 12, accessed on January 14, 2019