
Regression analysis
The regression analysis is a set of tools of statistical analysis methods that have the aim of relationships between a dependent (sometimes referred to as explained variable, or Regressand) and (sometimes referred to as explanatory variables, or regressors) one or more independent variables to model. The implementation of a regression is used to describe relationships quantitatively or to predict values of the dependent variables. The most common form of regression analysis is linear regression , in which the user uses a straight line (or a more complex linear function) that best matches the data according to a certain mathematical criterion. For example, the common least squares method computes a unique line (or hyperplane) that minimizes the sum of the squares of deviations between the true data and that line (or hyperplane ), that is , the sum of squares of residuals . For certain mathematical reasons, the user can estimate the conditional expected value of the dependent variable when the independent variables assume a certain set of values. Less common forms of regression use slightly different methods to estimate alternative onesLocation parameters (e.g. the quantile regression ) or for estimating the conditional expected value for a broader class of nonlinear models (e.g. nonparametric regression ).
Regression analysis is mainly used for two conceptually different purposes. First, regression analysis is often used for estimates and predictions where its use overlaps significantly with the realm of machine learning , see also symbolic regression . Second, in some situations, regression analysis can be used to infer causal relationships between the independent and dependent variables. It is important that regressions, taken by themselves, only show relationships between one dependent variable and one or more independent variables in a given data set . In order to use regressions for predictions or to infer causal relationships, the user must carefully justify why existing relationships have predictive power for a new context or why a relationship between two variables has a causal relationship interpretation ( correlation and causal relationship ). The latter is particularly important if users want to estimate causal relationships with the help of observational data.
history


The earliest form of regression was the median regression , which was proposed around 1760 by Rugjer Josip Bošković (1711–1787). The least squares method ( French méthode des moindres carrés ) was later published by Legendre in 1805 and by Gauss in 1809 . Both used the method to determine the orbits of the planets around the sun based on astronomical observations. Gauss published a further development of the least squares theory in 1821 which contained a theoretical justification for his least squares method. This is known today as the Gauss-Markow theorem.
The term regression was coined in the 19th century by Francis Galton , a cousin of Charles Darwin . He was describing a biological phenomenon known as center regression , according to which descendants of great parents tend to only grow to average. For Galton, regression had only this biological meaning. However, his work was later placed in a more general statistical context by Udny Yule and Karl Pearson . In their work it was assumed that the joint distribution of the independent and dependent variables is normally distributed . This assumption was later weakened by RA Fisher . This worked on the assumption that the conditional distribution of the dependent variable is normally distributed, but the joint distribution is not necessarily. In this regard, Fisher's approach was more similar to Gauss' formulation in 1821.
Regression methods are still an active area of research. In the last few decades, estimation methods have been developed in a wide variety of areas, for example for robust regression , for nonparametric regression, in the field of Bayesian statistics , for missing data and for error-prone independent variables.
Applications
Regression methods have many practical uses. Most applications fall into the following categories:
- Prediction : Estimates of the individual regression parameters are less important for the prediction than the overall influence of the variables on the target variable . Nevertheless, good estimators should have high predictive power.
- Data Description and Explanation : The statistician uses the Estimated Model to summarize and describe the observed data.
- Parameter estimation : The values of the estimated parameters could have theoretical implications for the assumed model.
- Variable selection : The aim is to find out how important each individual predictor variable is in modeling the target variable . The predictor variables that are believed to play an important role in explaining the variation in are retained and those that do little to explain the variation in (or contain redundant information about ) are omitted.
- Check for the output variable : A cause-effect relationship (ie a causal relationship) is assumed between the target variable and the predictor variables. The estimated model can then be used to control for the output variable of a process by varying the input variables. By systematically experimenting it may be possible to achieve the optimum output.


Regression analysis scheme
Data preparation
At the beginning of every statistical procedure there is the preparation of the data, in particular
- the plausibility check . It is checked whether the data is traceable. This can be done manually or automatically using validity rules.
- the handling of missing data. Incomplete data records are often left out, and the missing data is also filled in using certain procedures .
- the transformation of the data. This can happen for various reasons. It can, for example, lead to a better interpretability or visualization of the data. It can also be used to bring the data into a form in which the assumptions of the regression method are fulfilled. In the case of linear regression , a linear relationship between the independent and the dependent variable and homoscedasticity are assumed. There are mathematical tools for finding a suitable transformation, in the example of the linearization of the relationship, for example the Box-Cox transformation .
- the consideration of interactions (with linear regression). In addition to the influence of the independent variables, the influence of several variables is also taken into account at the same time.
Model adaptation
In practice, the user first selects a model that he wants to estimate and then uses the chosen estimation method (e.g. ordinary least squares estimation ) to estimate the parameters of this model. Regression models generally include the following components:
- The unknown parameters to be estimated , they represent scalars represents
- The independent variables (including regressors) for which data are available and are often summarized in a vector (here represents a data series)
- The dependent variable (also known as the regressand) for which data is available and which is often indicated using the scalar
- The unobservable disturbances (statistical noise) that can not be observed directly in and are often specified as.


Different terminologies are used instead of dependent and independent variables in different areas of application of statistics (see influencing variable and target variable ).
In the vast majority of regression models there is a function of and , whereby this relationship is superimposed by an additive disturbance variable that can stand for non-modeled or unknown determinants of :


- .

The goal of the user is to estimate the function that best fits the available data. In order to perform a regression analysis, the functional form of the function must be specified. Sometimes the specification of the form of this function is based on non-data-based empirical knowledge about the relationship between and ( for example, linear regression only considers linear functions , logistic regression only considers logistic functions). If there is no such knowledge, a more flexible or general form can be chosen for. For example, a simple linear regression can be applied, suggesting that the researcher believes that might be a reasonable approximation of the true data-generating process.


Once the user has determined his preferred statistical model, various forms of regression analysis provide tools for estimating the parameter . For example, the least squares estimate (including its most common variant, the common least squares estimate) finds the value of that minimizes the residual squares sum. A given regression method ultimately yields an estimate of , usually referred to as , to distinguish the estimate from the true (unknown) parametric value that generated the data. With this estimate, the user can then use the adjusted value or predicted value ( English fitted value ) to predict or assess how precisely the model can explain the data. Whether the user is fundamentally interested in the estimate or the predicted value depends on the context and the goals of the user. Ordinary least squares estimation is often used because the estimated function is an estimate of the conditional expected value . Alternative variants (e.g. so-called robust estimation methods , which minimize the amount of the deviations, method of the smallest absolute deviations or the quantile regression ). However, they are useful when users want to use other functions e.g. B. want to model nonlinear models.


It is important to note that there must be enough data to estimate a regression model. Suppose a user has access to data lines with one dependent and two independent variables: . Let us also assume that the user wants to estimate a simple linear model using least squares estimation. The model to be estimated is then . If the user only has access to data points, he can find an infinite number of combinations that explain the data equally well: any combination can be selected that satisfies all of them and is therefore a valid solution that is the one that does the Sum of residual squares ( residual squares sum ) minimized. In order to understand why there are infinitely many possibilities, it should be noted that the system of equations has to be solved for 3 unknowns, which underdetermines the system. Alternatively, you can visualize an infinite number of three-dimensional planes that run through fixed points.


A more general approach is to estimate a least squares model with different parameters. Different data points must be available for this. If is, there is generally no set of parameters that perfectly match the data. The size often appears in regression analysis and is referred to in the model as the number of degrees of freedom . In addition, to estimate a least squares model, the independent variables must be linearly independent , that is, one does not have to be able to reconstruct any of the independent variables by adding and multiplying the remaining independent variables. This condition ensures that the sum-of-products matrix is an invertible matrix and therefore a solution exists.


Model validation
An important step in regression analysis is model validation. This checks whether the model is a good description of the relationship. Model validation includes the
- Residual analysis . Many regression methods make assumptions about the residuals of the model. So z. B. assumed a certain distribution, constant variance or lack of autocorrelation . Since the residuals are the result of the procedure, the assumptions can only be checked afterwards. A typical tool for checking the distribution is the quantile-quantile diagram .
- Overfitting . This phenomenon occurs when too many independent variables are included in the model. One method of testing for overfitting is the cross-validation method .
- Examine the data for outliers and influential data points . This checks which data sets do not match the determined function (outliers) and which data have a strong influence on the determined function. A separate examination is recommended for these data sets. Mathematical tools for finding outliers and influential points are Cook and Mahalanobis distances .
- Multicollinearity between the independent variables (for linear models ). If there is a linear relationship between the independent variables, this can on the one handimpairthe numerical stability of the method and on the other hand make the interpretation of the model or the adapted function more difficult. The variance inflation factor and the correlation matrix areaids for quantifying the collinearity .

forecast
The validated model can be used to predict values of for given values of . In addition to the predicted value of , a prediction interval is often specified in order to estimate the uncertainty of the prediction.
In the case of predictions in the range of values of the data used for model adaptation, one speaks of interpolation . Predictions outside of this data range are called extrapolation . Before performing any extrapolation, one should carefully study the assumptions involved.
Variable selection and model comparison
If the aim of the analysis is to determine those independent variables that are particularly strongly related to the dependent variable , several models are often created, each with different independent variables, and these models are compared. In order to compare two models with each other, key figures such as the coefficient of determination or information criteria are used.
There are automated methods such as so-called step -by- step regression that successively try to determine the model that best explains the relationship sought. However, the use of such methods is controversial.
Furthermore, there are procedures in Bayesian statistics that derive a new model from several models (by so-called averaging ) and thus try to reduce the uncertainty resulting from the choice of model.
Some regression methods
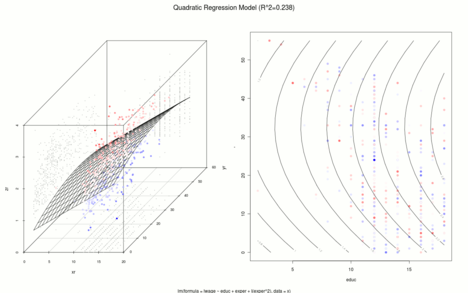
The following example is used to illustrate the various procedures. Analogous to Mincer (1974), 534 observations were randomly drawn from the 1985 Current Population Survey with the following variables:
- : natural logarithm of hourly wages,
- : Vocational training in years and
- : Work experience in years (= age - vocational training - 6)


Mincer used the Mincer income equation named after him to investigate the relationship between the logarithm of hourly wages (dependent variable) and professional training and experience (independent variables). In the following graphics there is a spatial representation of the regression area on the left and a contour plot on the right. Positive residuals are reddish, negative residuals are bluish and the lighter the observation, the smaller the absolute amount of the residual.
- Linear regressions

.
.


Basic procedures
Linear regression
In linear regression, the model is specified in such a way that the dependent variable is a linear combination of the parameters (= regression parameters ) , but not necessarily the independent variables . For example, simple linear regression models the dependency with an independent variable :

- .

In the multiple linear regression multiple independent variables or functions to be considered the independent variable. For example, if the term is added to the previous regression, the result is:

- .

Although the expression on the right is quadratic in the independent variable , the expression is linear in the parameters , and . So this is also a linear regression equation.


To determine the model parameters is the least squares method used.
Nonparametric regression
In the case of nonparametric regression methods, the form of the functional relationship f is not specified, but is largely derived from the data. When estimating the unknown regression function at the point , the data near this point are given greater weight than data points that are far away from it.


Various regression methods have been established for estimation:

- The regression function is calculated as the weighted sum of the nearby observation values. The weights are determined using kernel density estimation and then a
- locally constant linear regression (Nadaraya-Watson estimator),
- locally linear regression (locally linear estimator) or
- local polynomial regression (local polynomial estimator)
- carried out.
- Multivariate Adaptive Regression Splines
- With the multivariate adaptive regression splines (MARS) method, the dependent variable is represented as a linear combination of so-called hockey stick functions (or products of hockey stick functions).
Semiparametric regression
A disadvantage of nonparametric regressions is that they suffer from the curse of dimensionality . I.e. the more explanatory variables there are, the more observations are necessary to reliably estimate the unknown regression function at any point . Therefore, a number of semi-parametric models have been established that extend or use linear regression:

- Here the unknown regression function is shown as the sum of non-parametric linear single regressions of the variables:
- In the partially linear model , some of the variables are linear, especially binary variables.


- Additive models


- Index models
Here the unknown regression function is also represented as the sum of non-parametric linear single regressions of indices:
- In this case one speaks of the single index model , for there is the projection pursuit regression .


- Index models


Robust regression
Regression methods based on least squares estimation or maximum likelihood estimation are not robust against outliers . Robust regression methods were developed in order to circumvent this weakness of the classical method. For example, M-estimators can be used as an alternative .
Generalized Procedures
Generalized linear models
With the classical linear regression it is assumed that the disturbance variables are normally distributed. The model assumption is weakened in the generalized models, where the disturbance variables can have a distribution from the distribution class of the exponential family . This is made possible by using
- a known coupling function , depending on the distribution class of the disturbance variables, and
- the maximum likelihood method (method of greatest plausibility) to determine the model parameters:

A special case of the generalized linear models is logistic regression . If the response variable is a categorical variable that can only have two or a finite number of values, logistic regression is often used.

- Binary logistic regression:

with (depending on the distribution class of the disturbance variables). An alternative would be the probit model .

Generalized semi-parametric models
This idea has also been adopted for the semi-parametric models:
- Generalized additive models ( English generalized additive models , in short: GAM )
- .

The so-called generalized additive models for position, scale and shape parameters represent a special type of generalized additive models .
- Generalized partially linear models (English generalized partial linear models , in short GPLM )
- .

- Generalized additive partial linear models (English generalized additive partial linear models , GAPLM for short )
- .

Special procedures
Autoregressive models
If the data points are ordered (e.g. if the data is a time series ) then it is possible, for example, in autoregressive models and autoregressive conditionally heteroscedastic models to use previous data as "independent" variables.
See also
literature
- Norman R. Draper, Harry Smith: Applied Regression Analysis. Wiley, New York 1998.
- Ludwig Fahrmeir , Thomas Kneib , Stefan Lang: Regression: Models, Methods and Applications. Springer Verlag, Berlin / Heidelberg / New York 2007, ISBN 978-3-540-33932-8 .
- Dieter Urban, Jochen Mayerl: Regression analysis: theory, technology and application. 2., revised. Edition. VS Verlag, Wiesbaden 2006, ISBN 3-531-33739-4 .
- M.-W. Stoetzer: Regression Analysis in Empirical Economic and Social Research - A Non-Mathematical Introduction with SPSS and Stata. Berlin 2017, ISBN 978-3-662-53823-4 .
Web links

- Literature on regression analysis in the catalog of the German National Library
Individual evidence
- ↑ Klaus Backhaus: Multivariate Analysis Methods an application-oriented introduction . Ed .: SpringerLink. Springer, Berlin 2006, ISBN 3-540-29932-7 .
- ^ Ludwig Fahrmeir , Thomas Kneib , Stefan Lang, Brian Marx: Regression: models, methods and applications. Springer Science & Business Media, 2013, ISBN 978-3-642-34332-2 , p. 105.
- ↑ AM Legendre : Nouvelles méthodes pour la détermination des orbites des comètes. 1805. “Sur la Méthode des moindres quarrés” appears as an appendix.
- ↑ CF Gauß : Theoria Motus Corporum Coelestium in Sectionibus Conicis Solem Ambientum . 1809.
- ↑ CF Gauß: Theoria combinationis observationum erroribus minimis obnoxiae. 1821/1823.
- ↑ Robert G. Mogull: Second-semester Applied Statistics . Kendall / Hunt Publishing Company, 2004, ISBN 0-7575-1181-3 , pp. 59 .
- ^ Francis Galton: Kinship and Correlation (reprinted 1989) . In: Statistical Science . tape 4 , no. 2 , 1989, JSTOR : 2245330 .
- ^ Francis Galton : Typical laws of heredity. In: Nature. 15, 1877, pp. 492-495, 512-514, 532-533. (Galton uses the term "reversion" in this paper, which discusses the size of peas.)
- ^ Francis Galton. Presidential address, Section H, Anthropology. (1885) (Galton uses the term "regression" in this article, which studies human height.).
- ↑ G. Udny Yule: On the Theory of Correlation . In: J. Royal Statist. Soc. 1897, p. 812-54 , JSTOR : 2979746 .
- ^ Karl Pearson, GU Yule, Norman Blanchard, Alice Lee: The Law of Ancestral Heredity . In: Biometrika . 1903, JSTOR : 2331683 .
- ^ RA Fisher: The goodness of fit of regression formulas, and the distribution of regression coefficients . In: J. Royal Statist. Soc. tape 85 , 1922, pp. 597-612 .
- ↑ Ronald A. Fisher : Statistical Methods for Research Workers . 12th edition. Oliver and Boyd , Edinburgh 1954 ( yorku.ca ).
- ^ John Aldrich: Fisher and Regression . In: Statistical Science . tape 20 , no. 4 , 2005, p. 401-417 , JSTOR : 20061201 .
- ^ Rencher, Alvin C., and G. Bruce Schaalje: Linear models in statistics. , John Wiley & Sons, 2008., p. 2.
- ^ CL Chiang: Statistical methods of analysis. World Scientific, 2003, ISBN 981-238-310-7 - page 274 section 9.7.4 "interpolation vs extrapolation" .
- ^ Jacob A. Mincer: Schooling, Experience, and Earnings . National Bureau of Economic Research, 1974, ISBN 978-0-87014-265-9 ( nber.org [accessed July 3, 2011]).