
Irbid Governorate
| Irbid Governorate | |
|---|---|
  |
|
| Basic data | |
| Country | Jordan |
| Capital | Irbid |
| surface | 1572 km² |
| Residents | 1,770,158 (2015) |
| density | 1126 inhabitants per km² |
| ISO 3166-2 | JO-IR |
Coordinates: 32 ° 2 ′ N , 35 ° 44 ′ E
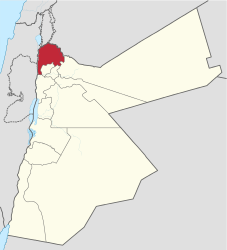
The Irbid Governorate ( Arabic محافظة إربد, DMG Muḥāfaẓat Irbid ) is a governorate in northwestern Jordan . The state capital Amman is located around 80 kilometers southeast of the provincial capital . Approximately 1,867,000 people live in the area (as of 2017). Of these, 964,700 were male and 902,300 were female. The Irbid Governorate is bordered to the southeast and south by the governorates of al-Mafraq , Adschlun , Jarash and al-Balqa . To the west is the border with Israel / West Bank . The Irbid Governorate borders the Golan Heights in the northwest and Syria in the north and northeast . The capital of the governorate is Irbid .
geography
The basins of Jarmuk and Jordan as well as the mountainous region of Hauran cover large parts of the Irbid governorate.
history
The region was settled early on. The rulers often changed. Egyptians, Edomites and Ammonites, Persians, Greeks, Romans, Arabs, Crusaders, Mamelukes, Ottomans and British ruled the country. Islamization and Arabization from the 7th century onwards are the most powerful changes. Because before the Islamic conquest, the majority of the population consisted of Syriac or Greek-speaking Christians with minorities of other creeds.
population
At the 2015 census, Irbid Governorate had 1,770,158 inhabitants. 1,316,618 of these were Jordanian citizens (74.38%) and 453,540 people with other nationalities. Of the immigrants, 343,479 were Syrian, 55,004 Egyptian, 33,396 Palestinian, 3199 Omani, 2904 Saudi Arabian, 1960 Iraqi and 1822 Yemeni nationals. Of the population, 914,634 were male and 855,524 female. The governorate is heavily urbanized. Only 135,387 people (7.65%) live in rural areas.
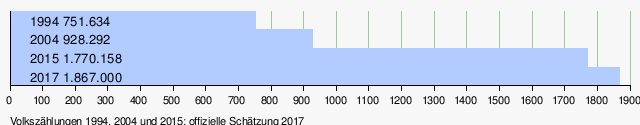
Population development
The district's population is growing rapidly. In the period from 2004 to 2015 (the last two census years), the increase was 841,866 people. This is a growth of 90.7%.
Significant places
Important places are Irbid , Ramtha and Aidun (Dion). Of the 1,770,158 residents, 1,634,771 (92.35%) lived in urban areas.

economy
The population works mainly in agriculture. Mainly citrus fruits, olives, wheat and honey are harvested. The most important fruits are olives, which make up more than 91% of the fruit harvest. Followed by grapes, pomegranates, peaches, plums, apples and bananas. Wheat, barley, broad beans and chickpeas dominate the field crops. Vegetables are dominated by tomatoes, peppers, cucumbers, pumpkins and potatoes.
There are also the three industrial areas Cyber City, Jordan River Crossing City and Prince Hasan Industrial City . In these areas mainly chemical and electronic products and clothes are produced. The official unemployment rate in 2017 was 17.9% and was just below the national average of 18.4%.
administration
The Irbid governorate is divided into nine liwāʾ (departments / districts). These are:

| Surname | Name in Arabic | main place | EW 1994 | EW 2004 | EW 2015 | Men | Women | Area in km² |
|---|---|---|---|---|---|---|---|---|
| al-Aghwār al-Shamāliyya | الأغوار الشمالية | ash-Shūna ash-Shamāliyya | 78,355 | 85.203 | 122,330 | 65,491 | 56,839 | 246 |
| al-Kura | الكورة | Dayr Abī Saʿīd | 71,513 | 91,050 | 161.505 | 82,658 | 78,847 | 179 |
| al-Mazār al-Shamālī | المزار الشمالي | al-Mazār al-Shamālī | 35,651 | 44.166 | 78,427 | 40.161 | 38,266 | 86.2 |
| al-Wasatiyya | الوسطية | Kafr Asad | - | 24,046 | 42,571 | 22,019 | 20,552 | 45.8 |
| ar-Ramthā | الرمثا | ar-Ramthā (Ramtha) | 79,304 | 109,142 | 238.502 | 123.931 | 114,571 | 275 |
| at-Tayba | الطيبة | at-Tayba | 23,847 | 29,132 | 51.501 | 26,273 | 25,228 | 63.5 |
| Banī Kanāna | بني كنانة | Samā ar-Rawsān | 51,868 | 76,398 | 131,797 | 66,826 | 64,971 | 253 |
| Banī ʿUbaid | بني عبيد | al-Hisn | - | 93,561 | 204.313 | 103,962 | 100,351 | 188 |
| Qaṣaba Irbid | قصبة إربد | Irbid | - | 375,594 | 739.212 | 383.313 | 355,899 | 236 |
Individual evidence
- ↑ Jordan in Figures 2017, page 7
- ↑ General Population and Housing Census 2015, Table 8.1
- ↑ General Population and Housing Census 2015, Main Results
- ^ Fruit growing in the Idlib governorate, page 31
- ↑ Field crops in the Idlib governorate, page 38
- ↑ Vegetable growing in Idlib Governorate, page 47
- ↑ Jordan in Figures 2017, p. 11
- ↑ City population
- ↑ 2015 census, table 3.1