
General election in Australia 2019
|
Gains / losses
|
|
← 2016Election to the House of Representatives 2019
(Share of votes in%, voter turnout 91.89%)
% 40 30th 20th 10
0
33.3
28.0
10.4
8.7
4.5
3.4
3.1
0.5
3.4
4.7
Gains and losses
|
|
Distribution of seats in the Senate after the 2019 election
A total of 76 seats
|
The 2019 general election in Australia took place on May 18. The 46th Australian Parliament was elected. The House of Representatives was completely re-elected, while 40 of the 76 seats in the Senate had to be filled. Mainly the incumbent Prime Minister, the party leader of the Liberal Party of Australia Scott Morrison , who was supported by a bourgeois coalition of Liberals, the Liberal National Party and the National Party of Australia, and his challenger Bill Shorten , party leader of the Australian Labor Party , opposite. The election was again narrowly won by the conservative coalition parties. The Labor Party became the strongest single party for the fifth time in a row
Starting position
After the 2016 general election , the middle-right bourgeois coalition led by Malcolm Turnbull , made up of the Liberal Party of Australia (LPA), the Liberal National Party (LNP), the National Party of Australia (NPA) and the Country Liberal, reached Party (CLP), an extremely narrow absolute majority of 76 of the 150 seats in the House of Representatives. The government of the bourgeois coalition, which has been in office since 2013, was thus confirmed despite significant votes and seat losses. The leading candidate of the Social Democratic Labor Party in the 2016 election was Bill Shorten, who prevailed against Anthony Albanese in a vote for party chairmanship in October 2013, replacing Kevin Rudd . As a result, he took over the office of opposition leader for the 2013–2016 and 2016–2019 legislative periods . In this election, too, he is again running as the top candidate.
There was a change at the top of the liberal-national coalition during the current legislative period. On August 23, 2018, Scott Morrison became the new leader of the Liberal Party of Australia. He replaced Malcolm Turnbull, who had held this post since September 2015, but had come under fire for poor poll numbers and poor election results in by-elections in Queensland . On the same day, Morrison also took over the office of Prime Minister of Turnbull, so that he is the LPA's top candidate in this election.
As a result of several by-elections, the liberal-national coalition lost its absolute majority during the legislative period, as several seats previously occupied by the coalition parties went to independent candidates who were not always ready to support the government. Of the original 76 of the 150 seats in the House of Representatives, the center-right coalition still held 73 seats in May 2019. Furthermore, a member of the National Party supports the government, which only functions as a minority government, since the opposition Laboratory does not achieve the necessary majority either.
Other parties, each represented with one seat in the House of Representatives from 2016 to 2019, were the Australian Greens with their MP Adam Bandt from Melbourne , the Nick Xenophon Team with Rebekha Sharkie in Mayo (SA) and the nationalist-conservative and populist Katter's Australian Party . led by Bob Katter, who won in the Kennedy constituency, also in Queensland. There were also two independent candidates. During the legislative period, the Nick Xenophon team also renamed itself the Center Alliance.
In the Senate, the Australian upper house, neither the liberal-national coalition nor the Labor Party had an absolute majority from 2016 to 2019. However, this is the rule in the Second Chamber of the Australian Parliament because, unlike in the case of the House of Representatives, a type of personalized proportional representation is used in each individual state and territory , of which the Greens in particular, who clearly stand out as the third strongest force in parliamentary elections other parties have established benefit.
Survey
The diagrams show the election polls over the entire last legislative period. The moving average is represented by a line.
 |
|
| Two-party preference | Preference taking into account all parties |

Top candidates
The top candidates of all parties and coalitions represented in the House of Representatives after the parliamentary elections:
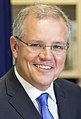
Scott Morrison , Prime Minister
( Liberal Party of Australia for the Liberal-National Coalition)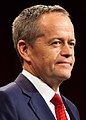
Bill Shorten , opposition leader ( Australian Labor Party )

Richard Di Natale , chairman of the Greens

Bob Katter , chairman of the Katter's Australian Party


The Center Alliance, which is represented with a seat in the House of Representatives, runs without a top candidate.
Suffrage
All 151 members of the House of Representatives are elected for a three-year term, half of the 72 state senators for a six-year term, and the four territorial senators for a three-year term.
There is compulsory voting .
The election of the members of the House of Representatives takes place in 151 one-person constituencies. Here comes Instant Runoff voting is used. Each voter numbers the constituency candidates in the order he or she wishes. All candidates had to be ranked, otherwise the voting slip is invalid.
Six of the twelve new senators per state are elected for the Senate. In addition, the two senators from each of the two territories are newly elected. The table shows the starting position in the Senate before the election.
Transferable individual votes are used in the Senate elections . Each voter must number either at least twelve candidates or at least six parties.
Reallocation of seats in the House of Representatives
Due to changes in the number of inhabitants in the states and territories, the distribution of the seats among the states has changed compared to the last parliamentary election. An overview of the redistribution can be found in the table.
| State, territory | Seats | change |
|---|---|---|
| New South Wales | 47 | ± 0 |
| Victoria | 38 | +1 |
| Queensland | 30th | ± 0 |
| Western Australia | 16 | ± 0 |
| South Australia | 10 | −1 |
| Tasmania | 5 | ± 0 |
| Australian Capital Territory | 3 | +1 |
| Northern Territory | 2 | ± 0 |
| total | 151 | +1 |
Results

House of Representatives
The preliminary result of the election to the House of Representatives is shown in the table below. All parties that received more than 10,000 votes are listed. The missing share of votes can be found under Other .
| Political party | be right | Seats | |||||
|---|---|---|---|---|---|---|---|
| number | % | ± (% p) | number | ± | in % | ||
| Australian Labor Party (ALP) | 4,752,110 | 33.34 | −1.39 | 68 | −1 | 45.0 | |
| Liberal Party of Australia (LPA) | 3,989,413 | 27.99 | −0.68 | 44 | −1 | 29.1 | |
| Australian Greens (Greens) | 1,482,923 | 10.40 | +0.17 | 1 | ± 0 | 0.7 | |
| Liberal National Party (LNP) | 1,236,401 | 8.67 | +0.15 | 23 | +2 | 15.2 | |
| National Party of Australia (NPA) | 642.233 | 4.51 | −0.10 | 10 | ± 0 | 6.6 | |
| United Australia Party (UAP) | 488.817 | 3.43 | +3.43 | 0 | ± 0 | 0.0 | |
| Pauline Hanson's One Nation (Nation) | 438,587 | 3.08 | +1.79 | 0 | ± 0 | 0.0 | |
| Animal Justice Party (AJP) | 116,675 | 0.82 | +0.12 | 0 | ± 0 | 0.0 | |
| Christian Democratic Party (CDP) | 97,513 | 0.68 | −0.63 | 0 | ± 0 | 0.0 | |
| Fraser Anning's Conservative National Party (CNP) | 77.203 | 0.54 | +0.54 | 0 | ± 0 | 0.0 | |
| Katter's Australian Party (KAP) | 69,736 | 0.49 | −0.05 | 1 | ± 0 | 0.7 | |
| Center Alliance (CA) | 46,931 | 0.33 | −1.52 | 1 | ± 0 | 0.7 | |
| Shooters, Fishers and Farmers Party (Shooters) | 41,479 | 0.29 | +0.18 | 0 | ± 0 | 0.0 | |
| Country Liberal Party (CLP) | 38,837 | 0.27 | +0.03 | 0 | ± 0 | 0.0 | |
| Sustainable Australia (SA) | 35,618 | 0.25 | +0.25 | 0 | ± 0 | 0.0 | |
| Liberal Democratic Party (LDP) | 34,666 | 0.24 | −0.25 | 0 | ± 0 | 0.0 | |
| Derryn Hinch's Justice Party (DHJP) | 26,803 | 0.19 | +0.07 | 0 | ± 0 | 0.0 | |
| Western Australia Party (WAP) | 25,298 | 0.18 | +0.18 | 0 | ± 0 | 0.0 | |
| Australian Christians (Christians) | 23,803 | 0.17 | −0.15 | 0 | ± 0 | 0.0 | |
| Democratic Labor Party (DLP) | 18,287 | 0.13 | +0.11 | 0 | ± 0 | 0.0 | |
| Rise Up Australia Party (RAP) | 14,032 | 0.10 | −0.41 | 0 | ± 0 | 0.0 | |
| Science Party | 12,617 | 0.09 | −0.02 | 0 | ± 0 | 0.0 | |
| Victorian Socialists | 12,453 | 0.09 | +0.09 | 0 | ± 0 | 0.0 | |
| Independent | 479.836 | 3.37 | +0.56 | 3 | +1 | 2.0 | |
| Others | 51,081 | 0.36 | −2.46 | 0 | ± 0 | 0.0 | |
| valid votes | 14,253,352 | 94.46 | −0.49 | 151 | +1 | 100 | |
| invalid votes | 835.171 | 5.54 | |||||
| Voter participation (compulsory elective) | 15,088,523 | 91.89 | |||||
| Eligible voters | 16,419,543 | 100.0 | |||||
| Two-party preffered vote * | |||||||
| Coalition of Liberal Party of Australia (LPA), Liberal National Party (LNP) and National Party of Australia (NPA) |
7,344,458 | 51.53 | +1.11 | 77 | +1 | 51.0 | |
| Australian Labor Party | 6,278,347 | 48.47 | −1.17 | 68 | −1 | 45.0 | |
| Source: Australian Electoral Commission | |||||||
* Number and proportion of the higher preferences of the laboratory or coalition
| Political party | NSW | VIC | QLD | WA | SA | TAS | ACT | NT | Total (2019) |
Total (2016) |
|
|---|---|---|---|---|---|---|---|---|---|---|---|
| Australian Labor Party (ALP) | 24 | 21st | 6th | 5 | 5 | 2 | 3 | 2 | 68 | 69 | |
| Liberal Party of Australia (LPA) | 15th | 12 | 0 | 11 | 4th | 2 | 0 | 0 | 44 | 45 | |
| Liberal National Party (LNP) | 0 | 0 | 23 | 0 | 0 | 0 | 0 | 0 | 23 | 21st | |
| National Party of Australia (NPA) | 7th | 3 | 0 | 0 | 0 | 0 | 0 | 0 | 10 | 10 | |
| Australian Greens (Greens) | 0 | 1 | 0 | 0 | 0 | 0 | 0 | 0 | 1 | 1 | |
| Katter's Australian Party (KAP) | 0 | 0 | 1 | 0 | 0 | 0 | 0 | 0 | 1 | 1 | |
| Center Alliance (CA) | 0 | 0 | 0 | 0 | 1 | 0 | 0 | 0 | 1 | 1 | |
| Independent | 1 | 1 | 0 | 0 | 0 | 1 | 0 | 0 | 3 | 2 | |
| total | 47 | 38 | 30th | 16 | 10 | 5 | 3 | 2 | 151 | 150 | |
senate
The result of the election to the Senate is shown in the following table. All parties that were represented in the Senate in this or the last legislative period or received more than 0.5% of the votes are listed. The missing share of votes can be found under Other .
| Political party | be right | Seats | ||||||
|---|---|---|---|---|---|---|---|---|
| number | % | ± (% p) | number | ± | in % | |||
| Liberal-National Coalition | 5,548,142 | 38.11 | +2.93 | 35 | +5 | 46.1 | ||
| Electoral alliance made up of parts of the LPA and NPA | 3,152,483 | 21.59 | +1.58 | 12 | +2 | 15.8 | ||
| Liberal Party of Australia (LPA) | 1,204,039 | 8.24 | +0.53 | 16 | +2 | 15.8 | ||
| Liberal National Party (LNP) | 1,128,730 | 7.73 | +0.79 | 6th | +1 | 7.9 | ||
| Country Liberal Party (CLP) | 38,513 | 0.26 | −0.01 | 1 | ± 0 | 1.3 | ||
| National Party of Australia (NPA) | 24,377 | 0.17 | −0.08 | 0 | ± 0 | 0.0 | ||
| Australian Labor Party (ALP) | 4,204,313 | 28.79 | −1.02 | 26th | ± 0 | 34.2 | ||
| Australian Greens (Greens) | 1,488,427 | 10.19 | +1.57 | 9 | ± 0 | 11.8 | ||
| Pauline Hanson's One Nation (Nation) | 788.203 | 5.40 | +1.12 | 2 | −2 | 2.6 | ||
| United Australia Party (UAP) | 345.199 | 2.36 | +2.36 | 0 | ± 0 | 0.0 | ||
| HEMP | 262,426 | 1.80 | +1.59 | 0 | ± 0 | 0.0 | ||
| Shooters, Fishers and Farmers (Shooters) | 253.267 | 1.73 | +0.34 | 0 | ± 0 | 0.0 | ||
| Animal Justice Party (AJP) | 183.996 | 1.26 | +0.11 | 0 | ± 0 | 0.0 | ||
| Liberal Democratic Party (LDP) | 169.735 | 1.16 | −1.00 | 0 | −1 | 0.0 | ||
| Democratic Labor Party (DLP) | 149.970 | 1.03 | +0.35 | 0 | ± 0 | 0.0 | ||
| Derryn Hinch's Justice Party (DHJP) | 105,459 | 0.72 | −1.21 | 0 | −1 | 0.0 | ||
| Australian Conservatives (CON) | 102,769 | 0.70 | −0.68 | 1 | ± 0 | 0.0 | ||
| Christian Democratic Party (CDP) | 94,301 | 0.65 | −0.52 | 0 | ± 0 | 0.0 | ||
| Fraser Anning's Conservative National Party (CNP) | 94.130 | 0.64 | +0.64 | 0 | ± 0 | 0.0 | ||
| Jacqui Lambie Network (JLN) | 31,383 | 0.21 | −0.29 | 1 | ± 0 | 1.3 | ||
| Center Alliance (CA) | 28,416 | 0.19 | −3.11 | 2 | −1 | 2.6 | ||
| Others | 754.789 | 5.17 | −2.46 | 0 | ± 0 | 0.0 | ||
| valid votes | 14,604,925 | 96.19 | +0.13 | 76 | ± 0 | 100 | ||
| invalid votes | 579.160 | 3.81 | ||||||
| Voter participation (compulsory elective) | 15.184.085 | 92.48 | ||||||
| Eligible voters | 16,419,543 | 100.0 | ||||||
| Source: Australian Electoral Commission | ||||||||
Six of the twelve senators will be elected in each state and two senators in each territory, so 40 of the 76 seats will be filled.
| Political party | NSW | VIC | QLD | WA | SA | TAS | ACT | NT | New election (2019) |
Total (2019) |
Total (2016) |
|
|---|---|---|---|---|---|---|---|---|---|---|---|---|
| Liberal-National Coalition ( LPA , LNP , NPA , CLP ) | 3 | 3 | 3 | 3 | 3 | 2 | 1 | 1 | 19th | 35 | 30th | |
| Australian Labor Party (ALP) | 2 | 2 | 1 | 2 | 2 | 2 | 1 | 1 | 13 | 26th | 26th | |
| Australian Greens (Greens) | 1 | 1 | 1 | 1 | 1 | 1 | 0 | 0 | 6th | 9 | 9 | |
| Pauline Hanson's One Nation (Nation) | 0 | 0 | 1 | 0 | 0 | 0 | 0 | 0 | 1 | 2 | 4th | |
| Center Alliance (CA) | 0 | 0 | 0 | 0 | 0 | 0 | 0 | 0 | 0 | 2 | 3 | |
| Others | 0 | 0 | 0 | 0 | 0 | 1 | 0 | 0 | 1 | 2 | 4th | |
| total | 6th | 6th | 6th | 6th | 6th | 6th | 2 | 2 | 40 | 76 | 76 | |
consequences
The parliamentary election resulted in hardly any changes in the House of Representatives. After the election day on May 18, it was initially unclear - similar to the last election - which party or coalition would form the future government and whether it would have an absolute majority. Only the next morning was a meaningful interim result for the House of Representatives known. The most important result of the election was the extremely narrow confirmation of the absolute majority of the liberal-national coalition government under Scott Morrison, which now has 77 of the 151 parliamentary seats in the House of Representatives. This is one seat more than after the 2016 election. Overall, the governing coalition lost 0.6 percentage points, which is mainly due to the LPA, which lost almost one percentage point and one seat, while the LNP and NPA remained largely stable and the LNP theirs The number of seats was even increased by two to 23. Overall, the coalition received around 41.5% of the vote. The Country Liberal Party as the smallest coalition partner was again unable to win a seat, although it easily won. In the two-party preffered vote , the government again only got a slim majority of 51.3%, although it was able to expand it slightly.
The Labor Party could not achieve its primary electoral goal of replacing the bourgeois coalition from the government and emerged slightly weakened from the election. It gained 33.3% and 68 seats, which was accompanied by a loss of 1.4 percentage points and one seat. In the two-party preffered vote , 48.5% was achieved, which corresponds to a minus of slightly more than one percentage point. Due to the election result, Bill Shorten announced his resignation from the party leadership.
The Greens kept their share of the vote. With 10.4%, they again achieved a double-digit result and remained the third strongest individual party. The only lower house in a constituency in Melbourne could be held.
The social-liberal Center Alliance entered the race as Nick Xenophon Team in 2016 and, with the candidate Rebekha Sharkie, held their only parliamentary seat in the House of Representatives in Mayo (SA). However, it suffered massive losses and only got 0.3% of the vote, which corresponds to a loss of 1.5 percentage points compared to the last election. Bob Katter was also able to defend his seat in parliament. His party kept their score of about 0.5%.
Furthermore, only the United Australia Party with 3.4% and Pauline Hanson's One Nation with 3.1% received results of over one percent of the votes. However, due to the majority vote, this did not lead to a seat in the House of Representatives, although both parties increased significantly compared to the previous election.
Individual evidence
- ↑ https://tallyroom.aec.gov.au/HouseStateFirstPrefsByParty-24310-NAT.htm
- ↑ https://tallyroom.aec.gov.au/HousePartyRepresentationLeading-24310.htm
- ↑ ulz / dpa / AFP: Australia: center-right coalition of Prime Minister Scott Morrison wins election. In: Spiegel Online . May 18, 2019, accessed May 15, 2020 .
- ↑ Australia's Prime Minister wins parliamentary election. In: tagesschau.de. May 19, 2019, accessed May 15, 2020 .
- ^ Katie Beck: Australia Election: Why Is Voting Compulsory? BBC News, September 7, 2013, accessed August 4, 2016 .
- ^ Australian Electoral Commission: Voting in the Senate
- ↑ https://tallyroom.aec.gov.au/SenateStateFirstPrefsByGroup-24310-NAT.htm
1901 | 1903 | 1906 | 1910 | 1913 | 1914 | 1917 | 1919 | 1922 | 1925 | 1928 | 1929 | 1931 | 1934 | 1937 | 1940 | 1943 | 1946 | 1949 | 1951 | 1954 | 1955 | 1958 | 1961 | 1963 | 1966 | 1969 | 1972 | 1974 | 1975 | 1977 | 1980 | 1983 | 1984 | 1987 | 1990 | 1993 | 1996 | 1998 | 2001 | 2004 | 2007 | 2010 | 2013 | 2016 | 2019