
General election in Australia 2016
The general election in Australia in 2016 took place on July 2nd. The 45th Australian Parliament was elected. Mainly there were the incumbent Prime Minister, the party leader of the Liberal Party of Australia Malcolm Turnbull , who is supported by a civic coalition of Liberals, the Liberal National Party and the National Party of Australia, and his challenger Bill Shorten , party leader of the Australian Labor Party , opposite. The election was narrowly won by the bourgeois coalition parties despite losses.
Due to the dissolution of both houses of the Australian Parliament by the Governor General at the request of the government, both the House of Representatives and the Senate were completely re-elected. This last happened in 1987.
Starting position
After the parliamentary elections in 2013 reached the center-right bourgeois coalition led by Tony Abbott , made up of the Liberal Party of Australia (LPA), the Liberal National Party (LNP), the National Party of Australia (NPA) and the Country Liberal Party (CLP), a clear absolute majority of 90 of the 150 seats in the House of Representatives. It replaced the government of the Australian Labor Party (ALP), which had been in office with an absolute majority under Kevin Rudd for six years until 2010 and was then continued as a minority government under Julia Gillard until 2013 . The top candidate of the Social Democratic Labor Party in the election that same year was again Kevin Rudd, who resigned as party leader after his defeat by Tony Abbott and did not become leader of the opposition either. As a result, Bill Shorten was elected with 52% on October 13th by a primary election of the members and a caucus of the ALP with a weighting of 50:50 as the new party chairman. At the same time he took over the office of opposition leader for the 2013-2016 legislative period and was the top candidate in this election.
There was a change at the top of the liberal-national coalition in the current legislative period. On September 14th, Malcolm Turnbull became the new leader of the Liberal Party of Australia. He replaced Tony Abbott, who has held this office since December 2009, by asserting himself at a small party conference in a vote against incumbent Abbott, who had come under criticism from within the party for bad polls by the coalition and was challenged by Turnbull. A day later, on September 15, he also took over the office of Prime Minister, so that he was the top candidate of the LPA in this election.
Other parties represented from 2013 to 2016 with one seat each in the House of Representatives were the Australian Greens with their MP Adam Bandt from Melbourne , the Palmer United Party (PUP) with its chairman Clive Palmer from Fairfax ( Qld ) and the nationalist-conservative and populist Katter's Australian Party led by Bob Katter who also won in the Kennedy constituency in Queensland. There were also two independent candidates. However, Clive Palmer announced in May 2016 that he would no longer run for the House of Representatives, while Bandt and Katter ran again.
The social-liberal Nick Xenophon team led by Nick Xenophon from Adelaide ( SA ) competed for the first time in the election for the House of Representatives .
In the Senate, the Australian upper house, from 2013 to 2016 neither the Liberal-National Coalition nor the Labor Party had an absolute majority. However, this is the rule in the Second Chamber of the Australian Parliament, since, unlike in the case of the House of Representatives, a type of personalized proportional representation is used in each individual state and territory , of which the Greens, in particular, who clearly stand out as the third strongest force in parliamentary elections other parties have established benefit.
Survey
The diagrams show the election polls over the entire last legislative period. The moving average is represented by a line.
 |
|
| Two-party preference | Preference taking into account all parties |

Top candidates
The top candidates of all parties represented in the House of Representatives after the parliamentary elections:
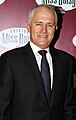
Malcolm Turnbull , Prime Minister
( Liberal Party of Australia for the Liberal-National Coalition)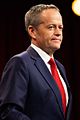
Bill Shorten , opposition leader ( Australian Labor Party )

Richard Di Natale , chairman of the Greens

Nick Xenophon , chairman of the Nick Xenophon team

Bob Katter , chairman of the Katter's Australian Party
.jpg)


Suffrage
The 150 members of the House of Representatives and the 76 members of the Senate were elected. There was compulsory voting .
The election of the members of the House of Representatives took place in 150 one-person constituencies. Here came instant runoff voting is used. The voter numbers the candidates in the constituency in the order he or she wishes. All candidates had to be ranked, otherwise the voting slip is invalid.
Twelve senators were elected for each state for the Senate. In addition, the two senators from each of the two territories were newly elected. The table shows the starting position in the Senate before the election.
| total | laboratory | Coalition | Greens | Others | Independent | |
|---|---|---|---|---|---|---|
| Elected to states in 2010 | 36 | 13 | 16 | 6th | 1 | |
| Elected in territories in 2013 | 4th | 2 | 2 | |||
| Elected to states in 2013 | 36 | 10 | 15th | 4th | 7th |
Transferable individual votes were used in the Senate elections . The voter could either order all candidates (where he really had to order all candidates) or the preference order of a party (group ticket) by ticking the appropriate party.
Results
House of Representatives
The result of the election to the House of Representatives is shown in the table below. All parties that received more than 0.1% of the votes or were represented in the House of Representatives in the last legislative period are listed. The missing share of votes can be found under Other .

Bourgeois Coalition Government (76) Liberals (45) LNP (21) NPA (10) Opposition (69) Laboratory (69) Others ("Crossbencher") (5) Independent (2) Australian Greens (1) NXT (1 ) KAP (1)
| Political party | be right | Seats | |||||
|---|---|---|---|---|---|---|---|
| number | % | ± (% p) | number | ± | in % | ||
| Australian Labor Party (ALP) | 4,702,374 | 34.73 | +1.35 | 69 | +14 | 46.0 | |
| Liberal Party of Australia (LPA) | 3,882,940 | 28.67 | −3.35 | 45 | −13 | 30.0 | |
| Australian Greens (Greens) | 1,385,649 | 10.23 | +1.58 | 1 | ± 0 | 0.7 | |
| Liberal National Party (LNP) | 1,153,736 | 8.52 | −0.40 | 21st | −1 | 14.0 | |
| National Party of Australia (NPA) | 624,555 | 4.61 | +0.32 | 10 | +1 | 6.7 | |
| Nick Xenophon Team (NXT) | 250,333 | 1.85 | +1.85 | 1 | +1 | 0.7 | |
| Family First Party (FFP) | 201.222 | 1.49 | +0.08 | 0 | ± 0 | 0.0 | |
| Christian Democratic Party (CDP) | 178.026 | 1.31 | +0.62 | 0 | ± 0 | 0.0 | |
| Pauline Hanson's One Nation (Nation) | 175.020 | 1.29 | +1.12 | 0 | ± 0 | 0.0 | |
| Animal Justice Party (AJP) | 94.511 | 0.70 | +0.69 | 0 | ± 0 | 0.0 | |
| Katter's Australian Party (KAP) | 72,879 | 0.54 | −0.50 | 1 | ± 0 | 0.7 | |
| Rise Up Australia Party (RAP) | 68,418 | 0.51 | +0.13 | 0 | ± 0 | 0.0 | |
| Liberal Democratic Party (LDP) | 66.261 | 0.49 | +0.45 | 0 | ± 0 | 0.0 | |
| Australian Christians (Christians) | 43,150 | 0.32 | −0.01 | 0 | ± 0 | 0.0 | |
| Country Liberal Party (CLP) | 32,409 | 0.24 | −0.08 | 0 | −1 | 0.0 | |
| Australian Liberty Alliance (ALA) | 25,337 | 0.19 | +0.19 | 0 | ± 0 | 0.0 | |
| Drug Law Reform (DLR) | 20,349 | 0.15 | +0.15 | 0 | ± 0 | 0.0 | |
| Derryn Hinch's Justice Party (DHJP) | 16.885 | 0.12 | +0.12 | 0 | ± 0 | 0.0 | |
| Shooters, Fishers and Farmers Party (Shooters) | 15,477 | 0.11 | +0.11 | 0 | ± 0 | 0.0 | |
| Science Party | 14.988 | 0.11 | +0.10 | 0 | ± 0 | 0.0 | |
| Bullet Train For Australia (BTA) | 14.078 | 0.10 | −0.05 | 0 | ± 0 | 0.0 | |
| Palmer United Party (PUP) | 315 | 0.00 | −5.49 | 0 | −1 | 0.0 | |
| Independent | 380.712 | 2.81 | +1.44 | 2 | ± 0 | 1.3 | |
| Others | 121,584 | 0.90 | −1.80 | 0 | ± 0 | 0.0 | |
| valid votes | 13,541,208 | 94.95 | +0.86 | 150 | ± 0 | 100 | |
| invalid votes | 720.794 | 5.05 | |||||
| Voter participation (compulsory elective) | 14.262.002 | 90.98 | |||||
| Eligible voters | 100.0 | ||||||
| Two-party preffered vote * | |||||||
| Coalition of Liberal Party of Australia (LPA), Liberal National Party (LNP) and National Party of Australia (NPA) |
6,771,212 | 50.51 | −2.98 | 76 | −14 | 50.7 | |
| Australian Labor Party | 6,634,419 | 49.49 | +2.98 | 69 | +14 | 46.0 | |
| Source: Australian Electoral Commission | |||||||
* Number and proportion of the higher preferences of the laboratory or coalition
| Political party | NSW | VIC | QLD | WA | SA | TAS | ACT | NT | Total (2016) |
Total (2013) |
|
|---|---|---|---|---|---|---|---|---|---|---|---|
| Australian Labor Party (ALP) | 24 | 18th | 8th | 5 | 6th | 4th | 2 | 2 | 69 | 55 | |
| Liberal Party of Australia (LPA) | 16 | 14th | 0 | 11 | 4th | 0 | 0 | 0 | 45 | 58 | |
| Liberal National Party (LNP) | 0 | 0 | 21st | 0 | 0 | 0 | 0 | 0 | 21st | 22nd | |
| National Party of Australia (NPA) | 7th | 3 | 0 | 0 | 0 | 0 | 0 | 0 | 10 | 9 | |
| Australian Greens (Greens) | 0 | 1 | 0 | 0 | 0 | 0 | 0 | 0 | 1 | 1 | |
| Nick Xenophon Team (NXT) | 0 | 0 | 0 | 0 | 1 | 0 | 0 | 0 | 1 | 1 | |
| Katter's Australian Party (KAP) | 0 | 0 | 1 | 0 | 0 | 0 | 0 | 0 | 1 | 1 | |
| Independent | 0 | 1 | 0 | 0 | 0 | 1 | 0 | 0 | 2 | 2 | |
| total | 47 | 37 | 30th | 16 | 11 | 5 | 2 | 2 | 150 | 150 | |
- Party affiliation of the elected MPs in the constituencies

Majorities in the constituencies (House of Representatives): Liberals , Nationals , Labor , Independent and other parties , Australian Greens

senate
The result of the election to the Senate is shown in the following table. All parties that were represented in the Senate in this or in the last legislative period are listed. The missing share of votes can be found under Other .

Civic coalition government (30) Liberals (21) LNP (5) NPA (3) CLP (1) Opposition (26) Laboratory (26) Other ("Crossbencher") (20) Australian Greens (9) One Nation ( 4) NXT (3) FFP (1) LDP (1) JLN (1) DHJP (1)
| Political party | be right | Seats | ||||||
|---|---|---|---|---|---|---|---|---|
| number | % | ± (% p) | number | ± | in % | |||
| Liberal-National Coalition | 4,868,968 | 35.18 | −2.52 | 30th | −3 | 39.5 | ||
| Electoral alliance made up of parts of the LPA and NPA | 2,769,426 | 20.01 | −1.32 | 10 | ± 0 | 13.2 | ||
| Liberal Party of Australia (LPA) | 1,067,286 | 7.71 | +0.77 | 14th | −2 | 18.4 | ||
| Liberal National Party (LNP) | 960.467 | 6.94 | −1.16 | 5 | −1 | 6.6 | ||
| Country Liberal Party (CLP) | 37,156 | 0.27 | −0.05 | 1 | ± 0 | 1.3 | ||
| National Party of Australia (NPA) | 34,633 | 0.25 | −0.06 | 0 | ± 0 | 0.0 | ||
| Australian Labor Party (ALP) | 4,123,153 | 29.79 | +0.16 | 26th | +1 | 34.2 | ||
| Australian Greens (Greens) | 1,197,690 | 8.65 | −0.58 | 9 | −1 | 11.8 | ||
| Pauline Hanson's One Nation (Nation) | 592,539 | 4.28 | +3.75 | 4th | +4 | 5.3 | ||
| Nick Xenophon Team (NXT) | 456.556 | 3.30 | +1.37 | 3 | +2 | 3.9 | ||
| Liberal Democratic Party (LDP) | 298.930 | 2.16 | −1.59 | 1 | ± 0 | 1.3 | ||
| Derryn Hinch's Justice Party (DHJP) | 266,660 | 1.93 | +1.93 | 1 | +1 | 1.3 | ||
| Family First Party (FFP) | 189,852 | 1.37 | +0.25 | 1 | ± 0 | 1.3 | ||
| Democratic Labor Party (DLP) | 94,525 | 0.68 | −0.18 | 0 | −1 | 0.0 | ||
| Jacqui Lambie Network (JLN) | 69,074 | 0.50 | +0.50 | 1 | +1 | 1.3 | ||
| Australian Motoring Enthusiast Party (AMEP) | 53,242 | 0.38 | −0.12 | 0 | −1 | 0.0 | ||
| Palmer United Party (PUP) | 26,230 | 0.19 | −5.42 | 0 | −3 | 0.0 | ||
| Others | 1,601,481 | 11.57 | +1.25 | 0 | ± 0 | 0.0 | ||
| valid votes | 13,838,900 | 96.06 | −1.01 | 76 | ± 0 | 100 | ||
| invalid votes | 567,806 | 3.94 | ||||||
| Voter participation (compulsory elective) | 14,406,706 | 91.93 | ||||||
| Eligible voters | 100.0 | |||||||
| Source: Australian Electoral Commission | ||||||||
Twelve senators were elected in each state and two senators in each territory so that all 76 seats were newly filled.
| Political party | NSW | VIC | QLD | WA | SA | TAS | ACT | NT | total | |
|---|---|---|---|---|---|---|---|---|---|---|
| Liberal-National Coalition ( LPA , LNP , NPA , CLP ) | 5 | 5 | 5 | 5 | 4th | 4th | 1 | 1 | 30th | |
| Australian Labor Party (ALP) | 4th | 4th | 4th | 4th | 3 | 5 | 1 | 1 | 26th | |
| Australian Greens (Greens) | 1 | 2 | 1 | 2 | 1 | 2 | 0 | 0 | 9 | |
| Pauline Hanson's One Nation (Nation) | 1 | 0 | 2 | 1 | 0 | 0 | 0 | 0 | 4th | |
| Nick Xenophon Team (NXT) | 0 | 0 | 0 | 0 | 3 | 0 | 0 | 0 | 3 | |
| Others | 1 | 1 | 0 | 0 | 1 | 1 | 0 | 0 | 4th | |
| total | 12 | 12 | 12 | 12 | 12 | 12 | 2 | 2 | 76 | |
consequences
After election day on July 2, it was long unclear which party or coalition would form the future government and whether it would have an absolute majority. It was not until the beginning of August that the final result for both the House of Representatives and the Senate was clear. The most important result of the election was the extremely narrow confirmation of the absolute majority of the liberal-national coalition government under Malcolm Turnbull, which only has 76 of the 150 parliamentary seats in the House of Representatives. This is 14 seats less than in the 2013 election. The biggest coalition partner is primarily responsible for the losses, losing 3.3 percentage points and 13 seats, while the LNP and NPA remained largely stable. Overall, the coalition received 42.04% of the vote. That is 3.5 percentage points less than in the last election. The Country Liberal Party as the smallest coalition partner could no longer win a seat. In the two-party preffered vote , the government came up with a slim majority of 50.51%.
The Labor Party was unable to achieve its primary electoral goal of replacing the bourgeois coalition from the government, but emerged significantly stronger from the election. It won 34.7% and 69 seats, which was accompanied by a gain of 1.4 percentage points and 14 seats. In the two-party preffered vote , 49.49% were achieved, which corresponds to an increase of almost three percentage points. Due to the election result, Bill Shorten can remain opposition leader and laboratory chairman for the time being.
The Greens also won. With 10.2% and 1.5 percentage points more than in 2013, they achieved a double-digit result and replaced the Liberal National Party, which is part of the governing coalition, as the third strongest individual party. The only lower house in a constituency in Melbourne could be held.
The social-liberal Nick Xenophon Team won a seat in Parliament for the first time with the candidate Rebekha Sharkie in Mayo (SA) and came out of the box to 1.9%. Bob Katter was also able to defend his seat in parliament, although his party only got 0.5%, lost half of the votes and only finished 11th among all parties.
A similar picture emerged in the Senate. The coalition lost three seats and got a total of 30 seats with about 35%, while Labor gained one seat and got 26 members with about 30% of the vote. The Greens lost easily and lost one of their ten seats.
Pauline Hanson's One Nation also won strongly . The right-wing populist party came almost instantly to over four percent and four seats. She was previously not represented in the Senate. The Nick Xenophon team rose to 3.3% and gained two Senate seats, so that the party now has three elected officials. All other parties can be described as small parties and do not get beyond a seat in the House of Lords.
Individual evidence
- ↑ Website of the Australian Election Commission (First preferences by party) ( Memento of the original from July 4, 2016 in the Internet Archive ) Info: The archive link was inserted automatically and has not yet been checked. Please check the original and archive link according to the instructions and then remove this notice. , accessed August 3, 2016
- ^ Katie Beck: Australia Election: Why Is Voting Compulsory? BBC News, September 7, 2013, accessed August 4, 2016 .
- ↑ Website of the Australian Election Commission (Party representation) ( Memento of the original from July 20, 2016 in the Internet Archive ) Info: The archive link was inserted automatically and has not yet been checked. Please check the original and archive link according to the instructions and then remove this notice. , accessed August 4, 2016
- ↑ Website of the Australian Election Commission (First preferences by Senate group) ( Memento of the original dated August 12, 2016 in the Internet Archive ) Info: The archive link was inserted automatically and has not yet been checked. Please check the original and archive link according to the instructions and then remove this notice. , accessed August 4, 2016
1901 | 1903 | 1906 | 1910 | 1913 | 1914 | 1917 | 1919 | 1922 | 1925 | 1928 | 1929 | 1931 | 1934 | 1937 | 1940 | 1943 | 1946 | 1949 | 1951 | 1954 | 1955 | 1958 | 1961 | 1963 | 1966 | 1969 | 1972 | 1974 | 1975 | 1977 | 1980 | 1983 | 1984 | 1987 | 1990 | 1993 | 1996 | 1998 | 2001 | 2004 | 2007 | 2010 | 2013 | 2016 | 2019