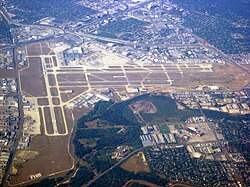
San Antonio Airport
| San Antonio International Airport | |
|---|---|

|
|
| Characteristics | |
| ICAO code | KSAT |
| IATA code | SAT |
| Coordinates | |
| Height above MSL | 246 m (807 ft ) |
| Transport links | |
| Distance from the city center | 14 km north of San Antonio |
| Street | Interstate 410 , US Route 281 |
| Local transport | buses |
| Basic data | |
| opening | 1941 |
| operator | San Antonio Aviation Department |
| surface | 1052 ha |
| Terminals | 2 |
| Passengers | 10,363,040 (2019) |
| Air freight | 125,908 t (2019) |
| Flight movements |
160,776 (2017) |
| Employees | 5,979 (2011) |
| Runways | |
| 3/21 | 2288 m × 46 m concrete |
| 12R / 30L | 2591 m × 46 m concrete |
| 12L / 30R | 1682 m × 30 m asphalt |
The San Antonio International Airport ( Engl. San Antonio International Airport ) is the busiest airport in the city of San Antonio in the US state of Texas . The airport used to be called San Antonio Municipal Airport and Alamo Field .
history
In 1941, the city of San Antonio acquired five square kilometers north of the city for a planned San Antonio Municipal Airport. After the USA entered World War II , the site was taken over by the United States Army Air Forces and opened as Alamo Field in 1942. After the end of the war, the airport was transferred back to the city administration and released for civil use. From 1951 to 1953 a reception building (today Terminal 2) was built, which was expanded for the 1968 World Exhibition .
From 1975 to 1984 what is now Terminal 1 was built and the capacity increased from 8 to 27 gates , including 24 passenger boarding bridges .
business
In 2019, San Antonio Airport handled approximately 10.4 million passengers to destinations in the United States, Canada and Mexico . The largest provider was the airline Southwest Airlines .
Traffic figures

| year | Passenger volume | Air freight ( tons ) (with airmail) |
Aircraft movements (with military) |
||
|---|---|---|---|---|---|
| National | International | total | |||
| 2019 | 9,895,565 | 467.475 | 10,363,040 | 125.908 | |
| 2018 | 9,629,310 | 415.101 | 10,044,411 | 123.612 | |
| 2017 | 8,695,161 | 368.381 | 9,063,542 | 113.712 | 160,776 |
| 2016 | 8,218,044 | 400,061 | 8,618,105 | 107,981 | 164.211 |
| 2015 | 7,996,383 | 511.076 | 8,507,459 | 105,545 | 168.051 |
| 2014 | 7,904,981 | 464.765 | 8,369,746 | 105,838 | 172,620 |
| 2013 | 7,777,721 | 474,609 | 8,252,330 | 105.136 | 176,666 |
| 2012 | 7,821,503 | 421.718 | 8,243,221 | 117.181 | 179.060 |
| 2011 | 7,989,793 | 182.031 | 8,171,824 | 120,046 | 178.113 |
| 2010 | 7,897,750 | 136,794 | 8,034,544 | 123.809 | 177.415 |
| 2009 | 7,694,518 | 143,703 | 7,838,221 | 115,540 | 194,657 |
Busiest routes
| rank | city | Passengers | airline |
|---|---|---|---|
| 1 | Dallas / Fort Worth , Texas | 519.130 | American |
| 2 | Atlanta , Georgia | 463,570 | Delta , Frontier , Southwest |
| 3 | Dallas – Love , Texas | 329.070 | Southwest |
| 4th | Houston-Bush , Texas | 320,450 | United |
| 5 | Denver , Colorado | 291,540 | Frontier, Southwest, United |
| 6th | Phoenix – Sky Harbor , Arizona | 287.430 | American, Southwest |
| 7th | Los Angeles , California | 228,250 | American, Delta, Southwest, United |
| 8th | Las Vegas , Nevada | 227.310 | Allegiant , Frontier, Southwest, Sun Country |
| 9 | Chicago-O'Hare , Illinois | 210.140 | American, United |
| 10 | Houston – Hobby , Texas | 193.730 | Southwest |
Web links
- Official website of the airport (English)
- Official website of the airport operator (English)
- Airport data on World Aero Data ( 2006 )
Individual evidence
- ↑ a b c About SAAS. SanAntonio.gov, accessed July 3, 2018 .
- ↑ a b c d e f Financial Information & Statistics. SanAntonio.gov, accessed April 1, 2020 .
- ^ Economic Impact of San Antonio Airport System (SAAS). SanAntonio.gov, accessed on August 13, 2018 .
- ^ A b San Antonio, TX: San Antonio International (SAT). Transtats.BTS.gov , accessed April 1, 2020 .