OpenSeaMap
|
|
|
|---|---|
| The Free Nautical Chart | |
| Wikiproject to create a free nautical chart. | |
| languages | German, English, French, Italian, Spanish, Russian |
| operator | Community |
| editorial staff | Members of the "OpenSeaMap and OpenStreetMap Community" |
| Registration | only necessary for editors |
| On-line | 2009 |
| http://openseamap.org/ | |
OpenSeaMap - the free nautical map is a free project that collects nautical information and geodata that can be freely used by everyone . With the help of this data, a worldwide nautical map is created. The map can be accessed via the OpenSeaMap website and is also offered for downloading for use as an electronic nautical chart for offline use.
The project is part of OpenStreetMap . OpenSeaMap uses the same database and supplements the geospatial data with nautical information. This data can be used freely according to the Open Database License . This enables integration in printed products, websites and applications such as navigation software without being restricted by restrictive licenses or having to pay fees. The naming of OpenSeaMap as a data source is required for data usage.
history
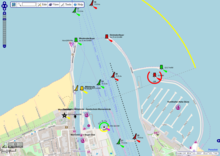
The idea for the project arose at an OpenStreetMap developer conference in autumn 2008 in the Linux Hotel in Essen. Navigators and programmers decided to take care of the oceans and inland waters as part of OpenStreetMap. Right from the start, the project was global and multilingual. After the structural prerequisites were created in 2009, the Warnemünde model harbor was able to show what the nautical chart could look like. A separate server has been available since autumn 2009 and the project uses various collaborations with other free projects and other organizations.
In November 2009 the project was described in the technical sailing newspaper Palstek , in December in the yacht . In January 2010, the project was invited to the water sports trade fair boot in Düsseldorf, where it presented itself to a large specialist audience for the first time. In 2011, the project was presented to an international geodesy specialist audience at INTERGEO . 2012 again at boot . In 2013 OpenSeaMap was invited to the international Hydrographic Day and published in Hydro International and Hydrographic News . In 2014 the project is back at boot . The developers meet twice a year in Nuremberg for a multi-day developer conference.
Contents of the nautical chart
Beacons , fairway buoys , shoal buoys and other navigation signs are displayed . In the ports, the port facilities are mapped (port wall, pier, jetties, landing stages, petrol stations, loading cranes, access roads, railway lines, ferry lines), as well as authorities, shipyards and repair shops, as well as sanitary and supply systems. The nautical attributes correspond to the international standard IHO-S-57 .
The data is displayed in several layers with OpenLayers on the OpenStreetMap base map. The base map contains all possible objects in OpenStreetMap. Above that are sea marks, harbors, weather maps, coastal and inland water gauges, temporary regatta events and sea depths based on a bathymetric model for describing the seabed .
Since 2013/14, water depths in shallow water areas have been recorded and the degree of coverage displayed.
Possible applications
The card is used to plan sailing trips and boat trips. On the way, it serves the holidaymaker for orientation or as a holiday diary. It is not intended to replace official nautical charts .
Online map
The map can be accessed from any computer with an Internet connection via the OpenSeaMap.org website. This map is updated daily.
The map can also be built into a website and supplemented individually with additional geo-data, for example to display position data of ships, charter areas and stations, service bases or the route of the club's ship. The map can be moved around the world and the scale can be selected.
Offline map
The map can also be loaded onto a data memory and used on any PC without an Internet connection. The map can also be used on Garmin and Lowrance GPS devices via a map installer. Use on PNA and PDA is also possible. The offline map is updated regularly, usually weekly.
App for Android and iOS
The free app for OpenSeaMap works with all Android and iOS devices. The current position is shown on the map. Once loaded, maps are permanently saved on the device and can therefore also be used without an Internet connection. With an internet connection it is checked every time whether there is a new version of the map. Apple's location search finds the right map section. The app works worldwide.
navigation
With special navigation programs, it is possible to display the current position directly on the map via a connected GPS receiver and to follow the ship's movement. An autopilot can also be operated via an NMEA interface and thus the ship can be steered. It is also possible to display AIS signals . Suitable navigation programs from the open source area are SeaClear (Windows) and OpenCPN (Windows, Linux, MacOS).
A trip planning tool enables exact course determination and distance measurement, for short distances loxodrom and for great circle navigation also orthodrom . Waypoint lists can also be created and exported with it.
internationality
The website is translated into six languages: German, English, French, Italian, Spanish and Russian. The tools and the legends are available with a German, English and French interface. The names of the places are always written in the local language and script on the map. The geographic coverage is worldwide. Depending on the region and the cartographers active there , the degree of coverage varies and is growing daily.
Topicality
The data is saved immediately after entry and is immediately available worldwide. The data on the basic map are visible on the map after just a few minutes. New or changed nautical data are currently (2011) visible on the map after just under an hour. Weather maps are updated three times a day. Ship positions and level data are displayed almost in real time.
Editing tools

Offline editor "JOSM" with nautical extensions
JOSM is the standard editor for OpenStreetMap. It has been expanded to include special capabilities ( plug-in ) for nautical use . It is written in Java and runs on various desktop platforms. The offline editor can be called up directly from the map.
To edit you have to log in with a verified email address. Registration is free and should help to generate high data quality through personal responsibility. Read access is possible without logging in.
GPS tracks stored on the local computer or loaded onto the server are usually used as raw data . These are displayed by the editing tool together with freely available satellite or aerial images. On the basis of this displayed data, the user can now create points, lines and areas that map the objects of reality. Attributes describing the objects and their properties can be assigned to these points and lines. The editors are designed so that only permitted combinations can be entered.
Other programs can read and write access to the data on the OpenSeaMap server via the XML-RPC interface.
Port manual
Ports , marinas and anchorages around the world are shown on the map . These are linked via a pop-up to a port manual in which detailed port information can be called up. This port manual is structured as a wiki and is designed by the users. The cooperation partner is the free wiki project “ SkipperGuide ”. 5000 ports can be reached worldwide, 600 of which are described in detail.
Weather information
Various weather data are displayed on weather maps around the world : wind map, air pressure map (isobar map), etc., each with two to three times daily updates and with a forecast for up to three days.
For each port there is a meteogram with detailed wind forecasts and weather information over a forecast period of eight days. Weather data is available for wind direction, wind strength, air temperature, air pressure, relative humidity, cloud cover, and precipitation. From this globally available data, the expert can determine the expected sea weather .
Ocean depths
Worldwide the sea depths between 100 and 10,000 m are displayed in a 23-step blue scale and shading. Trenches and ridges are easy to see. In addition, labeled contour lines are displayed on a larger scale . The data come from a cooperation with GEBCO and their bathymetric GEBCO_08 data set.
Depending on the depths, elevation lines and shading are used to indicate terrain heights. The elevation data comes from the ASTER project by METI and NASA .
Crowdsourced water depths
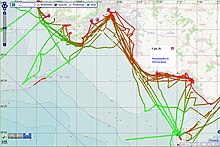
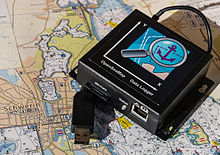
Shallow water depths are recorded worldwide through crowd sourcing . Sailors, motor boaters, professional ships, divers and fishermen record depths between 0 and 100 m with echo sounder and GPS. Divers work with dive computers . A data logger developed in-house is used to record the data . Coastal waters, lakes and rivers are measured. A terrain model is to be created from the collected mass data and contour lines derived from it. Uploaded tracks are shown on the map. The IHO discusses how crowdsourcing can support and supplement the systematic, mostly official, surveying of the seabed.
Wikipedia article on map
With “View Wikipedia Links”, all georeferenced Wikipedia articles are displayed as icons on the map . 3.2 million articles are currently georeferenced, in 272 languages, of which 433,000 in German and 920,000 in English (December 2013). With mouseover , a pop-up opens with the title of the article and an informative picture. With a click you land directly in the corresponding Wikipedia article.
Aerial photos
The nautical information can optionally be displayed on aerial photographs from Bing or on the base map from OpenStreetMap. The aerial photos are also available worldwide to digitize geographic information, some in high resolution.
Kayak card, diver card
For kayakers, the "Sport" layer shows all the rivers in the world. Kayak routes are highlighted in color according to their level of difficulty. Entry and exit points are marked, as are obstacles and transfer points. In Germany, the river level with the current water level is also displayed in the "Level" layer.
For divers, the "Sport" layer shows interesting dive sites, bottle filling stations, dive shops and equipment rentals.
Vector map for Garmin plotter
Owners of chartplotters from Garmin can use a card specially created for these devices. The vector format allows the whole of Europe to be mapped on a 4 GB memory card (North Sea, Baltic Sea, Norwegian coast, Channel, Great Britain, Biscay, Portuguese coast, Mediterranean, Black Sea). The European inland waters are also included. Garmin maps are available worldwide. These cards also work on handheld devices that are capable of "marine mode".
Individual evidence
- ↑ Map elements "Map Features" on Openstreetmap
- ↑ OruxMaps
- ↑ App for OpenSeaMap for iPhone, iPad and iPod touch
- ↑ OpenSeaMap, navigation programs: SeaClear
- ↑ OpenCPN in the English language Wikipedia
- ↑ OpenSeaMap, navigation programs: OpenCPN
- ↑ JOSM editor
- ↑ Port handbook "SkipperGuide"
- ↑ Wolfgang Bosch, Markus Bärlocher: OpenSeaMap - water depths by crowdsourcing (PDF; 7.2 MB). Hydrographische Nachrichten 95, 30th volume, June 2013, pages 23-27.
- ↑ Water depths via crowdsourcing (map)
- ↑ BSH press release on the IHO conference in Monaco ( Memento of the original from November 8, 2014 in the Internet Archive ) Info: The archive link was inserted automatically and has not yet been checked. Please check the original and archive link according to the instructions and then remove this notice.
- ↑ OpenSeaMap - the free nautical map. Retrieved September 16, 2019 .
- ↑ Bing provides aerial photos
- ↑ Kayak map
- ↑ flow level
- ^ Diver card
- ↑ Garmin maps


