
List of supporting companies according to greenhouse gas emissions
The list of producing companies according to greenhouse gas emissions sorts those producing companies with the world's highest CO 2 equivalent potential of greenhouse gases from their production products, be it crude oil, natural gas or coal. The greenhouse gas emissions reported are based on data and estimates by the Carbon Disclosure Project and the Climate Accountability Institute of the companies with the highest greenhouse gas emissions. The list contains the absolute emissions and the percentage of global greenhouse gas emissions. The emissions are categorized according to the GHG Protocol standard of the World Resources Institute (WRI) and the World Business Council for Sustainable Development (WBCSD).
The emission values are the sum of certain Scope 1 and Scope 3 emissions. Scope 1 emissions come from emission sources within the system boundaries under consideration; Scope 3 emissions are all other emissions that are caused by the company's activities but are not under the company's control. In order to avoid double counting in accordance with the principles of carbon accounting , only those emissions are taken into account from the scope 1 emissions that are caused by the extraction of fossil fuels. Of the Scope 3 emissions, only those resulting from the use of the products sold are used. This category typically accounts for more than 90% of the total emissions attributable to a fossil fuel company. By choosing these emission categories, the list represents a producer-oriented view of greenhouse gas emissions; Emissions are allocated to the company that produced the fossil fuels used, without taking into account the actual consumer.
The emissions are converted into CO 2 equivalents . The percentages are the share of global anthropogenic greenhouse gas emissions (excluding land use changes and excluding methane emissions from agriculture, waste management and other non-industrial sources, but including cement production and other process-related emissions of CO 2 and other greenhouse gases).
List (2015)
In 2015, the following companies had the highest funding potential for global emissions in millions of tons of CO 2 equivalents (CO 2 -eq).
List (cumulative 1988-2015)
From 1988 to 2015, the following companies had the highest cumulative funding potential for global emissions in millions of tons of CO 2 equivalents (CO 2 -eq).
| rank | Companies | country | Ownership | Emissions | World share in percent |
|---|---|---|---|---|---|
| 1 | Coal Company (People's Republic of China) |
|
State / private | 128,933 | 14.3 |
| 2 | Saudi Aramco |
|
State | 40,561 | 4.5 |
| 3 | Gazprom |
|
State | 35,221 | 3.9 |
| 4th | National Iranian Oil Company |
|
State | 20,505 | 2.3 |
| 5 | ExxonMobil |
|
Private | 17,785 | 2.0 |
| 6th | Coal India |
|
State | 16,842 | 1.9 |
| 7th | PEMEX |
|
State | 16,804 | 1.9 |
| 8th | Coal company (Russia) |
|
State / private | 16,740 | 1.9 |
| 9 | Royal Dutch Shell |
|
Private | 15,017 | 1.7 |
| 10 | China National Petroleum Corporation |
|
State | 14,042 | 1.6 |
| 11 | BP |
|
Private | 13,791 | 1.5 |
| 12 | Chevron Corporation |
|
Private | 11,823 | 1.3 |
| 13 | Petróleos de Venezuela |
|
State | 11,079 | 1.2 |
| 14th | Abu Dhabi National Oil Company |
|
State | 10,769 | 1.2 |
| 15th | Coal company (Poland) |
|
State / private | 10,480 | 1.2 |
| 16 | Peabody Energy |
|
Private | 10,364 | 1.2 |
| 17th | Sonatrach |
|
State | 8,997 | 1.0 |
| 18th | Kuwait Petroleum Corporation |
|
State | 8,961 | 1.0 |
| 19th | Total |
|
Private | 8,541 | 0.9 |
| 20th | BHP Group |
|
Private | 8,183 | 0.9 |
| 21st | ConocoPhillips |
|
Private | 7,463 | 0.9 |
| 22nd | Petrobras |
|
State | 6,907 | 0.8 |
| 23 | Lukoil |
|
Private | 6,750 | 0.8 |
| 24 | Rio Tinto Group |
|
Private | 6,743 | 0.7 |
| 25th | Nigerian National Petroleum Corporation |
|
State | 6,491 | 0.7 |
| 26th | Petronas |
|
State | 6,185 | 0.7 |
| 27 | Rosneft |
|
State | 5,866 | 0.7 |
| 28 | Arch Coal |
|
Private | 5,696 | 0.6 |
| 29 | Iraq National Oil Company |
|
State | 5,362 | 0.6 |
| 30th | Eni |
|
Private | 5,319 | 0.6 |
| 31 | Anglo American |
|
Private | 5,287 | 0.6 |
| 32 | Surgutneftegas |
|
Private | 5,135 | 0.6 |
| 33 | Alpha Natural Resources |
|
Private | 4,904 | 0.5 |
| 34 | Qatar Petroleum |
|
State | 4,901 | 0.5 |
| 35 | Pertamina |
|
State | 4,857 | 0.5 |
| 36 | Coal company (Kazakhstan) |
|
State / private | 4,735 | 0.5 |
| 37 | Equinor |
|
State | 4,695 | 0.5 |
| 38 | National Oil Corporation |
|
State | 4,526 | 0.5 |
| 39 | Consol Energy |
|
Private | 4,495 | 0.5 |
| 40 | Coal Company (Ukraine) |
|
State / private | 4,429 | 0.5 |
| 41 | RWE |
|
Private | 4,201 | 0.5 |
| 42 | Oil and Natural Gas Corporation |
|
State | 3,560 | 0.4 |
| 43 | Glencore |
|
Private | 3,387 | 0.4 |
| 44 | Türkmengaz |
|
State | 3,217 | 0.4 |
| 45 | Sasol |
|
Private | 3,195 | 0.4 |
| 46 | Repsol |
|
Private | 2,996 | 0.3 |
| 47 | Anadarko Petroleum |
|
Private | 2,991 | 0.3 |
| 48 | Egyptian General Petroleum |
|
State | 2,827 | 0.3 |
| 49 | Petroleum Development Oman |
|
State | 2,769 | 0.3 |
| 50 | Coal company (Czech Republic) |
|
State / private | 2,706 | 0.3 |
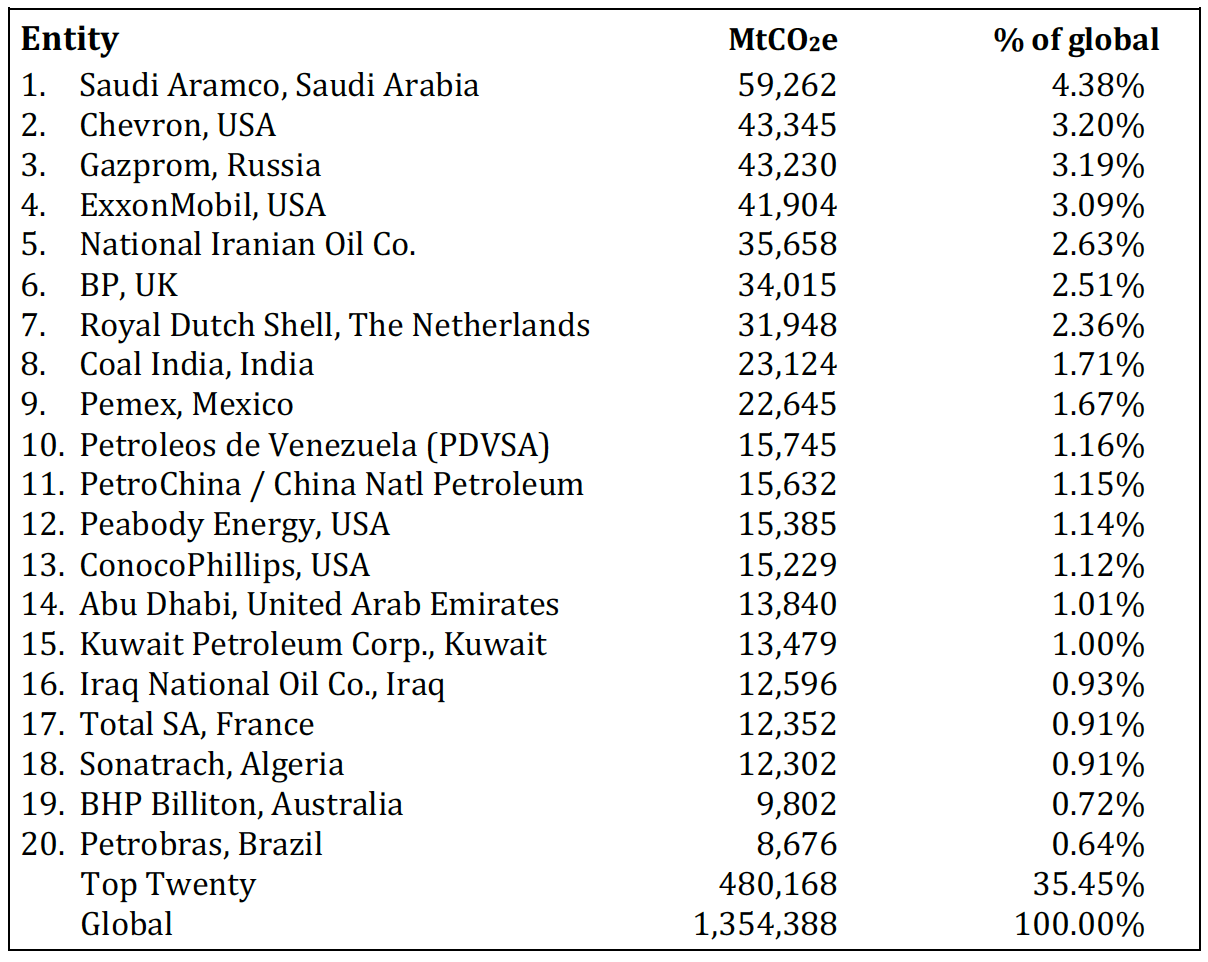
List (cumulative 1965-2017)
From 1965 to 2017, the following companies had the highest cumulative funding potential for global emissions in millions of tons of CO 2 equivalents (CO 2 -eq).
| rank | Companies | country | Ownership | Emissions | World share in percent |
|---|---|---|---|---|---|
| 1 | Saudi Aramco |
|
State | 59,262 | 4.38 |
| 2 | Chevron Corporation |
|
Private | 43,345 | 3.20 |
| 3 | Gazprom |
|
State | 43,230 | 3.19 |
| 4th | ExxonMobil |
|
Private | 41,904 | 3.09 |
| 5 | National Iranian Oil Company |
|
State | 35,658 | 2.63 |
| 6th | BP |
|
Private | 34,015 | 2.51 |
| 7th | Royal Dutch Shell |
|
Private | 31,948 | 2.36 |
| 8th | Coal India |
|
State | 23,124 | 1.71 |
| 9 | PEMEX |
|
State | 22,645 | 1.67 |
| 10 | Petróleos de Venezuela |
|
State | 15,745 | 1.16 |
| 11 | China National Petroleum Corporation |
|
State | 15,632 | 1.15 |
| 12 | Peabody Energy |
|
Private | 15,385 | 1.14 |
| 13 | ConocoPhillips |
|
Private | 15,229 | 1.12 |
| 14th | Abu Dhabi National Oil Company |
|
State | 13,840 | 1.01 |
| 15th | Kuwait Petroleum Corporation |
|
State | 13,479 | 1.00 |
| 16 | Iraq National Oil Company |
|
State | 12,596 | 0.93 |
| 17th | Total |
|
Private | 12,352 | 0.91 |
| 18th | Sonatrach |
|
State | 12.302 | 0.91 |
| 19th | BHP Group |
|
Private | 9,802 | 0.72 |
| 20th | Petrobras |
|
State | 8,676 | 0.64 |
Web links
- 100 companies are responsible for 71% of GHG emissions at Acciona
- Which Companies Are Responsible For the Most Carbon Emissions? at VisualCapitalist
Individual evidence
- ↑ a b Paul Griffin, Richard Heede, Ian van der Vlugt: The Carbon Majors Database Methodology Report 2017 . ( cdp.net [PDF; 585 kB ]).
- ↑ a b CDP Carbon Majors Report 2017. Carbon Disclosure Project, accessed on May 15, 2020 .
- ^ Matthew Taylor, Jonathan Watts: Revealed: the 20 firms behind a third of all carbon emissions . In: The Guardian . October 9, 2019, ISSN 0261-3077 ( theguardian.com [accessed May 15, 2020]).
- ↑ Top Twenty Rank 1965-2017. Retrieved May 15, 2020 .