Enzyme-linked Immunosorbent Assay
Enzyme-linked immunosorbent assay (ELISA) is an antibody-based detection method ( assay ). Like the radioimmunoassay (RIA), the ELISA also belongs to the group of immunassay methods, but is not based on a radioactivity measurement but on an enzymatic color reaction and thus belongs to the enzymatic immunoadsorption methods (EIA). The antigen to be detected was originally bound adsorptively to a microtiter plate via a first antibody and enriched; an enzyme-coupled second antibody (synonym: detection antibody ) led to the reaction of a dye substrate .
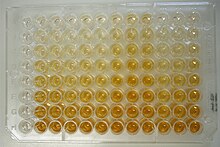
With the help of the ELISA, proteins (e.g. antibodies ) and viruses , but also low molecular weight compounds such as hormones , toxins and pesticides can be detected in a sample ( blood serum , milk , urine etc.). Here one makes use of the property of specific antibodies that bind to the substance to be detected ( antigen ). An antibody is previously marked with an enzyme. The reaction catalyzed by the reporter enzyme serves as evidence of the presence of the antigen. The so-called substrate is converted by the enzyme, the reaction product can usually be detected by a color change, possibly also by chemiluminescence . The signal strength is a function of the antigen concentration that can be precisely determined with a photometer, so that ELISA carried out as multiple measurements can also be used for quantitative evidence. As a reporter enzymes which are usually horseradish peroxidase (HRP, from the English. Horseradish peroxidase ), the alkaline phosphatase (AP), or more rarely, the glucose oxidase (GOD) is used. In the case of alkaline phosphatase, the dye substrate (synonym: chromogen) z. B. p -nitrophenyl phosphate (pNPP) is added, while o -phenylenediamine (oPD) is mostly used in peroxidase . The alkaline phosphatase splits off the phosphate residue from the colorless nitrophenyl phosphate and p -nitrophenol is formed , which is pale yellow. The change in concentration of the dye produced by the enzymatic reaction can be followed with a photometer according to Lambert-Beer’s law . The intensity of the color increases with the concentration of the nitrophenol formed and thus also the concentration of the antigen to be determined in the sample in comparison with a dilution series with known concentrations ( standard series ).
history
The forerunner of the ELISA since 1960 was the radioimmunoassay. For enzymatic detection, the direct coupling of proteins was necessary so that the reporter signal only appears coupled with the specifically binding antibody. The chemical coupling of proteins was developed simultaneously by Stratis Avrameas and GB Pierce. The adsorption of proteins on surfaces had already been investigated by Jerker Porath in 1966. The ELISA was developed simultaneously in 1971 by two working groups, including Peter Perlmann and Eva Engvall in Sweden.
Signal amplification
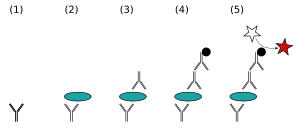
Instead of an enzyme-coupled detection antibody can, for signal amplification, the combination of an uncoupled detection antibody and an additional (third) secondary antibody ( secondarily because it is an antibody against antibodies, engl. Secondary antibody ) was bound to an enzyme used (see fig.). This requires an additional incubation and washing step. TBS-T buffer is mostly used as the buffer . Although more complex, the use of a secondary antibody conjugate has the advantage that the costly production of many different enzyme-coupled primary antibodies that are only specific for one antigen at a time can be avoided. The secondary enzyme-coupled antibodies used, which as polyclonal antibodies can bind simultaneously to different epitopes in the constant region (Fc region) of all primary antibodies of a species , can be used more widely and lead to signal amplification. In addition, due to the specificity for Fc regions of an antibody subtype from one species, secondary antibody-enzyme conjugates can be used for a variety of different immunassays, so that the secondary antibody is a more cost-effective, industrial, mass-produced product. A further, frequent signal amplification can take place through the binding of streptavidin or avidin conjugates to biotinylated detection antibodies in the last incubation step. Detection with (strept) avidin-enzyme conjugates also leads to signal amplification due to multiple biotinylations of the primary antibodies and the resulting binding of multiple reporter molecules.
By using fluorescence or the polymerase chain reaction, modern reporter systems sometimes allow higher sensitivities (e.g. immuno-PCR ) or parallel determinations in one approach ( multiplex ), but are not ELISAs in the strict sense.
Antibody ELISA
In this enzyme-linked immune adsorption test (EIA), the antigen is adsorbed directly and without a coating antibody on the polystyrene surface of a microtiter plate , whereby antibody concentrations can subsequently be measured in comparison to a standard series.
Sandwich ELISA

One of the ELISA techniques ( sandwich ELISA or also antigen ELISA ) uses two antibodies (Ab), both of which bind specifically to the antigen to be detected . It is important here that both antibodies bind to the antigen at different points ( epitopes ), otherwise they would interfere with one another. The first antibody ( coat antibody or capture antibody ) is bound to a solid phase (usually microtiter plates with 96 wells called wells). The sample with the antigen to be detected is then placed in the wells and incubated for a while . During this time, the antibody bound to the plate binds the antigen present in the sample. After the incubation phase has ended, the plate is washed: the unbound components of the sample are removed and only the antigen bound to the coat antibody remains . A second primary, unlabeled detection antibody is added to complete the sandwich. The excess detection antibody is washed out by washing the plate again. The result can be quantified by adding a labeled secondary antibody that binds to the second primary antibody and catalyzes the enzymatic color reaction. For quantitative detection, a series with known antigen concentrations ( standard series ) is usually carried out in order to obtain a calibration curve for the measured signal ( optical absorbance , emitted intensity).
Competitive immunassay
However, the competitive immunassay (enzyme-linked immunosorbent test, EIA) is also often used. No second, labeled antibody is used here for detection, but a labeled competitor antigen (a synthetic compound that is structurally similar to the analyte and also binds to the antibody). This leads to competition (competition) between analyte and competitor for a binding site on the antibody. The signal behaves inversely to the analyte concentration: little analyte = almost all antibody binding sites are occupied by the marked competitor = strong color reaction; a lot of analyte = weak color reaction. The detection systems used (enzymes / substrates) are mostly the same as in the ELISA.
Evaluation of the ELISA using the logit log plot
A sigmoid curve appears when the logarithm of the concentration is plotted on the x-axis and the extinction (= OD = optical density = absorption) on the y-axis. This form of representation is the semi-logarithmic diagram.
In order to be able to calculate a linear regression , these sigmoids have to be linearized beforehand. For this purpose the dimension of the x-axis is retained and the y-axis is converted into logit values. A straight line should be created. This form of representation is called log-logit-plot, logit-log-plot or also logit-plot.
In order to be able to calculate logit values from the absorbance values, one must first normalize the absorbance values (w) (n) so that they cover a range from 0 to 1. For this you need the lower (u) and the upper (o) asymptote of the sigmoid curve.
Inverse function:
These normalized absorbance values (n) are then included in the logit equation (L):
Inverse function:
The value pairs of the logit log plot from the x-value (= natural logarithm of the concentration) and the y-value (logit of the normalized extinction values (L)) are then included in the calculation of the linear regression. This then provides the height (a) and the slope (b) of the straight line equation :
Inverse function:
For the interpolation of unknown measured values on the calibration curve created in this way, often incorrectly referred to as the calibration curve , the inverse functions are then required. The highest precision is achieved in the vicinity of the turning point in the middle of the sigmoids , because this is where their slope is greatest. The least accuracy arises near their asymptotes.
If a measurement curve can be calculated from several different measurement values with the aid of the asymptotes of the calibration curve, then it is most accurate to compare the inflection point concentration of the calibration curve with the inflection point dilution of the measurement curve. The asymptotes of the measurement curves are ignored because all measurement results have to be related to the turning point of the calibration curve, which can be found with the y-values n = 0.5 in the semi-logarithmic diagram, identical to L = 0 in the logit log plot. In the semi-logarithmic representation of the measurement curve, the natural logarithm of the reciprocal value of the dilution serves as the x-axis, because the concentration of the measured values is still unknown before the calculation.
In principle, it is also possible to use decadic logarithms or those with a base of 2 instead of the natural logarithms ln . Instead of the reciprocal value of the dilution, only the dilution itself can be used. It is also permissible to calculate the value of n as going from 0 to 100 percent , provided that the equations are modified correctly. However, it would not be correct to calculate the logit directly from the non-normalized absorbance values w.
literature
- Goldsby RA, Kindt TJ, Osborne BA, Kuby J.: Enzyme-Linked Immunosorbent Assay. In: Immunology. 5th edition. WH Freeman, New York 2003, ISBN 0-7167-4947-5 , pp. 148-150.
See also
Web links
Individual evidence
- ↑ R. Yalow, S. Berson: Immunoassay of endogenous plasma insulin in man . In: J. Clin. Invest. . 39, No. 7, 1960, pp. 1157-1175. doi : 10.1172 / JCI104130 . PMID 13846364 . PMC 441860 (free full text).
- ↑ R. Lequin: Enzyme immunoassay (EIA) / enzyme-linked immunosorbent assay (ELISA) . In: Clin. Chem. . 51, No. 12, 2005, pp. 2415-2418. doi : 10.1373 / clinchem.2005.051532 . PMID 16179424 .
- ↑ L. Wide, Jerker Porath : Radioimmunoassay of proteins with the use of Sephadex-coupled antibodies. In: Biochim Biophys Acta (1966) 30: 257-260.
- ↑ E. Engvall, P. Perlman: Enzyme-linked immunosorbent assay (ELISA). Quantitative assay of immunoglobulin G . In: Immunochemistry . 8, No. 9, 1971, pp. 871-874. doi : 10.1016 / 0019-2791 (71) 90454-X . PMID 5135623 .
- ↑ BK Van Weemen, AH Schuurs: Immunoassay using antigen-enzyme conjugates . In: FEBS Letters . 15, No. 3, 1971, pp. 232-236. doi : 10.1016 / 0014-5793 (71) 80319-8 . PMID 11945853 .
- Jump up ↑ S. Leng, J. McElhaney, J. Walston, D. Xie, N. Fedarko, G. Kuchel: Elisa and Multiplex Technologies for Cytokine Measurement in Inflammation and Aging Research . In: J Gerontol a Biol Sci Med Sci . 63, No. 8, October 2008, pp. 879-884. PMID 18772478 . PMC 2562869 (free full text).
- ↑ Enzyme-linked Immunosorbent Assay (ELISA) (Resources). Retrieved May 12, 2018 .


