House of Representatives (New Zealand)
| logo | Parliament building |
|---|---|

|

|
| Basic data | |
| Seat: |
Parliament House , Wellington |
| Legislative period : | 3 years |
| MPs: | 120 |
| Current legislative period | |
| Last choice: | 23 September 2017 |
| Chair: |
Speaker Trevor Mallard ( Labor ) |
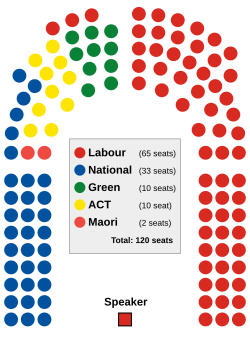
| Distribution of seats: |
Government (55)
|
| Website | |
| www.parliament.nz | |
| New Zealand House of Representatives | |
|---|---|
| Set up: | 1852 |
| Basis: | New Zealand Constitution Act 1852 |
The New Zealand House of Representatives (House of Representatives) is the only chamber of the legislature (legislative power) in New Zealand . The House, as the Chamber is often called, is part of the New Zealand Parliament , which is composed of the elected members of the New Zealand House of Representatives and the Head of State, the Queen of the United Kingdom , represented by the Governor General of New Zealand .
history
After New Zealand with the 1840 Treaty of Waitangi (the Treaty of Waitangi had become) British colony, gave the British government in 1852 to pressure from the colonialists after a suitable government in and let the British model with the New Zealand Constitution Act 1852 , the Westminster system , a Two-chamber system, install. The House of Representatives , in which the elected representatives of the colony sat, represented the lower house and the Legislative Council , in which people appointed by the governor sat, formed the upper house . This meant that no laws passed by the House of Representatives could gain legal force that were not approved by the Legislative Council and signed by the Governor. Furthermore, the Constitution Act regulated the establishment of six subordinate provinces with their own legislature and the establishment of so-called Native Districts for Māori , which were never implemented.
The first election to the House of Representatives took place in 1853. At that time only men who owned or leased land were eligible to vote. As a result, only a few Māori were able to take part in the election, but women did not have the right to vote at the time.
The first session of parliament took place in Auckland in 1854 , but it was not until 1856 that then Governor Thomas Gore Browne was ready to give up some of his power to the House of Representatives and the Legislative Council .
In 1865 the seat of parliament was moved to Wellington , in 1887 all Māori were allowed to vote and got four secure seats in the House of Representatives . In 1879 the right to vote was extended to all men and in 1893 women in New Zealand won the right to vote . This made New Zealand the first country in the world where women were allowed to vote.
At the beginning, the House of Representatives in Auckland had 37 seats to allocate, by 1860 it was 53 and after moving to Wellington the number of seats fluctuated between the years 1866 and 1899 between 70 and 95, by 1902 the size of the house was 80 Members was fixed. The number of seats remained constant until 1967, although the population had tripled in the same period. Of the 80 seats, 76 were for Europeans and 4 safe seats for Māori . In the following years, the number of members of the House was constantly adjusted upwards, until the number of seats in the House of Representatives was finally fixed at 120 for the General Election in 1996, with the exception that the mixed electoral system introduced in 1994 resulted in overhanging seats for a temporary increase who can provide parliamentary seats and thereby increase the number of seats in the House to over 120 for one legislative period .
In 1951 the Legislative Council was dissolved. This gave the House of Representatives full sovereignty over the country's legislative process .
Todays situation
The House of Representatives , based in Wellington , still has a minimum of 120 MPs. Since the introduction of the mixed-member proportional electoral system in 1993, direct mandates won that do not correspond to the proportion of votes of a party can result in overhang mandates, i.e. additional seats in the House of Representatives . This happened for the first time at the General Election in 2005 .
The seating arrangement in the House of Representatives is shaped like a horseshoe. The Speaker of the House , like a Speaker of Parliament, sits at the head end a little higher in front of the debate table and leads the respective meetings and debates. He represents the house and is also responsible for Parliament House and the Parliamentary Library . In the respective meetings of the house, the government parties and the opposition sit face to face.
In the last election to New Zealand's parliament in 2017 , the National Party won the most seats, but the government was able to provide the Labor Party , which formed a coalition with New Zealand First under the tolerance of the Green Party of Aotearoa New Zealand .
elections
Originally, the House of Representatives was elected by a pure majority vote. After a binding referendum in 1993, New Zealand's voting rights were converted to the mixed-member proportional voting system (MMP). Since then, the House of Representatives has been elected in a personalized proportional representation , similar to the German suffrage. In New Zealand, too, voters have two votes: the first vote is used to elect a party list and the second vote to elect a constituency member.
Election results since 2008
| Election results | |||||||||
|---|---|---|---|---|---|---|---|---|---|
| Political party | 2017 | 2014 | 2011 | 2008 | |||||
| Share of votes | Seats | Share of votes | Seats | Share of votes | Seats | Share of votes | Seats | ||
| National Party | 44.4% | 56 | 47.0% | 60 | 47.3% | 59 | 44.93% | 58 | |
| Labor Party | 36.9% | 46 | 25.1% | 32 | 27.5% | 34 | 33.99% | 43 | |
| New Zealand First | 7.2% | 9 | 8.6% | 11 | 6.6% | 8th | 4.07% | 0 | |
| Green party | 6.3% | 8th | 10.7% | 14th | 11.1% | 14th | 6.72% | 9 | |
| ACT New Zealand | 0.5% | 1 | 0.7% | 1 | 1.1% | 1 | 3.65% | 5 | |
| Māori party | 1.2% | - | 1.3% | 2 | 1.4% | 3 | 2.39% | 5 | |
| Mana | 0.1% | - | 1.3% | - | 1.1% | 1 | 3.0% | - | |
| United Future New Zealand | 0.1% | - | 0.2% | 1 | 0.6% | 1 | 0.87% | 1 | |
| Others | 3.3% | - | 0.8% | - | |||||
| Total seats: | 120 | 121 | 121 | 122 | |||||
literature
- Janine Hayward (Ed.): New Zealand Government and Politics . 6th edition. Oxford University Press , Melbourne 2015, ISBN 978-0-19-558525-4 (English).
Web links
- Evolution of Parliament - House of Representatives . New Zealand Parliament, July 25, 2006,accessed May 30, 2015.
- Photographer Brian Donovan : Panorama: Debating Chamber . (Flashplayer) In: New Zealand History . Ministry for Culture & Heritage , November 13, 2014, accessed on January 12, 2015 (English, interactive 360 ° panorama photo, (2004)).
Individual evidence
- ^ Office of the Speaker . New Zealand Parliament , accessed December 13, 2017 .
- ^ John E. Martin : 3.3 Parliament . In: New Zealand Government and Politics . 2015, p. 143 .
- ^ A b Janine Hayward : 3.2 The Constitution . In: New Zealand Government and Politics . 2015, p. 132 .
- ↑ a b c Quick History . New Zealand Parliament , July 19, 2006, accessed May 31, 2015 .
- ↑ a b c General Elections 1853-2014 - Dates and Turnout . Electoral Commission New Zealand , October 21, 2014, accessed May 31, 2015 .
- ^ Neill Atkinson : 1.2 New Zealand Politics 1935 to 1984 . In: New Zealand Government and Politics . 2015, p. 17 .
- ^ Neill Atkinson : 1.2 New Zealand Politics 1935 to 1984 . In: New Zealand Government and Politics . 2015, p. 16 .
- ^ The Role of the Speaker . New Zealand Parliament , July 19, 2006, accessed August 17, 2012 .
- ↑ 2017 General Election - Official Result . Electoral Commission New Zealand , October 21, 2017, accessed October 21, 2017 .
- ↑ 2014 General Election - Official Result - Overall Status . Electoral Commission New Zealand , October 10, 2014, accessed May 31, 2015 .
- ↑ 2011 General Election - Official Result - Overall Status . Electoral Commission New Zealand , December 17, 2011, accessed May 31, 2015 .
- ↑ 2008 General Election - Official Result - Overall Status . Electoral Commission New Zealand , November 22, 2018, accessed May 31, 2015 .


