Selenography

The selenography , dt. Also map the moon , is the moon corresponding analogue of Geography . The word is composed of the Greek terms for moon ( Σελήνη , Selene ) and drawing ( γραφειν , grafeïn , drawing, writing).
In contrast, the measurement of the moon and its gravitational field - analogous to geodesy - is called selenodesy .
Latitude and longitude
The mapping of lunar structures is mostly carried out in the coordinate system of selenographic latitudes and longitudes , which are defined analogously to the geographic latitude and longitude on Earth: The coordinate axis runs through the two rotational poles of the moon, around which the Earth's satellite rotates in 27.3 days and the Always facing the same side. The equatorial plane runs perpendicular to the axis of rotation through the lunar center , and the selenographic latitudes parallel to the lunar equator. They are circles that get smaller and smaller towards the poles. The meridians, great circles of the same selenographic length, run through both poles perpendicular to the equator. The prime meridian is based on the mean direction to earth. So we see the intersection of the lunar equator and prime meridian approximately in the middle of the moon in the Sinus Medii - apart from a few degrees of deviation, the so-called libration .
According to the astronautical orientation, east on the moon is the direction in which the sun rises for an observer on the moon (astronaut). As the moon waxes, the illuminated side gradually moves from right (east) to left (west) across the lunar disc.
- Note: On old maps, east and west orientations are reversed compared to today's maps, because the moon was previously observed with inverting telescopes and it was mapped according to the astronomical orientation (west and east direction in the sky).
For example, the 93 km long Copernicus crater is 9 ° 42 'north latitude and 20 ° 06' west longitude. For an observer in the northern hemisphere of the earth, it is “left above” the center of the moon.
The longitude at the day-night border (terminator), at which the sun is just rising on the moon, is called selenographic colongitude . It is counted as the angular distance from the prime meridian of the moon in a westerly direction up to 360 degrees - in contrast to the usual length specification, which counts from the prime meridian 180 degrees to the east and west. The Colongitude is zero (or 360 °) with a waxing crescent moon , 90 ° with a full moon (sunrise on the western edge of the moon). The colongitude of 180 ° corresponds to the waning crescent moon and 270 ° to the new moon. A related count is the age of the moon , the number of days since the new moon .
Height information
Indications of the absolute height of moon mountains are arbitrary, since a natural zero point corresponding to the sea level on earth does not exist in the case of the moon. Altitude information is therefore derived from a likewise arbitrarily set moon radius. After different determinations in earlier years, the height standard of the Clementine mission of 1,737.4 km is used today. This altitude standard is also the basis for the data supplied by the Lunar Orbiter Laser Altimeter (LOLA), the altitude measuring instrument on board the Lunar Reconnaissance Orbiter .
Lunar maps and atlases

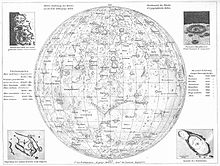
Classic moon maps can only be compared to a limited extent with maps of the earth. They show the earth's satellite from a great distance in the same perspective as one sees it from the earth in a telescope : as a gray-yellow protruding sphere with dark "seas" and bright crater surfaces . The areas at the edge of the moon appear greatly shortened because of the grazing line of sight in the radial direction. This projection is also called azimuthal orthographic projection . Because of the strong distortion at the edge, maps (of the earth) with this property are rare, but with lunar and planetary maps the viewer usually wants an impression similar to that on the telescope.
A lunar atlas is - comparable to an atlas for the earth - a systematically laid out cartographic documentation of the surface of the moon in book form. The drawings or photos are usually made for phases of the moon when the terminator is nearby. Then long shadows highlight the topography.
Newer, photographic moon maps are mostly "photo mosaics" made up of several photos. Lighting effects are softened with image processing and it is ensured that the direction of the shadow is the same for all relief structures. By using space probes, it is also possible to map the far side of the moon.
history
The first lunar sketch based on the use of a telescope was made by Galileo in 1610. Francesco Maria Grimaldi and Giovanni Riccioli then drew relatively accurate lunar maps in 1651. They contained numerous names of craters and other formations, which were largely adopted by later selenographers. Geminiano Montanari first used a micrometer to fine-tune lunar craters in 1662 . The older Giovanni Domenico Cassini also published a fairly accurate map of the moon in 1680 . The Italian optician Eustachio Divini (1610–1685) made another moon map in Rome.
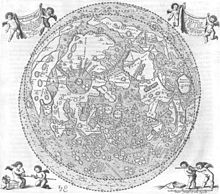
The detailed maps are mainly from Johannes Hevelius and Tobias Mayer (1723–1762). The latter's map appeared in 1775 with a 20.3 cm diameter and contained 24 precisely measured and 63 cartometric points. Later, a 35 cm map made from Mayer's detailed drawings was published. In 1784 Hieronymus Schroeter began to map the moon for his selenotopographical fragments , which appeared in Bremen and Göttingen in 1791 and 1802.
The first drawn lunar atlases date from the 18th century. Wilhelm Beer and Johann Heinrich Mädler published the first lunar atlas in 1837, which included the entire visible half of the moon ( Mappa Selenographica ). In 1876 Edmund Neville Nevill published an atlas ( The Moon, and the Condition and Configurations of Its Surface ). In 1878 Johann Friedrich Julius Schmidt published the most precise lunar map of the 19th century based on the work of geodesist Wilhelm Lohrmann ; it was 1.95 m in diameter and showed 33,000 craters ( map of the mountains of the moon ).
Philipp Fauth worked on a 3.5 m map on a scale of 1: 1 million from 1884 to 1940 and published parts of it in 1936.
Photographic mapping
Photographic mapping began to gain acceptance as early as 1880 and reached its first climax in the work of Loewy & Puiseux ( Paris Moon Atlas ) in 1894 . It comprised 24 pairs of large-format photographs - each in evening and morning light, to show the shadows cast by the craters in both directions. Later the Mount Wilson Observatory published an even more detailed atlas.
In 1960 Gerard Kuiper published a photographic lunar atlas in the USA for space travel purposes, which was compiled from 280 images from the Lick , McDonald and Yerkes observatories as well as Mount Wilson and Pic du Midi . While the first atlas of the back of the moon appeared in 1961 under the title Atlas of the other side of the moon , Kuiper's work was to be revised to a layer map on a scale of 1: 1 million (corresponding to 3.5 m in diameter), i.e. with the resolution of a few 100 Meter. Soon afterwards, however, mapping began using the five lunar probes of the Lunar Orbiter series from 1966 to 1968, which now also included the back of the moon. Further lunar orbiters in the following decades refined the lunar cartography even further, especially the Clementine and Lunar Prospector missions of the 1990s. Regionally one already knows details of the moon structures in the meter range.
Some examples of recent atlases are:
- John E. Westfall: Atlas of the lunar terminator. Cambridge Univ. Press, Cambridge 2001, ISBN 0-521-59002-7
- Siew Meng Chong et al .: Photographic atlas of the moon. Cambridge Univ. Press, Cambridge 2002, ISBN 0-521-81392-1
- Ben Bussey, Paul Spudis: The Clementine atlas of the moon. Cambridge Univ. Press, Cambridge 2003, ISBN 0-521-81528-2
- Antonín Rükl : Atlas of the moon. Sky Publ. Corp., Cambridge 2007, ISBN 1-931559-07-4
Systematic selenography
The existence of the first good fundamentals stimulated numerous astronomers since the 19th century to research changes on the moon. Until the 1960s, it was by no means clear whether active tectonics and volcanism still existed on the moon . Individual researchers were able to detect such changes on the telescope , but only on a small scale. They are called the Lunar Transient Phenomena . Around 1959, the Russian astronomer Nikolai Kozyrew reported about gas clouds in the Alphonsus crater , which he had classified as a possible volcanic object based on photographic samples. Further long series of observations were also made on other lunar craters .
Such analyzes are rarely successful photographically because the phenomena - which some astronomers doubt - can only be observed for a short time. As a basis for systematic studies of surface structures and their formation, atlases such as the Lunar Orbiters are indispensable.
See also
literature
- Ewen A. Whitaker: Mapping and naming the Moon - a history of lunar cartography and nomenclature. Cambridge Univ. Press, Cambridge 2000, ISBN 0-521-62248-4
- Peter van der Krogt: The «Plenilunium» of Michael Florent van Langren. The first moon card with name entries. In: Cartographica Helvetica Heft 11 (1995) pp. 44–49 full text
- Klaus Bartels : From the moon face to the moon map. In: Cartographica Helvetica Heft 5 (1992) pp. 11–16 ( full text , PDF; 10 MB)
- Josef Sadil: Focus on the moon , main chapter: "Selenography" , illustrated by Gerhard Pippig, Urania, Leipzig / Jena / Berlin 1962 (original title: Cíl měsíc , translated by Max A. Schönwälder), DNB 454251394 , OCLC 65043150 .
Web links
- Lunar and Planetary Institute
- Manfred Holl: History of the moon maps .
Atlases:
- Mondatlas.de
- Digital Berlin moon atlas
- Interactive photographic moon map with data and texts on over 400 terrain formations
- Lunar coordinates
Individual evidence
- ^ LRO: Frequently Asked Questions About LOLA Data
- ↑ Barbara I. Tshisuaka: Eustachio Divini. In: Werner E. Gerabek , Bernhard D. Haage, Gundolf Keil , Wolfgang Wegner (eds.): Enzyklopädie Medizingeschichte . De Gruyter, Berlin 2005, ISBN 3-11-015714-4 , p. 316.
- ↑ The History of the Moon Map.
