
Map (cartography)

A map (from Greek χάρτης chártes , German 'sheet of the papyrus tree ' , paper made from it; from Egyptian garta) is a digital or analog medium for displaying the surface of the earth or other celestial bodies. It is a leveled, scaled-down and generalized image of the earth's surface or other celestial bodies provided with descriptions and symbols. In terms of map content, a distinction is made between two main groups of maps: topographic maps (maps, sea maps ...) and thematic maps . In terms of origin, a distinction is made between official and private cards.
In them are spatial objects, situations or processes to scale generalized and using a character graphic systems in their spatial relationships shown . In the broadest sense, a map illustrates abstract, spatial data and spatial relationships that are difficult to formulate with the aim of making them easily understandable for the viewer.
The main areas of a map are the earth and the continents. But other celestial bodies , the starry sky or fictional worlds can also be the subject of a map display. Cartography is the science and technology used to represent the earth's surface in topographic and thematic maps .
Traditionally, a card is printed on paper, their thematic layers (Engl. Layer ) as terrain, rivers, roads, forests, etc. in multi-color printing can be applied. Today the layers are no longer archived as printing foils, but are stored in a database (see geographic information system ). The map can then be presented on a screen and also more easily updated. A digital map also allows the inclusion of other media, for example visual and acoustic media, as well as interactive communication with the user.
The cartographic process
The card is the result of a complex workflow. At the beginning there is recorded or provided data with spatial reference, so-called basic data or geodata . They represent those to be represented
- Spatial phenomena such as terrain or terrain points, sea depths , coastlines, bodies of water , traffic routes, settlement areas
- or spatial properties (facts) such as soil types and land use, vegetation , amounts of precipitation and water levels , climate data, population density , local economic data, etc.
These primary data are recorded by surveying the earth's surface ( site plan , aerial photographs , etc.) or by special measurements, surveys or counts. This data material is converted into cartographic objects or displayable secondary data using graphic design and guidelines for generalization (legend for plan and map symbols, sample sheets, etc.), manually or with the help of data models and program systems , which in turn are converted into cartographic symbols ( signatures , Border lines, color codes , etc.) are transferred. In the representation level (paper, map, screen) these points , characters, lines and surfaces represent and illustrate the spatial phenomena to be depicted.
Card types
Maps can be classified according to different aspects, for example according to
Data storage and presentation
They allow a distinction between analog maps and digital maps. Analogue maps are kept as "classic maps" on an original character carrier (formerly stone or copper plate, later transparent character carrier) and usually printed on paper or another suitable character carrier. Digital maps are stored electronically on a data carrier in raster format or vector format and can be output in various forms using electronic devices, e.g. B. on a printing plate in the computer to plate process, on a screen or on the display of a navigation system or a mobile phone.
Scale ratio
Since maps are basically in a scale relation to the real world, maps can also be classified according to their map scale. One speaks of a large scale when the scale denominator is small, on the other hand of a small scale when the scale denominator is large. In the case of topographic maps, maps up to a scale of 1: 10,000 are referred to as large-scale or topographic basemaps , while those with a scale of 1: 25,000 to 1: 100,000 are referred to as medium-scale . Topographic maps with a scale of 1: 200,000 or smaller are called small-scale or topographic overview maps .
One speaks of maps whenever their scale forces a generalization . If phenomena in the real world can be represented in an almost non-generalized manner and then usually displayed on a large scale, one speaks of plans (site plan, development plan).
Subject
The main topic of the spatial phenomena to be represented is a common distinguishing feature for maps. As a first approximation, topographic maps have been distinguished from thematic maps . A more differentiated approach speaks of base maps instead of topographic maps and allows further distinctions to be made in thematic maps , e.g. B. in aviation maps , nautical maps , geoscientific maps, economic maps , political maps , historical (historical) maps . (The term historical map is ambiguous because it is also used colloquially for obsolete maps that are no longer up-to-date.)
Space or area
The display space of a map is another distinguishing criterion. So there are z. B. world maps , maps of Europe, maps of Germany, country maps, city maps (usually called city maps ) as well as sky maps, moon maps, Mars maps, etc.
Panorama maps that show a winter or summer panorama of an area are particularly aesthetic. In the first case they are mostly used for the three-dimensional representation of ski runs, in the second of hiking trails. Heinrich C. Berann achieved world fame as a special representative of this map art , who combined modern cartography with classical painting.
Degree of topicality
Depending on the degree of correspondence between the map content and the real world, a distinction can be made between current maps and obsolete maps ( old maps ). The term historical map is reserved for the historical map and should not be used for old maps.
User groups or areas of application
They allow a distinction between cards, e.g. B. in car (driver) maps, bike (driver) maps, hiking maps, inland navigation maps, school maps, etc. This category also includes maps for the blind , which are designed as tactile maps.
Editor of the card
According to the issuer of a map, a distinction is made between official maps and maps of commercial publishing cartography. Official cards are issued by a public institution in public service. They serve public services and security and are often based on a law or regulation. Maps issued by the publisher's cartography are intended for the market and are aimed at consumers (in the tourism, leisure and hiking maps sector, this distinction does not always apply, as many state surveying authorities also issue maps intended for the market). There are also a large number of special scientific cards that are produced by universities and other scientific institutions as part of research and are usually made available to a limited group of users.
- Different types of cards
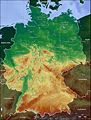
topographic map (physical map) of Germany

Overview map of the greater natural areas of Germany . A physical card is underlaid.
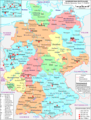
political map of Germany

geological map of Germany
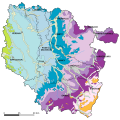
thematic map on the subject of geology

thematic map of knowledge of the German language in Europe
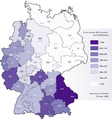
thematic map of the Roman Catholic population in dioceses of Germany

Berlin outer ring of the railway as a topogram (greatly simplified representation such as the route network map )

Mental map from a Berlin perspective

Panorama of Yellowstone as seen from the north.

Island map of Berlin: Berlin is shown without surroundings.

Frame map of Berlin: Berlin is shown with its surroundings.


_-_de_-_colored.svg)

Structure of a map
A card that is printed or presented on a screen is made up of several elements that are naturally different for both card types.
Printed card
While the digital map is basically saved without cut sheets and displayed on the screen without cutting sheets by “scrolling”, the printed map is always a limited map sheet. In order to cover a larger area, such as an entire country, several map sheets are produced that either have a sheet cut such that they fit together seamlessly or that overlap at the edges. Several map sheets, which have the same geodetic basis, the same projection, the same scale, the same sheet section and the same signature and design system, form a map series . Official topographic maps thus form the national map series.
A printed card usually consists of the card field, the card frame and the card edge.
Card field
In the map field (also map image, map area, sheet area) the actual map, the map content, is displayed. This is specified in a drawing specification, a sample sheet or a signature catalog. Excerpts from this can be found in the legend (explanation of symbols), which is usually located in the edge of the page, sometimes in a blank space on the map.
Many maps of the Middle Ages are divided up, the map field has the shape of a wheel ( Radkarte ; "TO card"), a heart (Oronce Fine, Paris 1536) or a clover (world map by Heinrich Bünting 1581).
Card frame
The map frame limits the square, rectangular or trapezoidal section of the map, depending on the type of illustration. In particular, it contains the numbering of the coordinate system on which the map is based, but also information on the continuation of the signatures cut off by the page cut.
Card edge
The edge of the map is used to hold map-related, editorial, copyright and sales-related explanations as well as information about the publisher. Here you can find the name or designation of the map, the map series and the map sheet. The scale ratio ("scale") is indicated numerically (e.g. 1: 25,000), often also graphically with the help of a scale bar. The most important map symbols are compiled in a user-friendly way in the legend (explanation of symbols). Furthermore, the name of the publisher, information on the edition number and year of publication (e.g. 6th edition 1996), the current status as well as copyright notices and the international standard book number (ISBN) can be placed in the edge of the card.
Prefabricated maps, especially those issued by commercial publishing house cartography, usually have a map envelope provided with an attractive title, which can then also fulfill the functions of the map edge.
Leaf cut
If a larger area is to be mapped that does not fit on one map sheet, it is divided into several sheets. A regular grid is often used for this. This can coincide with the grid of the geographical coordinates or the coordinate system of the map image in the plane. It is called a leaf cut .
If the sheet section coincides with integer meridians and circles of latitude , one also speaks of degree division maps .
Screen map
The map shown on the screen (display) is the presentation of a digital map stored on a storage medium (CD, DVD, hard disk) or downloaded from the Internet. Their structure is usually not recognizable in the map itself, but rather hidden in the software and the map data.
An essential feature of the screen map is that it usually allows actions by the user or dialogues and interactions with him, e.g. B. Enlarging or reducing the map image, changing the scale, displaying and hiding map topics, distance measurements, profile sections, positioning your own map characters, queries. This is usually done using the control elements of a graphical user interface .
history


For a long time after the invention of copper engraving , this technique was the only way to print maps. This development was decisively shaped by Matthäus Merian . The situation changed with lithography , which also made color prints possible. The first systematic land surveys were made in Germany from the middle of the 19th century . The Prussian General Staff Map was an important basis . The copper engraving was still used for the map of the German Empire in 1909. Color prints were associated with significantly higher costs until the 20th century. Since the 1970s, the storage of card information on electronic data carriers has increased.
Famous cards include:
- Geographike Hyphegesis - first world map with a coordinate system, around 150 AD
- Tabula Peutingeriana (approx. 375; part of the World Document Heritage )
- Ebstorf world map (around 1300)
- World map by Andreas Walsperger (around 1448/9)
- Waldseemüller map (1507; part of the world document heritage)
- Map of the Piri Reis (1513)
Card making
Historical proceedings
The first cards were scratched into clay tablets or animal bones. Later they could be drawn on papyrus or parchment, but duplicating them was tedious work. It was only with the invention of printing technology in the 15th century that larger quantities could be produced. Depending on the technology, a template was created from the card, which was then duplicated in the printing process. Improved processes made it possible to incorporate ever finer elements into the map and also to use multi-color printing.
Woodcut

The woodcut , still often used at the beginning of cartography, has been almost completely displaced. Woodcut and copperplate engraving go back to the last quarter of the 15th century.
Copper engraving

The engraving provides the best cards in terms of sharpness and depth of the stroke as well as softness and delicacy of execution; supported by galvanically generated auxiliary plates, also in any quantity. Corrections are not difficult to make, especially on the plateaus, but they require time and money. At the beginning of the 17th century, copper engraving revolutionized page design in the history of letterpress printing, as gravure printing replaced the woodcut for illustrations . Copperplate prints and etchings made it possible to print more precise images and higher editions, including vedute, artistic prints, leaflets and military maps.
Steel engraving
The steel engraving , introduced about 1820, is suitable for very large runs from the mother plate, is but was developed for engraving in connection with electroforming, hardly used because of the difficulty of the plate corrections.
lithography
The lithograph (stone printing ) dates from the beginning of the 19th century. In connection with stone printing, it allows inexpensive production in color using a high-speed press.
In the 19th century, lithography in connection with the letterpress press achieved brilliant successes, with lithographically engraved cards for use in the letterpress press being converted into relief printing plates by overprinting on zinc (chemigraphy or zincography ). Color printing can also be used for this type of reproduction, but the method is only advantageous for very large print runs, since more extensive corrections always require the printing plates to be renewed.
Map prints of any kind can also be reproduced by the anastatic method, but it is seldom used now that photography has been used to achieve far more favorable technical results. Because with photolithography and heliography , original drawings can be transferred directly to stone or copper and also reduced or enlarged.
Typographic manufacturing
The typographic production (i.e. letterpress printing with movable type ) of maps has been tried several times (1478, 1777, 1839, 1862), but has been abandoned every time.
engraving
Up until the 1990s, the engraving utensils, the light table and the ink pen were used by cartographers . This enabled him to engrave and retouch the individual foils or glass plates that were needed to manufacture the printing plates.
Modern reproduction methods
Computer based manufacturing
technology
The advancing development of computer technology made it possible to switch from analog to digital map production around 1989.
The requirement was color graphics on the - initially still - tube screen with a surface that was as flat as possible and a high resolution, sufficiently high graphics performance of the computer, a scanner for reading in printed map graphics and the mouse as a two-dimensional pointing device, which was soon replaced by the graphics tablet . This A4 size device allows a printed map to be placed on it, a pen tip or a crosshair to be positioned on a point on this map and this point - or a traced line - to be transferred to the digital graphics by pressing or pressing a button.
In the beginning, graphics programs (e.g. FreeHand from Macromedia) were used to a large extent . In the course of development, special cartographic programs (e.g. OCAD or Themak from GraS) and complete solutions (e.g. LorikSoftware from Lorienne SA) came onto the market. Today most maps are produced with the help of geographic information systems (e.g. ArcGIS ) on the basis of geographic base data ( e.g. ATKIS ) and other geodata . The geodesy and remote sensing provide the data, which are then implemented by the cartographers in cards.
disadvantage
The computer-based production led to a loss of detail and a reduction in the map image. Lines given by nature, such as coastlines , appear to be schematic, contrary to the analogous production. With road maps , curvy routes and mountain passes are simplified and crudely displayed, even in precise scales , which makes orientation difficult. The general map , for which attention to detail is a main characteristic, suffered losses. Especially when it comes to the representation of the greatly simplified towns and cities, it no longer even reaches the quality of the 19th century . Main streets in cities are barely recognizable and the church towers are no longer shown as landmarks. The lettering, especially on mountains and mountain ranges, often looks clumsy and clumsy in contrast to the analogue representation.
In addition, the reliability of the cards has often decreased. Most of the time, only the map image was graphically reworked, without sufficient (local) geographical knowledge of the processor and a lack of on-site checks. The essential features of a landscape are often no longer recognized in today's map processing. The main summit of a mountain , for example, often no longer highlighted in the label or straight Roman roads are not shown as well.
All of this reduced the orientation , the overall picture and the ideal value of a map or an atlas .
- "The more recent editions contain considerably less detailed topographical information [...] From practical application in the field of biogeography, the numerous changes [...] must be assessed as predominantly negative [...] essential map content that is relevant for field work and the designation of the location get lost. The argument that the new display methods are easier to read can only apply to card users who are completely inexperienced - but not to experienced card readers. The amount of map content is sometimes drastically reduced: in the continuum between "as much as the scale allows" and "only as much as absolutely necessary" one moves in the direction from the former to the latter extreme. From a biographical point of view, initiatives should be taken to preserve or regain the unrestricted usability of the official topographical maps. "
Real 3D cards in lenticular technology
Lenticular technology is a method of multi-image visualization, also known as "wobble image" or " lenticular image ".
Real 3D maps can be produced with this technique. The viewer can recognize heights, slopes and relief forms. This is made possible through the use of so-called lenticular images and foils.
- Lenticular images consist of images that are based on a motif that was recorded from two different angles ( stereoscopic ). These images are broken down into fine strips and arranged alternately in parallel (interlacing) .
- Lenticular foils are transparent plastic foils, on the top of which there are tunnel-shaped microlenses running parallel and vertically (for 3D images). For a real 3D map in the format of 60 × 45 cm, a lenticular sheet with a lens density of 70 lenses per inch (= around 0.36 mm grid width) is used.
Images and film are glued or printed in such a way that both the image strips and the tunnel-shaped microlenses run vertically. This creates the "shaky image" effect and different images are perceived depending on the viewer's perspective. This enables three-dimensional vision. Additional stereoscopic viewing aids are therefore no longer necessary.
In order to reinforce the spatial impression, a relief hillshade and a factor for elevating the terrain are added to real 3D maps. The inscriptions “float” over the relief.
Lenticular representations can be presented in analog form as print products or digitally using autostereoscopic displays (so-called 3D monitors). In both cases, two-eyed vision is required, and the alignment of the west-east axis of the map approximately parallel to the line connecting both eyes.
Real 3D maps are also recommended for general school lessons, especially since they can serve the viewer the third dimension of the earth's surface as a virtual model without technical visual aid.
Card usage
Maps are used for spatial orientation and navigation on land, in the water and in the air. They are also used for planning . You can use them to measure or estimate distances, angles or areas. Can serve as a tool Compass , track splitter , Planimeter , curvimeter or ruler .
If the map is to be used for a precise comparison with nature or to determine one's own location , it must be oriented to the north before using it. This is usually done by comparing it with the last stretch of the path , according to the position of the sun or by aiming for one or two distant map points (mountain peaks, towns, road or rail lines).
- → For further methods and accuracies, see orientation (map) .
Every map of a larger area has certain distortions . Since it is a flat image of the curved surface of the earth, it cannot be true to area , true to length and true to angle at the same time - only a globe enables such a lifelike representation of the geometrical relationships, albeit necessarily on a very small scale. For all other applications, a suitable map network design (see list of map network designs ) must be used or the distortion must be taken into account mathematically or graphically .
Manipulation of cards
The map as a means of representation offers a wide range of possibilities for manipulation and even censorship with the aim of emphasizing, suppressing or deliberately misrepresenting certain aspects. Occasions can be:
- National security (protection of strategically important systems, e.g. military systems, transmitter systems, power plants; also railway systems, roads, industrial systems, fords, height information)
- Political propaganda (international border disputes, degradation of the political opponent by misrepresenting the size of the states, suggestive choice of map symbols and colors)
- Economic interests (e.g. one-sided presentation of certain transport connections)
A certain amount of skepticism is always warranted when looking at and using a map, especially when it is recognizably designed to pursue a specific purpose. These destinations can often be identified from the creator or publisher of a card. One of the most extensive map manipulations took place from the 1930s under Josef Stalin , who had all published maps falsified in his sphere of influence for political and military strategic reasons.
Others

- Only since modern times has there been a convention that - in the absence of any other information - a map is oriented to the north . Orientation in the original sense of the word was common up until the late Middle Ages, especially with nautical charts . H. the orientation to the east (to the Orient). There were also religious reasons for this, since Jerusalem, seen from the West , which was seen as the center of Christianity, lies in the east and should appear at the top of every map. One example of this is the Ebstorf world map .
- The representation of the continents in world maps is different in certain countries, so some countries in America or Asia put their continent in the center (see illustrations). It is about avoiding Eurocentrism . In the world maps used in Europe and Africa, it is common for Europe to be shown in the middle .
- If a country is not (as is often the case in reality) distributed over several non-bordering areas, a political map can be colored with four colors so that neighboring countries have different colors, see also four-color set .
- For special applications there are cards that take these requirements into account, e.g. B. Cycle touring maps, hiking maps, road maps , sea maps , electricity maps for ships and waterway maps with portages for paddlers .
- As copy protection - to make unauthorized copying verifiable - fictitious streets ( trap streets ) , freely created details, spelling mistakes or watermarks can be built into map images.
- For disinformation , for example to hide military facilities or state secrets, gross falsifications are also used, including distortion of an area with the aim of inconspicuously omitting what is to be hidden, misleading and making the map locally worthless for orientation.
- Special maps for orienteering show extremely detailed and large-scale mostly irregularly limited areas of usable terrain and in particular record the vegetation structure and insurmountable things such as fences and private land, as it is part of the sporting task, the fastest and easiest route through patches of meadow, forest and thicket of to find one to the next marker point.
See also
literature
- Peter Barber (ed.): The book of maps: Milestones of cartography from three millennia . Primus, Darmstadt 2006, ISBN 3-89678-299-1 .
- Jürgen Bollmann, Wolf Günther Koch (Ed.): Lexicon of cartography and geomatics . Spectrum Akademischer Verlag, Heidelberg 2001-2002, ISBN 3-8274-1055-X (Vol. 1), ISBN 3-8274-1056-8 (Vol. 2).
- Egon Breetz: Considerations on the epistemological position of the map from a pedagogical point of view. In: Vermessungstechnik, H. 5/1972, pp. 188-192.
- Egon Breetz: Design and use of geographic maps as main links of the school cartographic communication chain. Potsdam Research, Series C, Issue 64. Potsdam 1986.
- Christof Dipper , Ute Schneider (ed.): Map worlds: space and its representation in modern times . Primus, Darmstadt 2006, ISBN 3-89678-289-4 .
- Günter Hake, Dietmar Grünreich, Liqiu Meng: Cartography: Visualization of space-time information . 8th, completely revised and expanded edition. De Gruyter, Berlin 2002 (De Gruyter textbook) , ISBN 3-11-016404-3 .
- Simon Garfield: Maps !: a book about explorers, brilliant cartographers and mountains that never existed . Theiss, Darmstadt 2014, ISBN 3-8062-2847-7 .
- Mark Monmonier: One in a million. The cartographers' tricks and lies. Birkhäuser Verlag, Basel 1996, ISBN 3-7643-5391-0 .
- Gerald Sammet: The measured planet: picture atlas for the history of cartography . GEO, Hamburg 1990, ISBN 3-570-03471-2 .
- MF Buchroithner: Real three-dimensionality in cartography: yesterday, today and tomorrow. In: Kartographische Nachrichten Issue 5/2007, pp. 239–248.
- Dirk Wüstenberg: The case law on the copyright protection of city maps and maps . In: Kartographische Nachrichten Issue 3/2011, pp. 139–144.
- Michael Bischoff , Vera Lüpkes, Rolf Schönlau (eds.): Weltvermesser. The golden age of cartography (exhibition catalog / Weser Renaissance Museum Schloss Brake 2015). Sandstein, Dresden 2015, ISBN 3-95498-180-7 .
Web links
- Link catalog on the subject of maps and plans at curlie.org (formerly DMOZ )
- Examples of higher quality analogue versus digitally produced cards
Individual evidence
- ^ M. Heinisch, G. Dörhöfer, H. Röhm: Altlasten Handbuch des Landes Niedersachsen. Material volume: Geological exploration methods . Springer-Verlag, 1997, ISBN 978-3-642-64386-6 , p. 2 ( Google Books ).
- ^ M. Heinisch, G. Dörhöfer, H. Röhm: Altlasten Handbuch des Landes Niedersachsen. Material volume: Geological exploration methods . Springer-Verlag, 1997, ISBN 978-3-642-64386-6 , p. 3 ( Google Books ).
- ^ Rolf Jäger: The theodolite in class . Springer Fachmedien, Wiesbaden, ISBN 978-3-322-98118-9 , p. 6 ( Google Books ).
- ↑ Michael Micklei (project leader): DSV SkiAtlas - Alps . Mairs Geographischer Verlag, Kemnat 1975, ISBN 3-87504-011-2 .
- ↑ Günter Hake, Dietmar Grünreich, Liqiu Men: Cartography: visualization of spatial and temporal information . 8th edition. Walter de Gruyter, Berlin 2002, ISBN 3-11-016404-3 , p. 545 ( Google Books ).
- ↑ On the design of the measuring table sheets (topographic maps 1: 25,000 of the national survey in Germany) from a biogeographical point of view. Retrieved May 7, 2020 .
- ^ Frank Dickmann, Jürgen Dodt, Björn Schmidt: On the potential of lenticular technology in thematic cartography . In: Kartographische Nachrichten , 6/2009, p. 295.
- ↑ Egon Breetz: The systematic introduction of card reading in the lower level - an essential prerequisite for the effective organization of geography lessons . In: Wiss. Zt. D. PH Potsdam , 14, 1970, 4, pp. 773-781 (lens grid method).
- ↑ Egon Breetz: Anaglyphs to support spatial vision and map understanding in geography lessons . In: Zt. Fd Geography lesson. , 18, 1966, 11, pp. 413-424 (with picture and map supplement).
- ↑ Mark Monmonier: One in a Million: The Tricks And Lies Of The Cartographers . Birkhäuser Verlag, 1996, ISBN 978-3-7643-5391-9 .
- ↑ Dagmar Unverhau: Card falsification as a result of excessive secrecy? An approach to the subject of the State Security's influence on the card system in the GDR . LIT, 2002, ISBN 978-3-8258-5964-0 .
- ↑ planet-Secret and Fake Maps. planet-wissen.de