
Climate diagram

In the heading the place, its geographical coordinates and the height above sea level . Left the diagram. On the right is a table with the monthly mean values for T and N , including the annual values for T and N.
A climate diagram is a graphic representation of the climatic conditions at a certain location over the course of the year. From this, the long-term mean values of the temperature and precipitation conditions measured in climate stations over decades can be taken.
Creation of the measured values
The most frequently used hygrothermal (Greek hygros = water, humidity and Greek thermos = warm, warmth) climate diagrams take into account measured values for precipitation (N) and temperature (T). These are shown as 30-year mean values in accordance with the normal climate periods (definition of climate = period of 30 years). For the temperature, the daily mean temperatures are averaged for each month; the precipitation of a month is accumulated. These average values are recorded in the climate diagram.
The benefits of a climate chart
The climate diagram offers the possibility of making a quick, rough assessment of the regularly recurring local weather conditions with a brief observation . In hygrothermal diagrams, any aridity and / or humidity can be determined, which in turn allows conclusions to be drawn about dry seasons and vegetation conditions that determine the land use possible for humans . When planning a long-haul trip, a look at the climate diagrams of the travel destinations in question can be helpful.
Types of climate graphs
A distinction can be made between different types of climate diagrams: Walter / Lieth climate diagram, thermoisopleth diagram, climograms and diagrams that deviate slightly from the conventions of these types.
Walter / Lieth climate diagram (hygrothermal)
.png)
In the frequently used type according to Heinrich Walter and Helmut Lieth , the average monthly temperatures (T) are traditionally compared with the long-term mean value of the total monthly precipitation (N) over the course of the year (= hygrothermal). It is assumed that the evaporation depends on the air temperature , namely that at a monthly mean temperature of 10 ° C about 20 mm of precipitation evaporates, at 20 ° C about 40 mm, etc. This portion of the precipitation cannot seep away and is therefore available not available to the plant roots . Only when the precipitation value is higher than twice the temperature value does the area receive plant-available water for the natural vegetation and the agricultural areas.
The values are represented by a red curve for the temperature and either by a blue column or a blue curve for the precipitation . T is given in ° C and N in mm (corresponds to liters per square meter) in such a way that the scale values corresponding to each other with regard to evaporation lie on the same line. The months in which the precipitation curve is above the temperature curve are called humid (wet) months. However, if the temperature curve is above the precipitation curve, the months are arid (dry). Depending on the number of arid and humid months, one speaks of a humid climate , an arid climate or a semi-arid climate .
The scales for the units of T and N are in the ratio 1: 2 (i.e. 10 ° C is at the same height on the y-axis as 20 mm N). From 100 mm of precipitation, N is usually represented in such a way that the scale in this upper area is flattened to a fifth of the height (one step on the y-axis then corresponds to 100 mm N instead of 20 mm N before). This flattening can be seen in climate diagrams of places that are (at times) very humid, e.g. in constantly humid, tropical climates or seasonally humid monsoon climates with extremely high seasonal rainfall (see below). Due to the 1: 2 ratio in the temperature ranges up to +50 ° C (corresponds to N 100 mm), when looking at the diagram, statements about humidity or aridity can be made immediately, since humid months are defined in such a way that their potential evaporation through the precipitation is exceeded (i.e. that there is generally water left for plants). Aridity is sometimes made clear by highlighting the temperature curve when it exceeds the temperature curve, i.e. the integral between T and N (if there is no precipitation, the integral below the T curve; see figure below in yellow).
Interpretation and assignment of climate diagrams
If the temperature curve has a very high amplitude over the course of the seasons, the climate is continental . If the amplitude is low, a heat-balancing sea influence is effective ( sea climate ). If the temperature curve runs almost in a horizontal line, the climate station is in the tropics with a daytime climate . If the climate diagram shows both arid months and humid months with relatively high precipitation, the latter are either rainy seasons in the humid tropics or summer monsoon rains . In summer drought and winter rain, the climate station is located in a location with a Mediterranean climate or the subtropical winter rain climate on the west side . Using the temperature curves and precipitation values, each climate diagram can be assigned to a climate zone . It should be noted that due to the constant inclination of the earth's axis during summer, the northern hemisphere is winter on the southern hemisphere and vice versa ( seasons ).
criticism
The form of representation of the precipitation by means of columns has the advantages that, on the one hand, it illustrates the type of measurement of N using a water column and, on the other hand, it makes it clear that precipitation occurs in sudden events that are distributed differently than T. The disadvantage of displaying total monthly precipitation is the construction of the Gregorian calendar , in which months have different numbers of days. The comparability of the columns has to be put into perspective: the viewer of the diagram has to consider, for example, that with even rain, months with more days will have a correspondingly higher total amount of precipitation.
Thermoisopleth diagram (thermal)
The thermoisopleth diagram (gr. Thermos = heat; isopleths = lines of equal values) is based only on the averaged temperature values of a location. Precipitation is not shown here, but in addition to the course of the year, the course of the day temperature is also shown. This makes it possible to classify them according to the seasonal or time of day climate.
Note: In addition to thermoisopleths, there is another type of lines of the same temperature: the isotherms . However, only the lines in pV diagrams or weather maps are called isotherms , hence the different designation thermoisopleth .
Further
Other forms of representation of climatic conditions include, for example, the climogram , which graphically depicts the relationship between temperature and precipitation values over the course of the year using a function curve.
Some climate diagrams take into account the average amplitude in the daytime cycle, also called day-night amplitude, for the air temperature, and represent this with vertical bars for each month (see box plot ). The upper end of the bar corresponds to the mean daily maximum temperature (typically afternoon values, since solar radiation generally causes the air temperature near the ground to rise with a certain delay). The lower end of the bar corresponds to the mean daytime low temperature (typically early morning values just before sunrise, as the air cools down throughout the night). For better readability, these temperature values are often given in the diagram.
Overview
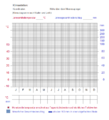
Copy template climate diagram according to Walter and Lieth

Walter / Lieth climate diagram of a desert climate

Walter / Lieth climate diagram of a tropical climate

Walter / Lieth climate diagram of a maritime climate

Walter / Lieth climate diagram of a humid continental climate
Walter / Lieth climate diagram of a monsoon-shaped climate

Thermoisopleth diagram (only shows the temperature comprehensively over the course of the day and year)

Template for copying thermoisoplet diagram

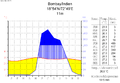
Climate diagram of a summer humid tropical climate (monsoon influence), with precipitation columns and temperature curve


Climate table
A climate table is an alternative graphical representation of the climate at a specific location. Example: Hamburg .
| Hamburg-Fuhlsbüttel 53 ° 33′N / 10 ° 0′E 11 m above sea level NHN | ||||||||||||||||||||||||||||||||||||||||||||||||
|---|---|---|---|---|---|---|---|---|---|---|---|---|---|---|---|---|---|---|---|---|---|---|---|---|---|---|---|---|---|---|---|---|---|---|---|---|---|---|---|---|---|---|---|---|---|---|---|---|
| Climate diagram | ||||||||||||||||||||||||||||||||||||||||||||||||
| ||||||||||||||||||||||||||||||||||||||||||||||||
|
Monthly average temperatures and precipitation for Hamburg-Fuhlsbüttel
53 ° 33′N / 10 ° 0′E 11 m above sea level. NHN
Source: DWD
|
|||||||||||||||||||||||||||||||||||||||||||||||||||||||||||||||||||||||||||||||||||||||||||||||||||||||||||||||||||||||||||||||||||||||||||||||||||||||||||||||||||||
literature
- Dieter Richter: Pocket Atlas Climate Stations . Höller and Zwick Verlag, Braunschweig 1983, ISBN 3-89057-001-1 .
- Heinrich Walter, Helmut Lieth: Climate diagram world atlas . Gustav Fischer Verlag, Jena 1967.
- Diercke World Atlas. Bildungshaus Schulbuchverlage Westermann 2015. ISBN 978-3-14-100800-5 .
Web links
- Climograph - a free generator for climate diagrams from PjotrC
- Climodata - a climate atlas by PjotrC
- ClimateCharts.net web application of the TU Dresden for the dynamic generation of Walter-Lieth climate diagrams (English)
- www.globalbioclimatics.org from Complutense University Madrid (Spain). Here you can find climate diagrams for approx. 3500 points on the globe and further information. (English)
- Climate diagrams of European cities with precipitation bars (suitable for school geography) - also for other continents can be found via the menu diagrams (Spanish)
- www.harz-seite.de Easily created climate diagrams for Germany, based on the freely accessible measurement data of the German Weather Service
Individual evidence
- ↑ Diercke World Atlas. Bildungshaus Schulbuchverlage Westermann 2015. ISBN 978-3-14-100800-5 . Pages 244 and 254–255.