
Metropolitan area of Rio de Janeiro
| Região Metropolitana do Rio de Janeiro "Grande Rio"
Metropolitan area of Rio de Janeiro
|
|||
|---|---|---|---|
.jpg) Satellite image 2011
|
|||
|
|||
| Coordinates | 23 ° 33 ′ S , 46 ° 38 ′ W | ||
 The area of the metropolitan area of Rio de Janeiro in the state of Rio de Janeiro The area of the metropolitan area of Rio de Janeiro in the state of Rio de Janeiro
|
|||
| founding | July 1, 1974 | ||
| Basic data | |||
| Country | Brazil | ||
| State | Rio de Janeiro | ||
| ISO 3166-2 | BR-RJ | ||
| structure | 22 cities | ||
| Residents | 11,945,976 (2010) | ||
| estimate | 13.005.430 (July 1, 2018) | ||
| economy | |||
| GDP | 4,139,300 thousand R $ 33,857 R $ per capita (2013) |
||
| HDI | 0.787 (2017) | ||

The greater metropolitan area of Rio de Janeiro , also known as Grande Rio , officially Portuguese Região Metropolitana do Rio de Janeiro (RMRJ), was created by Supplementary Law No. 20 of July 1, 1974 after the merger of the former states of Rio de Janeiro and Guanabara with the then the greater Fluminense and Grande Niterói areas . With 13,005,430 inhabitants in 2018, it is the second largest metropolitan area in Brazil after the metropolitan region of São Paulo , the third largest in South America and, according to the 2010 census, was already the twenty largest in the world.
Changes
The term “Grande Rio” refers to the expansion of the capital Rio de Janeiro into a metropolitan area with its neighboring communities, as a continuous urban area. The borders changed in later years to the exclusion of the municipalities of Petrópolis and São José do Vale do Rio Preto (1993), Itaguaí and Mangaratiba (July 2002) and Maricá (October 2001). Itaguaí and Maricá were re-inducted into Grand Rio in October 2009. In December 2013, the municipalities of Rio Bonito and Cachoeiras de Macacu were added due to their proximity to the Complexo Petroquímico do Rio de Janeiro (COMPERJ) in the north of Itaboraí . Petropolis was re-included in Grande Rio in 2018. With the inclusion, the number of municipalities rose to 22.
Population development
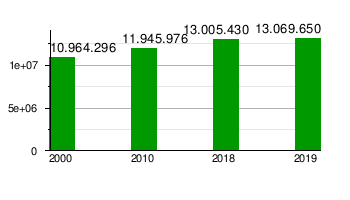
From 2000 to 2019, the population of the metropolitan region of Rio de Janeiro grew from around 11 to 13.07 million. A further increase in the number of inhabitants to 14.8 million is expected by 2035.
The following table shows the population of the metropolitan region from 2000 to 2019 according to the IBGE, 2018 and 2019 are estimates, the increase between July 1, 2018 and July 1, 2019 was 64,220 people.
economy
According to the IBGE, the metropolitan region of Rio de Janeiro (including the municipalities of Itaguaí, Mangaratiba and Maricá) is the second largest national economic and prosperity center with a gross domestic product (GDP) of R $ 413.93 billion . It concentrates 70% of the state's economic strength and a large part of all goods and services produced in the country. As the second largest industrial center in Brazil, it includes oil refineries, shipbuilding, metallurgy, petrochemical, gas chemistry, steel, textile, printing, publishing, pharmaceutical, beverage, cement and furniture industries. However, in the last few decades the economic profile has changed significantly, and it has increasingly assumed the character of a large national service and business center in general.
It brings together the main national and international groups in maritime transport and the largest shipyards in the country and state, which hold around 90% of the production of ships and offshore equipment in Brazil.
In the oil sector there are uniform agreements of more than 700 companies, including the largest in Brazil ( Petrobras , YPF , Royal Dutch Shell , Esso , Ipiranga , ChevronTexaco , El Paso ). Most have research centers scattered across the state and collectively produce more than 4/5 of the oil and fuel distributed at national gas stations.
City overview
| Munizip | Area (km²) | Population (2000 census) |
Population (2010 census) |
Estimate (July 1, 2018) |
Estimate (July 1, 2019) |
Density 2018 (/ km²) |
HDI (2010) |
since |
|---|---|---|---|---|---|---|---|---|
| Belford Roxo | 77.815 | 434.474 | 469.261 | 508.614 | 510.906 | 6,536.19 | 0.684 | Jan. 1, 1993 |
| Cachoeiras de Macacu | 953,801 | 48,543 | 54.273 | 58,560 | 58,937 | 61.40 | 0.752 | Dec. 27, 2013 |
| Duque de Caxias | 467.620 | 775.456 | 855.046 | 914,383 | 919,596 | 1,955.40 | 0.711 | Jul 1, 1974 |
| Guapimirim | 360.766 | 37,952 | 51,487 | 59,613 | 60,517 | 165.24 | 0.700 | Jan. 1, 1993 |
| Itaboraí | 430.374 | 187.479 | 218.090 | 238,695 | 240,592 | 554.62 | 0.700 | Jul 1, 1974 |
| Itaguaí | 274,433 | 82.003 | 109.091 | 125,913 | 133.019 | 458.81 | 0.715 | Jul 1, 1974 |
| Japeri | 81.869 | 83.278 | 95.391 | 103.960 | 104,768 | 1,269.83 | 0.659 | Jan. 1, 1993 |
| Magé | 388,496 | 205.830 | 228.150 | 243,657 | 245.071 | 627.18 | 0.709 | Jul 1, 1974 |
| Maricá | 362,571 | 76,737 | 12,761 | 157.789 | 161.207 | 435.19 | 0.765 | 2009 |
| Mesquita | 41,477 | without data | 168.403 | 175,620 | 176.103 | 4,234.15 | 0.737 | 2009 |
| Nilópolis | 19,393 | 153.712 | 157.483 | 162,269 | 162,485 | 8,367.40 | 0.753 | Jul 1, 1974 |
| Niterói | 133.916 | 459.451 | 487,327 | 511,786 | 513,584 | 3,821.69 | 0.837 | Jul 1, 1974 |
| Nova Iguaçu | 519.159 | 920,599 | 797.212 | 818.875 | 821.128 | 1,577.31 | 0.713 | Jul 1, 1974 |
| Paracambi | 179.772 | 40,475 | 47,124 | 51,815 | 52,257 | 288.23 | 0.720 | Jul 1, 1974 |
| Petrópolis | 791.144 | 286,537 | 295.917 | 305,687 | 306.191 | 386.39 | 0.745 | 2018 |
| Queimados | 75.695 | 121.993 | 137.938 | 149.265 | 150.319 | 1,971.93 | 0.680 | Jan. 1, 1993 |
| Rio Bonito | 465,455 | 49,691 | 55,551 | 59,814 | 60.201 | 128.51 | 0.772 | Dec. 27, 2013 |
| Rio de Janeiro | 1,199.828 | 5,857,904 | 6.323.037 | 6,688,927 | 6,718,903 | 5,574.90 | 0.799 | Jul 1, 1974 |
| São Gonçalo | 247,709 | 891.119 | 1,013,901 | 1,077,687 | 1,084,839 | 4,350.62 | 0.739 | Jul 1, 1974 |
| Sao João de Meriti | 35.216 | 449.476 | 459.356 | 471,888 | 472.406 | 13,399.82 | 0.719 | Jul 1, 1974 |
| Seropédica | 283.766 | 65,260 | 78.183 | 86,743 | 82,312 | 305.68 | 0.713 | Jan. 1, 1997 |
| Tanguá | 145.503 | 26,057 | 30,731 | 33,870 | 34,309 | 232.78 | 0.654 | Jan. 1, 1997 |
| Metropolitan area of Rio Janeiro | 6,744,634 | 10.670.040 | 12,603,936 | 13.005.430 | 13,069,650 | ⌀ 1,725.82 |
See also
Individual evidence
- ↑ a b IBGE : Estimativas da população residente no Brasil e unidades da federação com data de referência em 1 ° de julho de 2018. (PDF; 2.6 MB) In: ibge.gov.br. 2018, accessed on November 3, 2018 (Brazilian Portuguese, addition of the individual cities in the metropolitan area).
- ↑ a b RM - Rio de Janeiro , Atlas do Desenvolvimento Humano no Brasil. Retrieved September 23, 2019 (Brazilian Portuguese).
- ↑ Radar IDHM . Evolução do IDHM e de seus índices componentes no período de 2012 a 2017. IPEA, PNUD, FJP, Brasília 2019, ISBN 978-85-7811-350-6 , p. 39 (Brazilian Portuguese, org.br [PDF; accessed July 3, 2019]).
- ↑ LEI COMPLEMENTAR Nº 20, DE 1º DE JULHO DE 1974 Lei Complementar N ° 20, de 1 ° de Julho de 1974 - Dispõe sobre a criação de Estados e Territórios. In: gov.br. www.planalto.gov.br, accessed July 2, 2019 (Brazilian Portuguese).
- ↑ Instituto Brasileiro de Geografia e Estatística (IBGE): Census 2010 - Rio de Janeiro . Retrieved July 2, 2019.