
General election in Australia 2010

Ruling Party (72): Labor (72) Opposition Coalition (72) Liberal (44) LNP (21) National Party (6) Country Liberal Party (1) Other (6) Independent (4 ) Australian Greens (1) National Party of Western Australia (1)
The 2010 general election in Australia took place on August 21, 2010. It was the election to the 43rd Australian Parliament . From the two chambers of parliament , the House of Representatives (lower house) was fully elected and the Senate (upper house) partially re-elected.
This led to a hung parliament , i. H. to a stalemate between Labor and the opposition from the Liberal and National Party. After negotiations, a laboratory minority government was formed , which is dependent on the support of 4 MPs from other parties or from non-party members.
prehistory
From the parliamentary elections in Australia in 2007 , the Labor Party emerged victorious under its then top candidate Kevin Rudd . Rudd was elected prime minister. In the course of his tenure, however, there was a dramatic loss of popularity of the Labor government, so that in June 2010 there was an intra-party revolt by the opponents of Rudd in the right wing of Labor. Rudd was voted out of Labor's parliamentary group chairman and, after losing parliamentary support in this way, also renounced the candidacy for the office of prime minister. In his place - somewhat surprisingly for the public - his party colleague Julia Gillard , the previous Deputy Prime Minister and Minister for Education, Labor and Social Security was elected Prime Minister of Australia on June 24th. A few weeks after her election, the new Prime Minister announced on July 17 that parliamentary elections would be held on August 21 that year.
Candidates
Prime Minister Julia Gillard was the top candidate for the ruling Labor Party. The opposition's top candidate was Tony Abbott , leader of the Liberal Party . With the Liberal Party in an electoral alliance was the National Party under the leadership of Warren Truss . In the state of Queensland joined the Liberal National Party (Liberal National Party) , which was formed from a merger of the two bourgeois parties of 2008. The Australian Green Party also ran under Bob Brown . As a smaller party that received 2% of the vote and no seats in the last general election, the Family First Party was in the running. Ultimately, the main alternative for voters was between continuing the Labor one-party government and a coalition government made up of the Liberals and the National Party of Australia.

Julia Gillard ( ALP ), Prime Minister
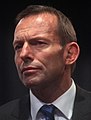
Tony Abbott ( LPA ), opposition candidate


Forecasts

Pre-election polls have shown a gradual decline in electoral favor since the last election in 2007. At the same time, the polls of the opposition coalition parties rose. The Greens persisted in the poll results by 10%.
Election campaign

The main topics of the election campaign were the economic situation , the question of securing Australia's borders against illegal immigration and the problem of global climate change . In her election campaign opening, Prime Minister Gillard spoke of "Australia's progress" ("moving forward") under her government and named a stronger economy, balanced budgets and a globally exemplary health and education system as goals. Opposition leader Abbott criticized the speech as in content, made over Gillard's constantly repeated moving-forward - Mantra funny and accused Labor of having not complied with the cast at the last election promises. He expects a filthy campaign from laboratories during the election campaign. The Green Party leader Senator Bob Brown accused both parties to indulge only in mutual insults and important issues such as a possible CO 2 -tax (carbon tax) to leave unmentioned. A marginal issue was the religious attitudes of the two leading candidates. Gillard is a declared atheist , but says she has respect for the church and for religious beliefs. Abbott is against devout Catholic, what some church leaders, as the Archbishop of Perth , Barry Hickey , led to statements professing Christians could be by the atheism of Prime Minister tempted not to vote Labor. As a result, the Prime Minister increasingly sought talks with church groups before the election.
Special features of the right to vote
14,088,260 Australians were eligible to vote. In Australia voting is compulsory . The total of 150 members of the House of Representatives were elected in just as many individual constituencies according to a right of priority (instant runoff voting) . The average constituency has 93,921 voters (minimum: 59,879 in the Solomon (NT) constituency, maximum: 124,215 in the Canberra constituency). According to the unequal population density, the constituencies are of extremely different sizes (see map above). The largest constituency of Durack in Western Australia is 1,587,758 km 2 more than four times the size of Germany, while the urban areas of Melbourne and Sydney each contain 20 constituencies. In the current election, 40 of the total of 76 members of the Australian Senate (the upper house) were newly elected. The election took place in a voting mode with transferable individual votes . Before the election, the constituency boundaries were partially redrawn by the Australian Electoral Commission due to the changed population situation.
Results
Won constituencies by state
The constituencies won are spread over the states or administrative units of New South Wales (NSW), Victoria (VIC), Queensland (QLD), Western Australia (WA), South Australia (SA), Tasmania (TAS), Australian Capital Territory (ACT ) and Northern Territory (NT) as follows:
| Political party | NSW | VIC | QLD | WA | SA | TAS | ACT | NT | Total (2010) | Total (2007) | |
|---|---|---|---|---|---|---|---|---|---|---|---|
| Australian Labor Party (ALP) | 26th | 22nd | 8th | 3 | 6th | 4th | 2 | 1 | 72 | 83 | |
| Liberal Party of Australia (LPA) | 16 | 12 | 0 | 11 | 5 | 0 | 0 | 0 | 44 | 55 | |
| Liberal National Party of Queensland (LNP) | 0 | 0 | 21st | 0 | 0 | 0 | 0 | 0 | 21st | 0 | |
| National Party of Australia (NPA) | 4th | 2 | 0 | 1 | 0 | 0 | 0 | 0 | 7th | 10 | |
| Australian Greens | 0 | 1 | 0 | 0 | 0 | 0 | 0 | 0 | 1 | 0 | |
| Independent | 2 | 0 | 1 | 0 | 0 | 1 | 0 | 0 | 4th | 2 | |
| Country Liberal Party (CLP) | 0 | 0 | 0 | 0 | 0 | 0 | 0 | 1 | 1 | 0 | |
| total | 48 | 37 | 30th | 15th | 11 | 5 | 2 | 2 | 150 | 150 |
House of Representatives

Governing Parties (72) Labor (72) Opposition Coalition (72) Liberal (44) LNP (21) National Party (6) Country Liberal Party (1) Other (6) Independent (4) Australian Greens (1) National Party of Western Australia (1)
| Political party | be right | Seats | ||||
|---|---|---|---|---|---|---|
| number | % | +/- | number | +/- | ||
| Australian Labor Party (ALP) | 4,711,363 | 37.99 | −5.40 | 72 | −11 | |
| Liberal Party of Australia (LPA) | 3,777,383 | 30.46 | −5.82 | 44 | −11 | |
| Australian Greens | 1,458,998 | 11.76 | +3.97 | 1 | +1 | |
| Liberal National Party of Queensland (LNP) | 1,130,525 | 9.12 | +9.12 | 21st | +21 | |
| National Party of Australia (NPA) | 462,387 | 3.73 | −1.76 | 7th | −3 | |
| Family First Party (FFP) | 279.330 | 2.25 | +0.26 | - | - | |
| Christian Democratic Party (CDP) | 83.009 | 0.67 | −0.17 | - | - | |
| Country Liberal Party (CLP) | 38,335 | 0.31 | −0.01 | 1 | +1 | |
| One Nation | 27.184 | 0.22 | −0.04 | - | - | |
| Liberal Democratic Party (LDP) | 24,262 | 0.20 | +0.06 | - | - | |
| Australian Democrats (AD) | 22,376 | 0.18 | −0.54 | - | - | |
| other parties | 74,715 | 0.59 | - | - | - | |
| independent candidates | 312,496 | 2.52 | +0.30 | 4th | +2 | |
| Two-party preferred vote | ||||||
| Australian Labor Party | 6.216.445 | 50.12 | −2.58 | 72 | −11 | |
| Liberal / National Coalition | 6,185,918 | 49.88 | −2.58 | 72 | +11 | |
| total | 12,402,363 | 100.00 | 150 | |||
| valid votes | 12,402,363 | 94.45 | ||||
| invalid votes | 729.304 | 5.55 | ||||
| Voter participation (compulsory elective) | 13,131,667 | 93.22 | ||||
| Eligible voters | 14,086,869 | 100.0 | ||||
| Source: Australian Electoral Commission | ||||||
senate
Forty of the state seats (6 per state, 36 in total) and territorial seats (2 per territory) were newly elected. The distribution of these newly elected seats is given in the column "Won seats". The column “Total seats” shows the number of mandates including the 36 seats that were not available for election.
There are separate elections for each individual state or territory. The following table shows the summarized results. However, because of the separate elections, the distribution of votes cannot be converted directly into the distribution of seats.

Government (31) Labor (31) Opposition Coalition (34) Liberals (24) LNP (6) National Party (3) Country Liberal Party (1) Other (11) Australian Greens (9 ) Democratic Labor Party (1) Independent (1)
| Political party | be right | Seats | |||||
|---|---|---|---|---|---|---|---|
| number | % | +/- | Won | total | +/- | ||
| Liberal / National Party / CLP (coalition) | 4,871,871 | 38.3 | −1.6 | 18th | 34 | −3 | |
| Australian Labor Party (ALP) | 4,469,734 | 35.1 | −5.2 | 15th | 31 | −1 | |
| Australian Greens | 1,667,315 | 13.1 | +4.1 | 6th | 9 | +4 | |
| Family First Party (FFP) | 267.493 | 2.1 | +0.5 | - | - | −1 | |
| Democratic Labor Party (DLP) | 134,987 | 1.1 | +0.1 | 1 | 1 | +1 | |
| Independent | 55,786 | 0.4 | −0.9 | - | 1 | - | |
| Others | 1,255,047 | 9.9 | +2.9 | - | - | - | |
| total | 12,722,233 | 100.00 | 40 | 76 | |||
| valid votes | 12,722,233 | 96.25 | |||||
| invalid votes | 495.160 | 3.75 | |||||
| Voter participation (compulsory elective) | 13.217.393 | 93.83 | |||||
| Eligible voters | 14,086,869 | 100.0 | |||||
| Source: Australian Electoral Commission | |||||||
After the election
Both Labor and the national liberal coalition had failed to achieve an absolute majority in the lower house, each with 72 seats, for which at least 76 seats are required. The decisive factor was the behavior of the six so-called cross-benchers, i.e. members of parliament who do not belong to either of the two major parties. Among them are four independents, a member of the National Party of Western Australia (who sits in the national party room, but not in the coalition room) and a member of the Greens. The Green MP Adam Bandt and a total of three of the independents (the former Green Andrew Wilkie and the two former National Liberals Rob Oakeshott and Tony Windsor) declared that they would support a minority government of Labor under certain conditions. Two independents, Bob Katter and National Party of Western Australia member Tony Crook, expressed their support for the coalition. Prime Minister Julia Gillard thus has a majority for her government in the lower house and exactly the minimum number required for an absolute majority (76:74 MPs). The 150th vote is that of the Speaker of Parliament, who only has the right to vote in the event of a tie. The Liberal Party did not stick to the agreement with the Labor Party , according to which the Speaker of Parliament generally has no right to vote. Without the right to vote for the President of Parliament, the majority would be 76:73 for the Labor government.
Individual evidence
- ↑ a b c d official result of the general election in Australia 2010 - Australian Electoral Commission (English)
- ^ Prime Minister wins power struggle, Zeit Online, news from September 7, 2010
- ↑ a b Battlelines Drawn for August 21 Poll, ABC , news from July 17, 2010.
- ^ Atheist Gillard says she respects church, The Sydney Morning Herald, July 29, 2010.
- ^ Gillard to talk to churches, The Sydney Morning Herald, Aug. 5, 2010.
- ↑ First Preference by Party Virtual Tally Room, ( Memento of the original from 23 August 2010 in the Internet Archive ) Info: The archive link was automatically inserted and not yet checked. Please check the original and archive link according to the instructions and then remove this notice. Australian Electoral Commission, accessed August 21, 2010.
- ↑ Demographic Classification of Divisions Current profile for the electoral division of Durack, ( Memento of the original dated August 23, 2010 in the Internet Archive ) Info: The archive link was inserted automatically and has not yet been checked. Please check the original and archive link according to the instructions and then remove this notice. Australian Electoral Commission
- ^ Current profile for the electrical division of Durack
- ↑ The Official 2010 Federal Election Results ( Memento of the original from January 15, 2016 in the Internet Archive ) Info: The archive link was inserted automatically and has not yet been checked. Please check the original and archive link according to the instructions and then remove this notice. , Australian Electoral Commission
- ↑ Number of higher preferences of the laboratory or coalition
- ^ Labor to form government, The Sydney Morning Herald, September 7, 2010.
- ↑ Labor clings to power, ABC News, September 7, 2010.
- ^ Katter in Coalition camp, ABC News, Sep. 7, 2010.
- ↑ Crook declares support for Abbott, ABC News, September 6, 2010.
Web links
- Australian Electoral Commission
- The Green Guide - Antony Green's Guide to the 2010 Federal Election (Australian Broadcasting Corporation)
1901 | 1903 | 1906 | 1910 | 1913 | 1914 | 1917 | 1919 | 1922 | 1925 | 1928 | 1929 | 1931 | 1934 | 1937 | 1940 | 1943 | 1946 | 1949 | 1951 | 1954 | 1955 | 1958 | 1961 | 1963 | 1966 | 1969 | 1972 | 1974 | 1975 | 1977 | 1980 | 1983 | 1984 | 1987 | 1990 | 1993 | 1996 | 1998 | 2001 | 2004 | 2007 | 2010 | 2013 | 2016 | 2019