
Maloja district
| Maloja Distretto di Maloggia district |
|
|---|---|
| Basic data | |
| Country: |
|
| Canton : |
|
| Main town : | Samedan |
| Area : | 973.61 km² |
| Residents: | 18,698 (December 31, 2015) |
| Population density : | 19 inhabitants per km² |
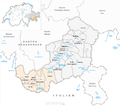
| map | |
 |
|
The Maloja district ( Rhaeto-Romanic , Italian Distretto di Maloggia ) was an administrative unit of the Swiss canton of Graubünden until December 31, 2015 . On January 1, 2016, it was replaced by the Maloja region .
Municipalities of the Maloja district
The following counties and communities belonged to the Maloja district:
As of December 31, 2015
| Bergell district | |||
|---|---|---|---|
| coat of arms | Name of the parish | Population (December 31, 2018) |
Area in km² |
| Bregaglia | 1544 | 251.45 | |
| Upper Engadin district | |||
|---|---|---|---|
| coat of arms | Name of the parish | Population (December 31, 2018) |
Area in km² |
| Bever | 616 | 45.75 | |
| Celerina / Schlarigna | 1502 | 24.02 | |
| La Punt-Chamues-ch | 686 | 63.27 | |
| Madulain | 210 | 16.28 | |
| Pontresina | 2162 | 118.19 | |
| St. Moritz | 4928 | 28.69 | |
| Samedan | 2924 | 113.80 | |
| S-chanf | 690 | 138.03 | |
| Sils in the Engadin / Segl | 700 | 63.57 | |
| Silvaplana | 1111 | 44.77 | |
| Zuoz | 1186 | 65.79 | |
Changes in the community

Municipalities until 1942

Municipalities until 1949

Municipalities until 1970
Municipalities until 2009


- 1943: Name change from Scanfs → S-chanf
- 1943: Name change from Madulein → Madulain
- 1943: Change of name from Ponte-Campovasto → La Punt-Chamues-ch
- 1943: Change of name from Bevers → Bever
- 1943: Name change from Celerina → Schlarigna / Celerina
- 1943: Name change from Samaden → Samedan
- 1943: Change of name from Sils im Engadin → Sils im Engadin / Segl
- 1950: Change of name from Schlarigna / Celerina → Celerina / Schlarigna
- 1971: Merger of Casaccia and Vicosoprano → Vicosoprano
- 2010: Fusion Bondo , Castasegna , Soglio , Stampa and Vicosoprano → Bregaglia
Development of the foreign resident population
In the case of the permanent resident population in the Maloja district (i.e. not counting those who are only registered as living in second homes), the following has been observed in terms of international migration in recent years: While in 2000 the number of those who moved internationally was about the same as the number of those internationally those who moved away, the number of international immigrants almost doubled in 2005 (from 366 to 736), while international immigrants only increased by 23% in the same period (from 348 to 451). In 2006, international immigration fell by 7% (from 736 to 686), while international immigration rose by 10% (from 415 to 497). Compared to the average of the districts of Switzerland, the total migration balance of the Maloja district (i.e. including intercantonal and intra-cantonal inflows and outflows of the permanent resident population) is 3 to 12 points higher or lower in each of the years between 2000 and 2006. In terms of the total migration movements of the permanent resident population, the Maloja district is largely untypical.
Web links
- Adolf Collenberg: Maloja. In: Historical Lexicon of Switzerland .
Individual evidence
Albula |
Bernina |
Hinterrhein |
Imboden |
Inn |
Landquart |
Maloja |
Moesa |
Plessur |
Prättigau-Davos |
Surselva
Former districts of the canton of Graubünden until December 31, 2000:
Glenner |
Heinzenberg |
Oberlandquart |
Unterlandquart |
Val Müstair |
Vorderrhein
Canton of Graubünden | Districts of Switzerland | Municipalities of the Canton of Graubünden