
Population development of Eschweiler

Population development and elections of Eschweiler
Table of population development


The following table provides an overview of the population development in the city of Eschweiler in North Rhine-Westphalia .
|
Population development |
|||||||
| year | population | ||||||
| 1533 | 850 | ||||||
| 1559 | 1,250 | ||||||
| 1642 | 3,600 | ||||||
| 1678 | cremation | ||||||
| 1680 | 2,000 | ||||||
| 1790 | 3,386 | ||||||
| 1800 | French Mairie u. Capital of the canton of Eschweiler | ||||||
| 1820 | 4,500 | ||||||
| 1822 | 5,100 | ||||||
| 1825 | 6,014 | ||||||
| 1850 | 8,226 | ||||||
| 1852 | 10,504 | ||||||
| 1855 | 13,987 | ||||||
| 1860 | 13,000 | ||||||
| 1880 | 15,610 | ||||||
| 1885 | 16,798 | ||||||
| 1900 | 21,668 | ||||||
| 1905 | 23,625 | ||||||
| 1909 | 25,619 | ||||||
| 1930 | 29,343 | ||||||
| 1932 | 34,505 | ||||||
| 1935 | 33,639 | ||||||
| 1946 | 30,265 | ||||||
| 1950 | 35,466 | ||||||
| 1955 | 38.202 | ||||||
| 1961 | 39,590 | ||||||
| 1970 | 38,660 | ||||||
| 1972 | 55,497 | ||||||
| 1987 | 53,058 | ||||||
| 1990 | 54,675 | ||||||
| 1994 | 55,791 | ||||||
| 2002 | 56,356 | ||||||
| 2003 | 55,629 | ||||||
| 2004 | 55,697 | ||||||
| 2012 | 54,775 | ||||||
| 2015 | 55.909 | ||||||
| 2017 | 58,366 | ||||||
Ein and Ausgemeindungen
- In the 16th century at the latest, the three clearing locations Bergrath , Röhe and Röthgen came to Eschweiler ( → Fig. 1 )
- In 1823 Eschweiler-Mühle was transferred to Stolberg
- In 1859, Hehlrath , Kinzweiler and St. Jöris were excluded ( → Fig. 2 )
- In 1932 Hastenrath , Nothberg , Scherpenseel and Volkenrath were incorporated
- In 1935, a southern train station, Eschweiler-Birkengang, Eschweiler-Donnerberg, Eschweiler-Duffenter, Eschweiler- Steinbachshochwald , Eschweiler-Steinfurt and Eschweiler- Velau, was added to Stolberg ( → Fig. 3 )
- In 1972 Dürwiß , Lohn (with Erberich , Laurenzberg and Pützlohn ) and Weisweiler (with Hüüllen and Wilhelmshöhe ) were incorporated and Kinzweiler (with Hehlrath and St. Jöris ) came back ( → Fig. 4 )
- In 2004 the southern part of the former Belgian Camp Astrid was sold to Stolberg
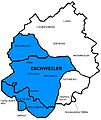
Urban area development
1800 to 1823

before 1932

1932 to 1935

1935 to 1972

1972


General plan of today's Eschweiler

Individual evidence
- ^ Federal Statistical Office (ed.): Historical municipality directory for the Federal Republic of Germany. Name, border and key number changes in municipalities, counties and administrative districts from May 27, 1970 to December 31, 1982 . W. Kohlhammer, Stuttgart / Mainz 1983, ISBN 3-17-003263-1 , p. 305 .
Existing city districts and city districts
1 Altstadt / Klee Oepe / Südstadt / West | 2 East / Vöckelsberg | 3 Röthgen | 4 Röhe | 5 St. Jöris | 6 Kinzweiler | 7 Hehlrath | 8 Dürwiss | 9 Neu-Lohn / Fronhoven | 10 Weisweiler / Hü Hügel / Wilhelmshöhe | 11 Nothberg | 12 Bergrath / Bohl / Volkenrath | 13 Hastenrath / Scherpenseel | 14 Stich / settlement Jägerspfad | 15 Pump / floodplain / forest school settlement
Former districts of
Erberich |
Langendorf |
Laurenzberg |
Wages |
Turk |
Pützlohn |
Velau