
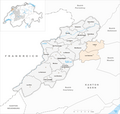
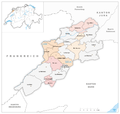
Franches-Montagnes (Borough)
| District of Freiberge (French: District des Franches-Montagnes ) |
|
|---|---|
 |
|
| Basic data | |
| Country: |
|
| Canton : |
|
| Main town : | Saignelégier |
| FSO number : | 2602 |
| Area : | 200.23 km² |
| Height range : | 443–1185 m above sea level M. |
| Residents: | 10,389 (December 31, 2018) |
| Population density : | 52 inhabitants per km² |
| map | |
 |
|

The district Freiberge ( French District des Franches-Montagnes ) is a district in the canton of Jura . It encompasses large parts of the Freiberg region and the southern section of the Clos du Doubs . The main town is Saignelégier .
On January 1, 2009, with the formation of the merged municipality of Clos du Doubs, the territory of the former municipalities of Epiquerez and Epauvillers was assigned to the Porrentruy district.
With 10,389 inhabitants (December 31, 2018), the district is one of the very small regions in Switzerland in terms of population (132nd out of 148). In terms of area he is in the middle of the field (66th place). The population density per square kilometer is very low.
In this article, comparable properties across all regions of Switzerland are divided into five empirical quantiles , each with a frequency of 20%. These key figures describe the collected data as a whole. They differentiate between very small / small / medium / large or very large and relate to the years 2014–2016.
population
The age structure of the permanent resident population on December 31, 2016 shows the large proportion of the somewhat older population compared to the younger generations.

The education of the residents is roughly measured at the highest level completed, starting with compulsory school. In the District des Franches-Montagnes, the permanent resident population aged 25 and over has a medium proportion of upper secondary level (48% to 51%) and a very small proportion of universities (<23%).
The language of the permanent resident population in private households is French. A second main language with a share of over 10% is not available, although the respondents were able to name up to three languages several times. 6% speak fluent German, French 92%, Italian 2%, Romansh 0%, English 2%. Other languages are represented with 8%, which is a very small proportion compared to Switzerland with 19.5%.
In the national statistics on living conditions according to type of resident , the apartments used are divided into paid tenancies (including cooperatives) and property (including other such as tenants or free company apartments by employers). The District des Franches-Montagnes has 42% rental apartments in 105th place out of 148, so it has few rental apartments. Across all districts with five quartiles , the thresholds are 40% / 45% / 51% / 58% with a maximum of around 90% and a minimum of around 23%.
The standardized employment rate is defined as the number of economically active persons measured against the permanent resident population aged 15 and over in private households. Switzerland has an employment rate of 66%, in the districts it is between 53% and 73%, the five quantiles have threshold values of 63.0% / 65.4% / 67.6% / 68.6%. The District des Franches-Montagnes has a low employment rate of 65.4% (63.0% to 65.4%).
Daily commuters (if you know your place of work and people who live in Switzerland) are on average frequent at 51%. Switzerland has between 38% and 60% work commuters, counted as commuters from the region including internal commuters. In terms of direction, the streams are mostly commuters.
Communities
The following municipalities belong to the district ( as of January 1, 2009 ):
| coat of arms | Name of the parish | German name | Population (December 31, 2018) |
Area in km² |
Inhabitant per km² |
|---|---|---|---|---|---|
|
|
La Chaux-des-Breuleux | 90 | 4.05 | 22nd | |
|
|
Lajoux (JU) | 673 | 12.39 | 54 | |
|
|
Le Bémont (JU) | 317 | 11.68 | 27 | |
|
|
Le Noirmont | Schwarzenberg | 1847 | 20.39 | 91 |
|
|
Les Bois | Rudisholz | 1241 | 24.71 | 50 |
|
|
Les Breuleux | Brandish wood | 1526 | 10.82 | 141 |
|
|
Les Enfers | 133 | 7.12 | 19th | |
|
|
Les Genevez (JU) | 502 | 13.63 | 37 | |
|
|
Montfaucon | Falkenberg | 603 | 18.25 | 33 |
|
|
Muriaux | Spiegelberg | 502 | 16.88 | 30th |
|
|
Saignelégier | Saint Leodegar | 2609 | 31.67 | 82 |
|
|
Saint-Brais | Saint Brix | 220 | 15.16 | 15th |
|
|
Soubey | 126 | 13.49 | 9 | |
| Total (13) | Freiberg district | 10,389 | 200.23 | 52 | |
Changes in the community
Municipalities until 1975
Municipalities until 2008


- 1976: District change of Lajoux and Les Genevez from the Moutier district → Franches-Montagnes district
- 1979: Change of canton from Canton Bern → Canton Jura
- 2009:
- Merger of Montfavergier and Montfaucon → Montfaucon
- Fusion Goumois , Les Pommerats and Saignelégier → Saignelégier
- Merger of Le Peuchapatte and Muriaux → Muriaux
- Merger of Epauvillers and Epiquerez → Clos du Doubs
Web links
- Claude Rebetez: Freiberge. In: Historical Lexicon of Switzerland .
Individual evidence
- ↑ Permanent and non-permanent resident population by year, canton, district, municipality, population type and gender (permanent resident population). In: bfs. admin.ch . Federal Statistical Office (FSO), August 31, 2019, accessed on December 22, 2019 .
- ↑ Permanent resident population by age, canton, district and municipality (31.12.2016), table su-d-01.02.03.06 of the Federal Statistical Office - STATPOP / Statistical Lexicon of Switzerland.
- ↑ Permanent resident population aged 25 and over according to the highest degree of education and district (2014–2016 cumulative), Table T40.02.15.08.05 of the Federal Statistical Office - SE / POP 2018.
- ↑ Permanent resident population by main language and district (2014-2016 cumulative), table T40.02.01.08.09 of the Federal Statistical Office - SE / POP 2018.
- ↑ Housing conditions by type of resident (2014-2016 cumulative), table T09.03.02.01.52 of the Federal Statistical Office - SE, GWS / POP 2018.
- ↑ Employment rate of the permanent resident population aged 15 and over by district (2014-2016 cumulative), Table T40.02.03.02.08 of the Federal Statistical Office - SE / POP 2018.
- ↑ Commuter balance of work commuters by district (2014-2016 cumulative), table T40.02.11.04.30 of the Federal Statistical Office - SE / POP 2018.
- ↑ Federal Statistical Office Generalized Limits 2020.