
List of United States urban areas: Difference between revisions
Chez Nation (talk | contribs) |
m Fix en wikitable style syntax, src: https://github.com/liruqi/wikipedia/blob/master/wikitable.py |
||
| Line 7: | Line 7: | ||
==2010 urban areas== |
==2010 urban areas== |
||
[[File:2010 US Census Urban Areas.svg|400px|none|Urban areas of the United States as defined by the United States Census Bureau using 2010 Census Data]] |
[[File:2010 US Census Urban Areas.svg|400px|none|Urban areas of the United States as defined by the United States Census Bureau using 2010 Census Data]] |
||
{| class="wikitable sortable" style="text-align:right |
{| class="wikitable sortable" style="text-align:right" |
||
| |
|||
|- style="text-align:center;" |
|- style="text-align:center;" |
||
|+ <big>Urban areas of the United States of America</big><ref>{{cite web |url=http://www2.census.gov/geo/docs/reference/ua/ua_list_all.txt |title=Census Urban Area List |publisher=[[United States Census Bureau]] |access-date=September 30, 2016}}</ref> |
|+ <big>Urban areas of the United States of America</big><ref>{{cite web |url=http://www2.census.gov/geo/docs/reference/ua/ua_list_all.txt |title=Census Urban Area List |publisher=[[United States Census Bureau]] |access-date=September 30, 2016}}</ref> |
||
| Line 6,033: | Line 6,034: | ||
== 2010 urban agglomerations == |
== 2010 urban agglomerations == |
||
{|class="wikitable sortable" |
{| class="wikitable sortable" style="text-align:right" |
||
|- style="text-align:center;" |
|- style="text-align:center;" |
||
|+<big>Urban agglomerations of the United States of America</big><ref>{{cite web |url=https://www2.census.gov/geo/pdfs/reference/fedreg/fedregv75n163.pdf |title=Proposed Urban Area Criteria for the 2010 Census |publisher=[[United States Census Bureau]] |access-date=October 28, 2020}}</ref> |
|+<big>Urban agglomerations of the United States of America</big><ref>{{cite web |url=https://www2.census.gov/geo/pdfs/reference/fedreg/fedregv75n163.pdf |title=Proposed Urban Area Criteria for the 2010 Census |publisher=[[United States Census Bureau]] |access-date=October 28, 2020}}</ref> |
||
Revision as of 22:20, 27 December 2022
| Population tables of U.S. cities |
|---|
 |
| Cities |
| Urban areas |
| Populous cities and metropolitan areas |
| Metropolitan areas |
| Megaregions |
|
This is a list of urban areas in the United States as defined by the United States Census Bureau, ordered according to their 2010 census populations. An urbanized area (UA) is an urban area with population of 50,000 or more; an urban cluster (UC) has population less than 50,000.[1] An urbanized area may serve as the core of a metropolitan statistical area, while an urban cluster may be the core of a micropolitan statistical area. The list includes urban areas with a population of at least 50,000.
For the 2010 census, the Census Bureau redefined the classification of urban areas to "a densely settled core of census tracts and/or census blocks that meet minimum population density requirements, along with adjacent territory containing non-residential urban land uses as well as territory with low population density included to link outlying densely settled territory with the densely settled core. To qualify as an urban area, the territory identified according to criteria must encompass at least 2,500 people, at least 1,500 of which reside outside institutional group quarters." These criteria result in several large urban agglomerations that encompass multiple urban areas from the 2000 census. The Census Bureau is currently considering whether to divide the larger agglomerations, but published potential agglomerations in August 2010.
2010 urban areas

| Rank | Name[Note 1] | Population (2010 Census) |
Land Area (km2) |
Land Area (sq mi) |
Density (Population / km2) |
Density (Population / sq mi) |
Central City Population (2010 Census) |
Central City Pop % of Urban Area |
Central City Land Area |
Central City Land Area % of Urban Area |
|---|---|---|---|---|---|---|---|---|---|---|
| 1 | New York–Newark, NY–NJ–CT | 18,351,295 | 8,936.0 | 3,450.2 | 2,053.6 | 5,318.9 | 8,175,133 | 44.5% | 302.643 | 8.8% |
| 2 | Los Angeles–Long Beach–Anaheim, CA | 12,150,996 | 5,907.8 | 1,736.0 | 2,383.9 | 6,999.4 | 3,792,621 | 31.2% | 468.67 | 27.0% |
| 3 | Chicago, IL–IN–WI | 8,608,208 | 6,326.7 | 2,442.8 | 1,360.6 | 3,524.0 | 2,695,598 | 31.3% | 227.635 | 9.3% |
| 4 | Miami, FL | 5,502,379 | 3,208.0 | 1,238.6 | 1,715.2 | 4,442.4 | 399,457 | 7.3% | 35.871 | 2.9% |
| 5 | Philadelphia, PA–NJ–DE–MD | 5,441,567 | 5,131.7 | 1,981.4 | 1,060.4 | 2,746.4 | 1,526,006 | 28% | 134.28 | 6.8% |
| 6 | Dallas–Fort Worth–Arlington, TX | 5,121,892 | 4,607.9 | 1,779.1 | 1,111.5 | 2,878.9 | 1,197,816 | 23.4% | 340.519 | 19.1% |
| 7 | Houston, TX | 4,944,332 | 4,299.4 | 1,660.0 | 1,150.0 | 2,978.5 | 2,099,451 | 42.5% | 599.589 | 36.1% |
| 8 | Washington, DC–VA–MD | 4,586,770 | 3,423.3 | 1,321.7 | 1,339.9 | 3,470.3 | 681,170 | 14.9% | 61.048 | 4.6% |
| 9 | Atlanta, GA | 4,515,419 | 6,851.4 | 2,645.4 | 659.0 | 1,706.9 | 420,003 | 9.3% | 133.152 | 5.0% |
| 10 | Boston, MA–NH–RI | 4,181,019 | 4,852.2 | 1,873.5 | 861.7 | 2,231.7 | 617,594 | 14.8% | 48.277 | 2.6% |
| 11 | Detroit, MI | 3,734,090 | 3,463.2 | 1,337.2 | 1,078.2 | 2,792.5 | 713,777 | 19.1% | 138.75 | 10.4% |
| 12 | Phoenix–Mesa, AZ | 3,629,114 | 2,969.6 | 1,146.6 | 1,222.1 | 3,165.2 | 1,445,632 | 39.8% | 516.704 | 45.1% |
| 13 | San Francisco–Oakland, CA | 3,281,212 | 2,096.9 | 523.6 | 2,358.6 | 6,266.6 | 805,235 | 24.5% | 46.873 | 8.9% |
| 14 | Seattle, WA | 3,059,393 | 2,616.7 | 1,010.3 | 1,169.2 | 3,028.2 | 608,660 | 19.9% | 83.943 | 8.3% |
| 15 | San Diego, CA | 2,956,746 | 1,896.9 | 732.4 | 1,558.7 | 4,037.0 | 1,307,402 | 44.2% | 325.188 | 44.4% |
| 16 | Minneapolis-St. Paul, MN-WI | 2,650,890 | 2,646.5 | 1,021.8 | 1,001.7 | 2,594.3 | 382,578 | 14.4% | 53.973 | 5.3% |
| 17 | Tampa–St. Petersburg, FL | 2,441,770 | 2,478.6 | 957.0 | 985.1 | 2,551.5 | 335,709 | 13.7% | 113.409 | 11.9% |
| 18 | Denver–Aurora–Lakewood, CO | 2,374,203 | 1,730.0 | 668.0 | 1,372.4 | 3,554.4 | 600,158 | 25.3% | 153 | 22.9% |
| 19 | Baltimore, MD | 2,203,663 | 1,857.1 | 717.0 | 1,186.6 | 3,073.3 | 620,961 | 28.2% | 80.944 | 11.3% |
| 20 | St. Louis, MO–IL | 2,150,706 | 2,392.2 | 923.6 | 899.0 | 2,328.5 | 319,294 | 14.8% | 61.909 | 6.7% |
| 21 | San Juan, PR | 2,148,346 | 2,244.7 | 866.7 | 957.1 | 2,478.8 | 395,326 | 18.4% | 39.5 | 4.6% |
| 22 | Riverside–San Bernardino, CA | 1,932,666 | 1,411.5 | 545.0 | 1,369.3 | 3,546.4 | 303,871 | 15.7% | 81.14 | 14.9% |
| 23 | Las Vegas–Henderson, NV | 1,886,011 | 1,079.6 | 416.8 | 1,746.9 | 4,524.5 | 583,756 | 31% | 135.815 | 32.6% |
| 24 | Portland, OR–WA | 1,849,898 | 1,358.1 | 524.4 | 1,362.1 | 3,527.8 | 583,776 | 31.6% | 133.427 | 25.4% |
| 25 | Cleveland, OH | 1,780,673 | 1,999.4 | 772.0 | 890.6 | 2,306.7 | 396,815 | 22.3% | 77.697 | 10.1% |
| 26 | San Antonio, TX | 1,758,210 | 1,546.5 | 597.1 | 1,136.9 | 2,944.6 | 1,327,407 | 75.5% | 460.933 | 77.2% |
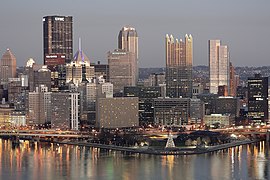
| 27 | Pittsburgh, PA | 1,733,853 | 2,344.4 | 905.2 | 739.6 | 1,915.5 | 305,704 | 17.6% | 55.367 | 6.1% |
| 28 | Sacramento, CA | 1,723,634 | 1,219.8 | 471.0 | 1,413.0 | 3,659.7 | 466,488 | 27.1% | 97.915 | 20.8% |
| 29 | San Jose, CA | 1,664,496 | 740.7 | 286.0 | 2,247.2 | 5,820.3 | 945,942 | 56.8% | 176.526 | 61.7% |
| 30 | Cincinnati, OH–KY–IN | 1,624,827 | 2,040.2 | 787.7 | 796.4 | 2,062.6 | 296,943 | 18.3% | 77.942 | 9.9% |
| 31 | Kansas City, MO–KS | 1,519,417 | 1,755.6 | 677.8 | 865.5 | 2,241.6 | 459,787 | 30.3% | 314.88 | 46.5% |
| 32 | Orlando, FL | 1,510,516 | 1,548.0 | 597.7 | 975.8 | 2,527.3 | 238,300 | 15.8% | 102.395 | 17.1% |
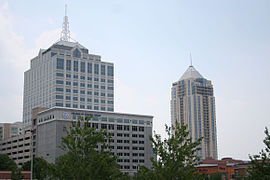
| 33 | Indianapolis, IN | 1,487,483 | 1,827.9 | 705.7 | 813.8 | 2,107.7 | 829,718 | 55.8% | 361.66 | 51.2% |
| 34 | Virginia Beach, VA | 1,439,666 | 1,335.0 | 515.5 | 1,078.4 | 2,793.0 | 437,994 | 30.4% | 249.016 | 48.3% |
| 35 | Milwaukee, WI | 1,376,476 | 1,413.2 | 545.6 | 974.0 | 2,522.8 | 594,833 | 43.2% | 96.122 | 17.6% |
| 36 | Columbus, OH | 1,368,035 | 1,322.1 | 510.5 | 1,034.7 | 2,680.0 | 787,033 | 57.5% | 217.169 | 42.5% |
| 37 | Austin, TX | 1,362,416 | 1,354.7 | 523.0 | 1,005.7 | 2,604.8 | 790,390 | 58% | 297.896 | 57.0% |
| 38 | Charlotte, NC–SC | 1,249,442 | 1,920.5 | 741.5 | 650.6 | 1,685.0 | 731,424 | 58.5% | 297.678 | 40.1% |
| 39 | Providence, RI–MA | 1,190,956 | 1,411.7 | 545.1 | 843.7 | 2,185.1 | 178,042 | 14.9% | 18.4 | 3.4% |
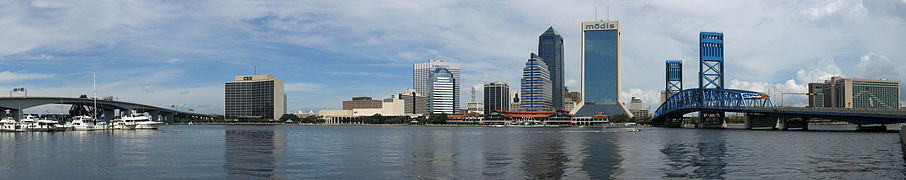
| 40 | Jacksonville, FL | 1,065,219 | 1,373.6 | 530.4 | 775.5 | 2,008.5 | 821,784 | 77.1% | 747.003 | 140.8% |
| 41 | Memphis, TN–MS–AR | 1,060,061 | 1,288.0 | 497.3 | 823.0 | 2,131.6 | 646,889 | 61% | 315.055 | 63.4% |
| 42 | Salt Lake City–West Valley City, UT | 1,021,243 | 719.7 | 277.9 | 1,418.9 | 3,675.1 | 186,440 | 18.3% | 110.34 | 39.7% |
| 43 | Louisville/Jefferson County, KY–IN | 972,546 | 1,234.7 | 476.7 | 787.7 | 2,040.1 | 597,337 | 61.4% | 380.46 | 79.8% |
| 44 | Nashville, TN | 969,587 | 1,459.4 | 563.5 | 664.4 | 1,720.7 | 601,222 | 62% | 504.03 | 89.4% |
| 45 | Richmond, VA | 953,556 | 1,274.7 | 492.2 | 748.1 | 1,937.5 | 204,214 | 21.4% | 59.805 | 12.2% |
| 46 | Buffalo, NY | 935,906 | 984.0 | 379.9 | 951.1 | 2,463.4 | 261,310 | 27.9% | 40.384 | 10.6% |
| 47 | Hartford, CT | 924,859 | 1,337.1 | 516.3 | 691.7 | 1,791.5 | 124,775 | 13.5% | 17.381 | 3.4% |
| 48 | Bridgeport–Stamford, CT–NY | 923,311 | 1,207.5 | 466.2 | 764.7 | 1,980.5 | 144,229 | 15.6% | 15.974 | 3.4% |
| 49 | New Orleans, LA | 899,703 | 651.1 | 251.4 | 1,381.8 | 3,578.9 | 343,829 | 38.2% | 169.423 | 67.4% |
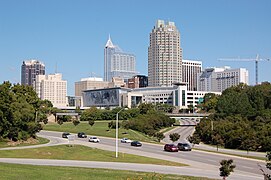
| 50 | Raleigh, NC | 884,891 | 1,342.0 | 518.1 | 659.4 | 1,707.8 | 403,892 | 45.6% | 142.903 | 27.6% |
| 51 | Oklahoma City, OK | 861,505 | 1,063.5 | 410.6 | 810.0 | 2,098.0 | 579,999 | 67.3% | 606.45 | 147.7% |
| 52 | Tucson, AZ | 843,168 | 915.5 | 353.5 | 921.0 | 2,385.4 | 520,116 | 61.7% | 226.709 | 64.1% |
| 53 | El Paso, TX–NM | 803,086 | 649.0 | 250.6 | 1,237.5 | 3,205.0 | 649,121 | 80.8% | 255.235 | 101.8% |
| 54 | Honolulu, HI | 802,459 | 440.7 | 170.2 | 1,820.7 | 4,715.6 | 343,302 | 42.8% | 60.5 | 35.5% |
| 55 | Birmingham, AL | 749,495 | 1,372.4 | 529.9 | 546.1 | 1,414.4 | 212,237 | 28.3% | 146.067 | 27.6% |
| 56 | Albuquerque, NM | 741,318 | 649.0 | 250.6 | 1,142.3 | 2,958.5 | 545,852 | 73.6% | 187.73 | 74.9% |
| 57 | McAllen, TX | 728,825 | 927.2 | 358.0 | 786.1 | 2,035.9 | 129,877 | 17.8% | 48.344 | 13.5% |
| 58 | Omaha, NE–IA | 725,008 | 702.4 | 271.2 | 1,032.1 | 2,673.3 | 408,958 | 56.4% | 127.088 | 46.9% |
| 59 | Dayton, OH | 724,091 | 910.2 | 351.4 | 795.5 | 2,060.4 | 141,527 | 19.5% | 55.652 | 15.8% |
| 60 | Rochester, NY | 720,572 | 840.4 | 324.5 | 857.4 | 2,220.8 | 210,565 | 29.2% | 35.781 | 11.0% |
| 61 | Allentown, PA–NJ | 664,651 | 896.9 | 346.3 | 741.1 | 1,919.3 | 118,032 | 17.8% | 17.546 | 5.1% |
| 62 | Tulsa, OK | 655,479 | 870.0 | 335.9 | 753.4 | 1,951.3 | 391,906 | 59.8% | 196.754 | 58.6% |
| 63 | Fresno, CA | 654,628 | 443.6 | 171.3 | 1,475.6 | 3,821.9 | 494,665 | 75.6% | 111.957 | 65.4% |
| 64 | Sarasota–Bradenton, FL | 643,260 | 846.1 | 326.7 | 760.3 | 1,969.0 | 51,917 | 8.1% | 14.662 | 4.5% |
| 65 | Springfield, MA–CT | 621,300 | 902.8 | 348.6 | 688.2 | 1,782.5 | 153,060 | 24.6% | 31.865 | 9.1% |
| 66 | Concord, CA | 615,968 | 527.7 | 203.8 | 1,167.2 | 3,023.2 | 122,067 | 19.8% | 30.546 | 15.0% |
| 67 | Albany–Schenectady, NY | 594,962 | 765.9 | 295.7 | 776.8 | 2,011.8 | 97,856 | 16.4% | 21.388 | 7.2% |
| 68 | Baton Rouge, LA | 594,309 | 950.0 | 366.8 | 625.6 | 1,620.3 | 229,493 | 38.6% | 76.947 | 21.0% |
| 69 | Mission Viejo–Lake Forest–San Clemente, CA | 583,681 | 389.9 | 150.5 | 1,497.1 | 3,877.6 | 93,305 | 16% | 17.739 | 11.8% |
| 70 | Grand Rapids, MI | 569,935 | 726.7 | 280.6 | 784.3 | 2,031.3 | 188,040 | 33% | 44.395 | 15.8% |
| 71 | Akron, OH | 569,499 | 842.7 | 325.4 | 675.8 | 1,750.3 | 199,110 | 35% | 62.033 | 19.1% |
| 72 | New Haven, CT | 562,839 | 792.8 | 306.1 | 709.9 | 1,838.7 | 129,779 | 23.1% | 18.679 | 6.1% |
| 73 | Colorado Springs, CO | 559,409 | 486.5 | 187.8 | 1,149.9 | 2,978.2 | 416,427 | 74.4% | 194.54 | 103.6% |
| 74 | Knoxville, TN | 558,696 | 1,134.8 | 438.2 | 492.3 | 1,275.1 | 178,874 | 32% | 98.521 | 22.5% |
| 75 | Columbia, SC | 549,777 | 984.3 | 380.0 | 558.6 | 1,446.7 | 129,272 | 23.5% | 132.213 | 34.8% |
| 76 | Charleston–North Charleston, SC | 548,404 | 759.8 | 293.4 | 721.8 | 1,869.5 | 120,083 | 21.9% | 108.979 | 37.1% |
| 77 | Ogden–Layton, UT | 546,026 | 563.5 | 217.6 | 969.1 | 2,509.9 | 82,825 | 15.2% | 27.092 | 12.5% |
| 78 | Cape Coral, FL | 530,290 | 855.5 | 330.3 | 619.9 | 1,605.4 | 154,305 | 29.1% | 105.673 | 32.0% |
| 79 | Bakersfield, CA | 523,994 | 358.6 | 138.4 | 1,461.4 | 3,785.0 | 347,483 | 66.3% | 142.164 | 102.7% |
| 80 | Toledo, OH–MI | 507,643 | 622.7 | 240.4 | 815.2 | 2,111.3 | 287,208 | 56.6% | 80.692 | 33.6% |
| 81 | Worcester, MA–CT | 486,514 | 787.6 | 304.1 | 617.7 | 1,599.8 | 181,045 | 37.2% | 37.371 | 12.3% |
| 82 | Spokane, WA–ID | 486,225 | 547.3 | 211.4 | 888.4 | 2,300.0 | 208,916 | 43% | 59.247 | 28.0% |
| 83 | Provo–Orem, UT | 482,819 | 437.6 | 169.0 | 1,103.2 | 2,857.4 | 112,488 | 23.3% | 41.673 | 24.7% |
| 84 | Wichita, KS | 472,870 | 556.2 | 214.7 | 850.2 | 2,202.1 | 382,368 | 80.9% | 159.295 | 74.2% |
| 85 | Palm Bay–Melbourne, FL | 452,791 | 600.8 | 232.0 | 753.6 | 1,951.9 | 103,190 | 22.8% | 65.702 | 28.3% |
| 86 | Des Moines, IA | 450,070 | 519.5 | 200.6 | 866.3 | 2,243.7 | 203,433 | 45.2% | 80.869 | 40.3% |
| 87 | Harrisburg, PA | 444,474 | 672.6 | 259.7 | 660.9 | 1,711.6 | 49,528 | 11.1% | 8.13 | 3.1% |
| 88 | Murrieta–Temecula–Menifee, CA | 441,546 | 418.9 | 161.7 | 1,054.2 | 2,730.2 | 103,466 | 23.4% | 33.577 | 20.8% |
| 89 | Little Rock, AR | 431,388 | 669.0 | 258.3 | 644.8 | 1,670.0 | 193,524 | 44.9% | 119.2 | 46.1% |
| 90 | Poughkeepsie–Newburgh, NY–NJ | 423,566 | 847.3 | 327.1 | 499.9 | 1,294.7 | 32,736 | 7.7% | 5.144 | 1.6% |
| 91 | Syracuse, NY | 412,317 | 504.9 | 194.9 | 816.7 | 2,115.2 | 145,170 | 35.2% | 25.043 | 12.8% |
| 92 | Lancaster, PA | 402,004 | 641.1 | 247.5 | 627.1 | 1,624.1 | 59,322 | 14.8% | 7.226 | 2.9% |
| 93 | Madison, WI | 401,661 | 391.1 | 151.0 | 1,027.0 | 2,660.0 | 233,209 | 58.1% | 76.789 | 50.9% |
| 94 | Greenville, SC | 400,492 | 829.4 | 320.3 | 482.9 | 1,250.6 | 58,409 | 14.6% | 28.669 | 9.0% |
| 95 | Reno, NV–CA | 392,141 | 425.7 | 164.4 | 921.1 | 2,385.5 | 225,221 | 57.4% | 103.009 | 62.7% |
| 96 | Winston-Salem, NC | 391,024 | 835.5 | 322.6 | 468.0 | 1,212.2 | 229,617 | 58.7% | 132.449 | 41.1% |
| 97 | Youngstown, OH–PA | 387,550 | 624.4 | 241.1 | 620.7 | 1,607.5 | 66,982 | 17.3% | 33.955 | 14.1% |
| 98 | Augusta, GA–SC | 386,787 | 672.2 | 259.5 | 575.4 | 1,490.4 | 195,844 | 50.6% | 302.28 | 116.5% |
| 99 | Scranton, PA | 381,502 | 442.3 | 170.8 | 862.5 | 2,233.8 | 76,089 | 19.9% | 25.309 | 14.8% |
| 100 | Chattanooga, TN–GA | 381,112 | 777.3 | 300.1 | 490.3 | 1,269.8 | 167,674 | 44% | 137.152 | 45.7% |
| 101 | Port St. Lucie, FL | 376,047 | 539.0 | 208.1 | 697.7 | 1,807.1 | 164,603 | 43.8% | 113.953 | 54.8% |
| 102 | Stockton, CA | 370,583 | 239.6 | 92.5 | 1,546.5 | 4,005.3 | 291,707 | 78.7% | 61.67 | 66.7% |
| 103 | Oxnard, CA | 367,260 | 218.6 | 84.4 | 1,680.4 | 4,352.2 | 197,899 | 53.9% | 26.894 | 31.9% |
| 104 | Denton–Lewisville, TX | 366,174 | 376.0 | 145.2 | 973.8 | 2,522.2 | 113,383 | 31% | 87.952 | 60.6% |
| 105 | Modesto, CA | 358,172 | 238.0 | 91.9 | 1,505.1 | 3,898.3 | 201,165 | 56.2% | 36.867 | 40.1% |
| 106 | Flint, MI | 356,218 | 611.0 | 235.9 | 583.0 | 1,510.0 | 102,434 | 28.8% | 33.416 | 14.2% |
| 107 | Jackson, MS | 351,478 | 628.0 | 242.5 | 559.6 | 1,449.5 | 173,514 | 49.4% | 111.046 | 45.8% |
| 108 | Boise, ID | 349,684 | 346.6 | 133.8 | 1,008.9 | 2,612.9 | 205,671 | 58.8% | 79.364 | 59.3% |
| 109 | Palm Coast–Daytona Beach–Port Orange, FL | 349,064 | 464.5 | 179.3 | 751.5 | 1,946.3 | 75,180 | 21.5% | 89.875 | 50.1% |
| 110 | Durham, NC | 347,602 | 470.7 | 181.7 | 738.5 | 1,912.6 | 228,330 | 65.7% | 107.37 | 59.1% |
| 111 | Indio–Cathedral City, CA | 345,580 | 372.4 | 143.8 | 927.9 | 2,403.3 | 76,036 | 22% | 29.181 | 20.3% |
| 112 | Lancaster–Palmdale, CA | 341,219 | 299.1 | 115.5 | 1,140.6 | 2,954.3 | 156,633 | 45.9% | 94.276 | 81.6% |
| 113 | Pensacola, FL–AL | 340,067 | 602.5 | 232.6 | 564.4 | 1,461.9 | 51,923 | 15.3% | 22.541 | 9.7% |
| 114 | Victorville–Hesperia, CA | 328,454 | 432.1 | 166.8 | 760.2 | 1,968.8 | 115,903 | 35.3% | 73.178 | 43.9% |
| 115 | Mobile, AL | 326,183 | 576.9 | 222.8 | 565.4 | 1,464.3 | 195,111 | 59.8% | 139.109 | 62.4% |
| 116 | Corpus Christi, TX | 320,069 | 311.5 | 120.3 | 1,027.4 | 2,661.0 | 305,215 | 95.4% | 160.612 | 133.5% |
| 117 | Kissimmee, FL | 314,071 | 409.9 | 158.3 | 766.2 | 1,984.4 | 59,682 | 19% | 21.194 | 13.4% |
| 118 | Lansing, MI | 313,532 | 409.7 | 158.2 | 765.3 | 1,982.2 | 114,297 | 36.5% | 36.049 | 22.8% |
| 119 | Fort Wayne, IN | 313,492 | 445.8 | 172.1 | 703.2 | 1,821.2 | 253,691 | 80.9% | 110.618 | 64.3% |
| 120 | Greensboro, NC | 311,810 | 479.7 | 185.2 | 650.0 | 1,683.5 | 269,666 | 86.5% | 126.515 | 68.3% |
| 121 | Bonita Springs, FL | 310,298 | 484.2 | 187.0 | 640.8 | 1,659.7 | 43,914 | 14.2% | 38.599 | 20.6% |
| 122 | Fayetteville, NC | 310,282 | 512.9 | 198.0 | 605.0 | 1,566.8 | 200,564 | 64.6% | 145.845 | 73.7% |
| 123 | Santa Rosa, CA | 308,231 | 253.8 | 98.0 | 1,214.5 | 3,145.5 | 167,815 | 54.4% | 41.294 | 42.1% |
| 124 | Aguadilla–Isabela–San Sebastián, PR | 306,196 | 619.7 | 239.3 | 494.1 | 1,279.7 | 60,949 | 19.9% | 2.523 | 1.1% |
| 125 | Ann Arbor, MI | 306,022 | 413.3 | 159.6 | 740.5 | 1,917.8 | 113,934 | 37.2% | 27.83 | 17.4% |
| 126 | Shreveport–Bossier City, LA | 298,317 | 479.7 | 185.2 | 621.8 | 1,610.5 | 199,311 | 66.8% | 105.375 | 56.9% |
| 127 | Rockford, IL | 296,863 | 396.3 | 153.0 | 749.1 | 1,940.1 | 152,871 | 51.5% | 61.081 | 39.9% |
| 128 | Trenton, NJ | 296,668 | 273.4 | 105.6 | 1,085.1 | 2,810.4 | 84,913 | 28.6% | 7.648 | 7.2% |
| 129 | Fayetteville–Springdale–Rogers, AR–MO | 295,083 | 486.2 | 187.7 | 606.9 | 1,571.8 | 73,580 | 24.9% | 53.85 | 28.7% |
| 130 | Round Lake Beach–McHenry–Grayslake, IL–WI | 290,373 | 395.2 | 152.6 | 734.7 | 1,902.8 | 28,175 | 9.7% | 5.063 | 3.3% |
| 131 | Lexington-Fayette, KY | 290,263 | 226.7 | 87.5 | 1,280.3 | 3,315.9 | 295,803 | 101.9% | 283.64 | 324.2% |
| 132 | Waterbury, Connecticut, CT | 287,768 | 800.3 | 309.0 | 359.6 | 931.3 | 110,366 | 38.4% | 28.519 | 9.2% |
| 133 | Huntsville, AL | 286,692 | 543.3 | 209.8 | 527.7 | 1,366.8 | 180,105 | 62.8% | 209.054 | 99.6% |
| 134 | Asheville, NC | 280,648 | 686.0 | 264.9 | 409.1 | 1,059.5 | 83,393 | 29.7% | 44.933 | 17.0% |
| 135 | Davenport, IA–IL | 280,051 | 358.0 | 138.2 | 782.3 | 2,026.0 | 99,685 | 35.6% | 62.948 | 45.5% |
| 136 | Canton, OH | 279,245 | 431.1 | 166.5 | 647.8 | 1,677.7 | 73,007 | 26.1% | 25.462 | 15.3% |
| 137 | South Bend, IN–MI | 278,165 | 417.2 | 161.1 | 666.7 | 1,726.9 | 101,168 | 36.4% | 41.458 | 25.7% |
| 138 | Antioch, CA | 277,634 | 210.7 | 81.4 | 1,317.5 | 3,412.4 | 102,372 | 36.9% | 28.349 | 34.8% |
| 139 | Springfield, MO | 273,724 | 368.6 | 142.3 | 742.7 | 1,923.5 | 159,498 | 58.3% | 81.72 | 57.4% |
| 140 | Peoria, IL | 266,921 | 371.7 | 143.5 | 718.1 | 1,859.9 | 115,007 | 43.1% | 48.007 | 33.5% |
| 141 | Reading, PA | 266,254 | 269.0 | 103.8 | 990.0 | 2,564.0 | 88,082 | 33.1% | 9.884 | 9.5% |
| 142 | Fort Collins, CO | 264,465 | 284.0 | 109.7 | 931.1 | 2,411.6 | 143,986 | 54.4% | 54.277 | 49.5% |
| 143 | Montgomery, AL | 263,907 | 397.8 | 153.6 | 663.5 | 1,718.4 | 205,764 | 78% | 159.565 | 103.9% |
| 144 | Lakeland, FL | 262,596 | 378.2 | 146.0 | 694.4 | 1,798.4 | 97,422 | 37.1% | 65.271 | 44.7% |
| 145 | Savannah, GA | 260,677 | 428.6 | 165.5 | 608.2 | 1,575.1 | 136,286 | 52.3% | 103.151 | 62.3% |
| 146 | Lincoln, NE | 258,719 | 229.1 | 88.5 | 1,129.1 | 2,924.4 | 258,379 | 99.9% | 89.114 | 100.7% |
| 147 | Santa Clarita, CA | 258,653 | 198.7 | 76.7 | 1,301.5 | 3,371.0 | 176,320 | 68.2% | 52.716 | 68.7% |
| 148 | Columbus, GA–AL | 253,602 | 380.8 | 147.1 | 665.9 | 1,724.6 | 189,885 | 74.9% | 216.385 | 147.1% |
| 149 | Lafayette, LA | 252,720 | 462.6 | 178.6 | 546.3 | 1,414.8 | 120,623 | 47.7% | 49.231 | 27.6% |
| 150 | Anchorage, AK | 251,243 | 220.1 | 85.0 | 1,141.5 | 2,956.4 | 291,826 | 116.2% | 1704.683 | 2005.5% |
| 151 | Atlantic City, NJ | 248,402 | 324.1 | 125.1 | 766.4 | 1,985.0 | 39,558 | 15.9% | 10.76 | 8.6% |
| 152 | Eugene, OR | 247,421 | 224.7 | 86.8 | 1,101.2 | 2,852.0 | 156,185 | 63.1% | 43.723 | 50.4% |
| 153 | Barnstable Town, MA | 246,695 | 718.1 | 277.3 | 343.5 | 889.8 | 45,193 | 18.3% | 59.93 | 21.6% |
| 154 | Tallahassee, FL | 240,223 | 327.6 | 126.5 | 733.2 | 1,899.0 | 181,376 | 75.5% | 100.247 | 79.2% |
| 155 | Conroe–The Woodlands, TX | 239,938 | 345.3 | 133.3 | 694.9 | 1,799.7 | 56,207 | 23.4% | 52.715 | 39.5% |
| 156 | Lubbock, TX | 237,356 | 249.8 | 96.5 | 950.1 | 2,460.7 | 229,573 | 96.7% | 122.41 | 126.8% |
| 157 | Salem, OR | 236,632 | 196.6 | 75.9 | 1,203.4 | 3,116.8 | 154,637 | 65.3% | 47.896 | 63.1% |
| 158 | Laredo, TX | 235,730 | 170.1 | 65.7 | 1,385.7 | 3,588.8 | 236,091 | 100.2% | 88.908 | 135.3% |
| 159 | York, PA | 232,045 | 342.4 | 132.2 | 677.7 | 1,755.1 | 43,718 | 18.8% | 5.293 | 4.0% |
| 160 | Evansville, IN–KY | 229,351 | 307.8 | 118.8 | 745.1 | 1,929.9 | 117,429 | 51.2% | 44.153 | 37.2% |
| 161 | Nashua, NH–MA | 226,400 | 472.1 | 182.3 | 479.6 | 1,242.1 | 86,494 | 38.2% | 30.85 | 16.9% |
| 162 | Wilmington, NC | 219,957 | 346.5 | 133.8 | 634.9 | 1,644.3 | 106,476 | 48.4% | 51.493 | 38.5% |
| 163 | Visalia, CA | 219,454 | 164.3 | 63.4 | 1,335.8 | 3,459.6 | 124,442 | 56.7% | 36.246 | 57.2% |
| 164 | Killeen, TX | 217,630 | 219.7 | 84.8 | 990.8 | 2,566.1 | 127,921 | 58.8% | 53.58 | 63.2% |
| 165 | Brownsville, TX | 217,585 | 211.2 | 81.5 | 1,030.4 | 2,668.8 | 175,023 | 80.4% | 132.33 | 162.4% |
| 166 | Appleton, WI | 216,154 | 268.8 | 103.8 | 804.2 | 2,082.9 | 72,623 | 33.6% | 24.326 | 23.4% |
| 167 | Myrtle Beach–Socastee, SC–NC | 215,304 | 493.1 | 190.4 | 436.7 | 1,131.0 | 27,109 | 12.6% | 23.324 | 12.3% |
| 168 | Concord, NC | 214,881 | 466.7 | 180.2 | 460.4 | 1,192.4 | 79,066 | 36.8% | 60.267 | 33.4% |
| 169 | Thousand Oaks, CA | 214,811 | 221.8 | 85.6 | 968.6 | 2,508.8 | 126,683 | 59% | 55.031 | 64.3% |
| 170 | Aberdeen–Bel Air South–Bel Air North, MD | 213,751 | 339.6 | 131.1 | 629.4 | 1,630.1 | 14,959 | 7% | 6.795 | 5.2% |
| 171 | Hickory, NC | 212,195 | 677.6 | 261.6 | 313.2 | 811.1 | 40,010 | 18.9% | 29.708 | 11.4% |
| 172 | Kennewick-Pasco, WA | 210,975 | 265.4 | 102.5 | 795.0 | 2,059.0 | 181,756[a] | 86.2%[a] | 100.63 | 98.2% |
| 173 | Roanoke, VA | 210,111 | 321.6 | 124.2 | 653.3 | 1,692.0 | 97,032 | 46.2% | 42.562 | 34.3% |
| 174 | Kalamazoo, MI | 209,703 | 341.1 | 131.7 | 614.9 | 1,592.5 | 74,262 | 35.4% | 24.684 | 18.7% |
| 175 | Norwich–New London, CT–RI | 209,190 | 393.7 | 152.0 | 531.4 | 1,376.3 | 40,493 | 19.4% | 28.062 | 18.5% |
| 176 | Gulfport, MS | 208,948 | 426.1 | 164.5 | 490.4 | 1,270.0 | 67,793 | 32.4% | 55.592 | 33.8% |
| 177 | Green Bay, WI | 206,520 | 272.0 | 105.0 | 759.4 | 1,966.7 | 104,057 | 50.4% | 45.467 | 43.3% |
| 178 | Portland, ME | 203,914 | 352.0 | 135.9 | 579.3 | 1,500.4 | 66,194 | 32.5% | 21.308 | 15.7% |
| 179 | Huntington, WV-KY-OH | 202,637 | 337.6 | 130.3 | 600.3 | 1,554.7 | 49,138 | 24.2% | 16.221 | 12.4% |
| 180 | Winter Haven, FL | 201,289 | 348.0 | 134.4 | 578.4 | 1,498.1 | 33,874 | 16.8% | 31.297 | 23.3% |
| 181 | Bremerton, WA | 198,979 | 353.5 | 136.5 | 562.9 | 1,457.9 | 37,729 | 19% | 28.407 | 20.8% |
| 182 | Avondale–Goodyear, AZ | 197,041 | 227.7 | 87.9 | 865.3 | 2,241.2 | 76,238 | 38.7% | 45.598 | 51.9% |
| 183 | Amarillo, TX | 196,651 | 210.2 | 81.2 | 935.3 | 2,422.5 | 190,695 | 97% | 99.476 | 122.5% |
| 184 | Erie, PA | 196,611 | 213.0 | 82.2 | 923.0 | 2,390.6 | 101,786 | 51.8% | 19.081 | 23.2% |
| 185 | Santa Barbara, CA | 195,861 | 144.6 | 55.9 | 1,354.1 | 3,507.0 | 88,410 | 45.1% | 19.468 | 34.8% |
| 186 | Fort Walton Beach–Navarre–Wright, FL | 191,917 | 312.1 | 120.5 | 614.9 | 1,592.6 | 19,507 | 10.2% | 7.483 | 6.2% |
| 187 | Gainesville, FL | 187,781 | 225.4 | 87.0 | 833.0 | 2,157.4 | 124,354 | 66.2% | 61.305 | 70.5% |
| 188 | Salinas, CA | 184,809 | 126.8 | 49.0 | 1,457.8 | 3,775.7 | 150,441 | 81.4% | 23.179 | 47.3% |
| 189 | Hagerstown, MD–WV–PA | 182,696 | 345.3 | 133.3 | 529.1 | 1,370.2 | 39,662 | 21.7% | 11.787 | 8.8% |
| 190 | Deltona, FL | 182,169 | 249.8 | 96.5 | 729.2 | 1,888.6 | 85,182 | 46.8% | 37.531 | 38.9% |
| 191 | Lorain–Elyria, OH | 180,956 | 259.5 | 100.2 | 697.3 | 1,806.0 | 54,533 | 30.1% | 23.673 | 23.6% |
| 192 | Spartanburg, SC | 180,786 | 492.2 | 190.0 | 367.3 | 951.3 | 37,013 | 20.5% | 19.769 | 10.4% |
| 193 | Cedar Rapids, IA | 177,844 | 216.1 | 83.5 | 822.8 | 2,131.1 | 126,326 | 71% | 70.799 | 84.8% |
| 194 | Fargo, ND–MN | 176,676 | 182.0 | 70.3 | 970.8 | 2,514.3 | 105,549 | 59.7% | 48.821 | 69.4% |
| 195 | Olympia–Lacey, WA | 176,617 | 273.5 | 105.6 | 645.9 | 1,672.8 | 46,478 | 26.3% | 17.821 | 16.9% |
| 196 | Waco, TX | 172,378 | 233.8 | 90.3 | 737.4 | 1,910.0 | 124,805 | 72.4% | 88.964 | 98.5% |
| 197 | College Station-Bryan, TX | 171,345 | 185.0 | 71.4 | 926.3 | 2,399.0 | 93,857 | 54.8% | 49.442 | 69.2% |
| 198 | McKinney, TX | 170,030 | 191.9 | 74.1 | 885.9 | 2,294.5 | 131,117 | 77.1% | 62.209 | 84.0% |
| 199 | North Port–Port Charlotte, FL | 169,541 | 308.1 | 118.9 | 550.3 | 1,425.4 | 57,357 | 33.8% | 99.576 | 83.7% |
| 200 | Gastonia, NC–SC | 169,495 | 359.1 | 138.6 | 472.1 | 1,222.6 | 71,741 | 42.3% | 50.504 | 36.4% |
| 201 | Danbury, CT–NY | 168,136 | 341.0 | 131.7 | 493.1 | 1,277.1 | 80,893 | 48.1% | 41.892 | 31.8% |
| 202 | High Point, NC | 166,485 | 292.7 | 113.0 | 568.9 | 1,473.4 | 104,371 | 62.7% | 53.803 | 47.6% |
| 203 | Vallejo, CA | 165,074 | 108.8 | 42.0 | 1,517.1 | 3,929.3 | 115,942 | 70.2% | 30.671 | 73.0% |
| 204 | Santa Cruz, CA | 163,703 | 151.1 | 58.4 | 1,083.2 | 2,805.5 | 59,946 | 36.6% | 12.74 | 21.8% |
| 205 | Hemet, CA | 163,379 | 127.2 | 49.1 | 1,284.9 | 3,327.8 | 78,657 | 48.1% | 27.847 | 56.7% |
| 206 | Springfield, IL | 161,316 | 239.1 | 92.3 | 674.5 | 1,747.1 | 116,250 | 72.1% | 59.48 | 64.4% |
| 207 | Muskegon, MI | 161,280 | 290.8 | 112.3 | 554.5 | 1,436.2 | 38,401 | 23.8% | 14.211 | 12.7% |
| 208 | Clarksville, TN–KY | 158,655 | 283.8 | 109.6 | 559.1 | 1,448.0 | 132,929 | 83.8% | 97.603 | 89.1% |
| 209 | Manchester, NH | 158,377 | 223.1 | 86.2 | 709.8 | 1,838.4 | 109,565 | 69.2% | 33.101 | 38.4% |
| 210 | Binghamton, NY–PA | 158,084 | 192.0 | 74.1 | 823.2 | 2,132.2 | 47,376 | 30% | 10.489 | 14.2% |
| 211 | Ocala, FL | 156,909 | 290.3 | 112.1 | 540.5 | 1,399.9 | 56,315 | 35.9% | 44.829 | 40.0% |
| 212 | Sioux Falls, SD | 156,777 | 166.2 | 64.2 | 943.3 | 2,443.1 | 153,888 | 98.2% | 72.964 | 113.7% |
| 213 | Medford, OR | 154,081 | 167.6 | 64.7 | 919.2 | 2,380.8 | 74,907 | 48.6% | 25.733 | 39.8% |
| 214 | Charleston, WV | 153,199 | 254.4 | 98.2 | 602.3 | 1,559.9 | 51,400 | 33.6% | 31.52 | 32.1% |
| 215 | Port Arthur, TX | 153,150 | 273.4 | 105.6 | 560.2 | 1,450.9 | 53,818 | 35.1% | 76.902 | 72.8% |
| 216 | Nampa, ID | 151,499 | 179.7 | 69.4 | 842.9 | 2,183.1 | 81,557 | 53.8% | 31.192 | 44.9% |
| 217 | Topeka, KS | 150,003 | 206.1 | 79.6 | 727.7 | 1,884.8 | 127,473 | 85% | 60.168 | 75.6% |
| 218 | Ponce, PR | 149,539 | 114.3 | 44.1 | 1,308.6 | 3,389.4 | 166,327 | 111.2% | 30.607 | 69.4% |
| 219 | New Bedford, MA | 149,443 | 142.7 | 55.1 | 1,047.2 | 2,712.2 | 95,072 | 63.6% | 19.997 | 36.3% |
| 220 | Sebastian–Vero Beach South–Florida Ridge, FL | 149,422 | 250.3 | 96.7 | 596.9 | 1,546.0 | 21,929 | 14.7% | 13.664 | 14.1% |
| 221 | Spring Hill, FL | 148,220 | 297.8 | 115.0 | 497.7 | 1,289.1 | 98,621 | 66.5% | 59.806 | 52.0% |
| 222 | Beaumont, TX | 147,922 | 237.5 | 91.7 | 622.9 | 1,613.4 | 118,296 | 80% | 82.801 | 90.3% |
| 223 | Lafayette, IN | 147,725 | 166.0 | 64.1 | 889.7 | 2,304.3 | 67,140 | 45.4% | 27.742 | 43.3% |
| 224 | Champaign, IL | 145,361 | 121.5 | 46.9 | 1,196.7 | 3,099.5 | 81,055 | 55.8% | 22.433 | 47.8% |
| 225 | Marysville, WA | 145,140 | 211.9 | 81.8 | 685.0 | 1,774.0 | 60,020 | 41.4% | 20.679 | 25.3% |
| 226 | Houma, LA | 144,875 | 236.8 | 91.4 | 611.8 | 1,584.5 | 33,727 | 23.3% | 14.417 | 15.8% |
| 227 | Elkhart, IN–MI | 143,592 | 237.9 | 91.9 | 603.5 | 1,563.1 | 50,949 | 35.5% | 23.453 | 25.5% |
| 228 | Lake Charles, LA | 143,440 | 327.7 | 126.5 | 437.7 | 1,133.7 | 71,993 | 50.2% | 42.057 | 33.2% |
| 229 | Panama City, FL | 143,280 | 238.0 | 91.9 | 601.9 | 1,558.9 | 36,484 | 25.5% | 35.12 | 38.2% |
| 230 | Frederick, MD | 141,576 | 190.1 | 73.4 | 744.8 | 1,929.0 | 65,239 | 46.1% | 21.99 | 30.0% |
| 231 | Fredericksburg, VA | 141,238 | 201.5 | 77.8 | 700.8 | 1,815.2 | 24,286 | 17.2% | 10.44 | 13.4% |
| 232 | Arecibo, PR | 139,171 | 217.7 | 84.1 | 639.2 | 1,655.4 | 96,440 | 69.3% | 15.532 | 18.5% |
| 233 | Tuscaloosa, AL | 139,114 | 231.8 | 89.5 | 600.0 | 1,554.1 | 90,468 | 65% | 60.234 | 67.3% |
| 234 | Macon, GA | 137,570 | 253.9 | 98.0 | 541.9 | 1,403.6 | 91,351 | 66.4% | 55.721 | 56.9% |
| 235 | Merced, CA | 136,969 | 123.1 | 47.5 | 1,112.6 | 2,881.6 | 78,958 | 57.6% | 23.316 | 49.1% |
| 236 | Pueblo, CO | 136,550 | 192.2 | 74.2 | 710.4 | 1,840.0 | 106,595 | 78.1% | 53.641 | 72.3% |
| 237 | Harlingen, TX | 135,663 | 214.3 | 82.8 | 633.0 | 1,639.4 | 64,849 | 47.8% | 39.806 | 48.1% |
| 238 | Yuma, AZ–CA | 135,267 | 152.3 | 58.8 | 888.0 | 2,299.9 | 93,064 | 68.8% | 120.278 | 204.6% |
| 239 | Racine, WI | 133,700 | 128.0 | 49.4 | 1,044.8 | 2,705.9 | 78,860 | 59% | 15.481 | 31.3% |
| 240 | Fairfield, CA | 133,683 | 102.2 | 39.5 | 1,307.9 | 3,387.6 | 105,321 | 78.8% | 37.39 | 94.7% |
| 241 | Murfreesboro, TN | 133,228 | 200.3 | 77.3 | 665.1 | 1,722.7 | 108,755 | 81.6% | 55.346 | 71.6% |
| 242 | Warner Robins, GA | 133,109 | 260.6 | 100.6 | 510.8 | 1,323.0 | 66,588 | 50% | 35.068 | 34.9% |
| 243 | Bloomington-Normal, IL | 132,600 | 127.4 | 49.2 | 1,040.7 | 2,695.5 | 76,610 | 57.8% | 27.217 | 55.3% |
| 244 | Leesburg–Eustis–Tavares, FL | 131,337 | 244.6 | 94.4 | 537.0 | 1,391.0 | 20,117 | 15.3% | 30.797 | 32.6% |
| 245 | Gainesville, GA | 130,846 | 327.0 | 126.3 | 400.1 | 1,036.2 | 33,804 | 25.8% | 31.925 | 25.3% |
| 246 | Santa Maria, CA | 130,447 | 75.4 | 29.1 | 1,729.2 | 4,478.5 | 99,553 | 76.3% | 22.756 | 78.2% |
| 247 | Tyler, TX | 130,247 | 233.7 | 90.2 | 557.3 | 1,443.3 | 96,900 | 74.4% | 53.858 | 59.7% |
| 248 | Yakima, WA | 129,534 | 155.0 | 59.8 | 835.9 | 2,165.0 | 91,067 | 70.3% | 27.18 | 45.5% |
| 249 | Athens, GA | 128,754 | 254.8 | 98.4 | 505.2 | 1,308.5 | 115,452 | 89.7% | 116.33 | 118.2% |
| 250 | Las Cruces, NM | 128,600 | 167.6 | 64.7 | 767.4 | 1,987.6 | 97,618 | 75.9% | 76.492 | 118.2% |
| 251 | Grand Junction, CO | 128,124 | 204.1 | 78.8 | 627.8 | 1,626.0 | 58,566 | 45.7% | 38.218 | 48.5% |
| 252 | Odessa, TX | 126,405 | 152.6 | 58.9 | 828.1 | 2,144.8 | 99,940 | 79.1% | 41.955 | 71.2% |
| 253 | Saginaw, MI | 126,265 | 184.4 | 71.2 | 684.6 | 1,773.0 | 51,508 | 40.8% | 17.336 | 24.3% |
| 254 | Simi Valley, CA | 125,206 | 81.4 | 31.4 | 1,538.0 | 3,983.4 | 124,237 | 99.2% | 41.48 | 132.1% |
| 255 | Columbia, MO | 124,748 | 160.1 | 61.8 | 779.3 | 2,018.3 | 108,500 | 87% | 63.077 | 102.1% |
| 256 | Kenosha, WI–IL | 124,064 | 132.6 | 51.2 | 935.4 | 2,422.8 | 99,218 | 80% | 26.931 | 52.6% |
| 257 | Fort Smith, AR–OK | 122,947 | 183.3 | 70.8 | 670.8 | 1,737.3 | 86,209 | 70.1% | 61.966 | 87.5% |
| 258 | Mauldin–Simpsonville, SC | 120,577 | 216.4 | 83.6 | 557.1 | 1,442.9 | 22,889 | 19% | 9.954 | 11.9% |
| 259 | Johnson City, TN | 120,415 | 284.7 | 109.9 | 423.0 | 1,095.5 | 63,152 | 52.4% | 43.28 | 39.4% |
| 260 | Duluth, MN–WI | 120,378 | 182.5 | 70.5 | 659.5 | 1,708.0 | 86,265 | 71.7% | 67.793 | 96.2% |
| 261 | Burlington, NC | 119,911 | 234.2 | 90.4 | 512.0 | 1,326.0 | 49,963 | 41.7% | 25.169 | 27.8% |
| 262 | South Lyon–Howell, MI | 119,509 | 266.2 | 102.8 | 448.9 | 1,162.7 | 11,327 | 9.5% | 3.734 | 3.6% |
| 263 | San Germán–Cabo Rojo–Sabana Grande, PR | 118,199 | 247.3 | 95.5 | 478.0 | 1,237.9 | 35,527 | 30.1% | 54.51 | 57.1% |
| 264 | Greeley, CO | 117,825 | 106.8 | 41.2 | 1,103.3 | 2,857.5 | 92,889 | 78.8% | 46.55 | 113.0% |
| 265 | Midland, TX | 117,807 | 137.0 | 52.9 | 860.2 | 2,227.9 | 111,147 | 94.3% | 72.071 | 136.2% |
| 266 | Greenville, NC | 117,798 | 168.9 | 65.2 | 697.6 | 1,806.8 | 84,554 | 71.8% | 34.607 | 53.1% |
| 267 | Redding, CA | 117,731 | 184.0 | 71.1 | 639.7 | 1,656.8 | 89,861 | 76.3% | 59.647 | 83.9% |
| 268 | Utica, NY | 117,328 | 161.6 | 62.4 | 726.1 | 1,880.6 | 62,235 | 53% | 16.759 | 26.9% |
| 269 | Leominster–Fitchburg, MA | 116,960 | 168.4 | 65.0 | 694.3 | 1,798.3 | 40,759 | 34.8% | 28.815 | 44.3% |
| 270 | Yuba City, CA | 116,719 | 100.1 | 38.7 | 1,165.7 | 3,019.3 | 64,925 | 55.6% | 14.9 | 38.5% |
| 271 | Lynchburg, VA | 116,636 | 230.0 | 88.8 | 507.1 | 1,313.3 | 75,568 | 64.8% | 49.128 | 55.3% |
| 272 | Monroe, LA | 116,533 | 212.2 | 81.9 | 549.1 | 1,422.1 | 48,815 | 41.9% | 29.214 | 35.7% |
| 273 | Billings, MT | 114,773 | 137.2 | 53.0 | 836.7 | 2,167.0 | 104,170 | 90.8% | 43.413 | 81.9% |
| 274 | Boulder, CO | 114,591 | 84.1 | 32.5 | 1,361.9 | 3,527.3 | 97,385 | 85% | 24.665 | 75.9% |
| 275 | Bellingham, WA | 114,473 | 124.6 | 48.1 | 918.5 | 2,378.8 | 80,885 | 70.7% | 27.079 | 56.3% |
| 276 | Seaside–Monterey, CA | 114,237 | 100.2 | 38.7 | 1,139.9 | 2,952.3 | 33,025 | 28.9% | 9.237 | 23.9% |
| 277 | Kailua (Honolulu County)–Kaneohe, HI | 113,682 | 101.1 | 39.0 | 1,124.4 | 2,912.3 | 37,856 | 33.3% | 35.634 | 91.4% |
| 278 | Waterloo, IA | 113,418 | 161.2 | 62.2 | 703.7 | 1,822.5 | 68,406 | 60.3% | 61.389 | 98.7% |
| 279 | Lady Lake–The Villages, FL | 112,991 | 184.1 | 71.1 | 613.9 | 1,589.9 | 13,926 | 12.3% | 8.073 | 11.4% |
| 280 | Dover, DE | 110,769 | 191.7 | 74.0 | 577.7 | 1,496.3 | 36,047 | 32.5% | 23.148 | 31.3% |
| 281 | St. Cloud, MN | 110,621 | 130.1 | 50.3 | 850.1 | 2,201.6 | 65,842 | 59.5% | 40.038 | 79.6% |
| 282 | Abilene, TX | 110,421 | 141.8 | 54.7 | 779.0 | 2,017.5 | 117,063 | 106% | 106.793 | 195.2% |
| 283 | Waldorf, MD | 109,919 | 176.1 | 68.0 | 624.4 | 1,617.1 | 67,752 | 61.6% | 36.22 | 53.3% |
| 284 | Mayagüez, PR | 109,572 | 139.2 | 53.7 | 787.3 | 2,039.0 | 89,080 | 81.3% | 77.63 | 144.6% |
| 285 | Burlington, VT | 108,740 | 159.9 | 61.8 | 679.8 | 1,760.8 | 42,417 | 39% | 10.306 | 16.7% |
| 286 | Bloomington, IN | 108,657 | 116.0 | 44.8 | 936.5 | 2,425.5 | 80,405 | 74% | 23.158 | 51.7% |
| 287 | Pottstown, PA | 107,682 | 204.2 | 78.8 | 527.4 | 1,366.1 | 22,377 | 20.8% | 4.888 | 6.2% |
| 288 | Rochester, MN | 107,677 | 131.0 | 50.6 | 821.9 | 2,128.8 | 106,769 | 99.2% | 54.586 | 107.9% |
| 289 | El Centro–Calexico, CA | 107,672 | 77.7 | 30.0 | 1,386.0 | 3,589.6 | 42,598 | 39.6% | 11.081 | 36.9% |
| 290 | Iowa City, IA | 106,621 | 118.0 | 45.6 | 903.2 | 2,339.4 | 67,862 | 63.6% | 25.6 | 56.1% |
| 291 | Kingsport, TN–VA | 106,571 | 294.1 | 113.6 | 362.3 | 938.5 | 48,205 | 45.2% | 49.81 | 43.8% |
| 292 | Sioux City, IA–NE–SD | 106,494 | 140.8 | 54.4 | 756.2 | 1,958.7 | 82,684 | 77.6% | 58.45 | 107.4% |
| 293 | Texas City, TX | 106,383 | 196.9 | 76.0 | 540.4 | 1,399.6 | 45,099 | 42.4% | 66.28 | 87.2% |
| 294 | Jacksonville, NC | 105,419 | 184.8 | 71.3 | 570.6 | 1,477.8 | 70,145 | 66.5% | 46.51 | 65.2% |
| 295 | Rock Hill, SC | 104,996 | 247.7 | 95.6 | 424.0 | 1,098.1 | 66,154 | 63% | 35.722 | 37.4% |
| 296 | Norman, OK | 103,898 | 116.2 | 44.9 | 893.9 | 2,315.2 | 110,925 | 106.8% | 178.763 | 398.1% |
| 297 | Eau Claire, WI | 102,852 | 178.7 | 69.0 | 575.5 | 1,490.6 | 65,883 | 64.1% | 32.043 | 46.4% |
| 298 | La Crosse, WI–MN | 100,868 | 132.1 | 51.0 | 763.8 | 1,978.1 | 51,320 | 50.9% | 20.516 | 40.2% |
| 299 | Holland, MI | 99,941 | 153.4 | 59.2 | 651.3 | 1,686.9 | 33,051 | 33.1% | 16.589 | 28.0% |
| 300 | Turlock, CA | 99,904 | 66.8 | 25.8 | 1,495.7 | 3,873.8 | 68,549 | 68.6% | 16.928 | 65.6% |
| 301 | Wichita Falls, TX | 99,437 | 130.4 | 50.4 | 762.3 | 1,974.4 | 104,553 | 105.1% | 72.14 | 143.1% |
| 302 | Longview, TX | 98,884 | 215.1 | 83.0 | 459.8 | 1,190.9 | 80,455 | 81.4% | 55.693 | 67.1% |
| 303 | Gilroy–Morgan Hill, CA | 98,413 | 117.7 | 45.4 | 836.2 | 2,165.8 | 48,821 | 49.6% | 16.146 | 35.6% |
| 305 | St. George, UT | 98,370 | 116.3 | 44.9 | 846.0 | 2,191.2 | 72,897 | 74.1% | 70.401 | 156.8% |
| 306 | Chico, CA | 98,176 | 89.1 | 34.4 | 1,101.6 | 2,853.2 | 86,187 | 87.8% | 32.923 | 95.7% |
| 307 | Salisbury, MD–DE | 98,081 | 183.1 | 70.7 | 535.6 | 1,387.3 | 30,343 | 30.9% | 13.395 | 18.9% |
| 308 | Middletown, OH | 97,503 | 145.3 | 56.1 | 671.1 | 1,738.1 | 48,694 | 49.9% | 26.185 | 46.7% |
| 309 | Albany, GA | 95,779 | 183.5 | 70.8 | 522.0 | 1,352.0 | 77,434 | 80.8% | 55.125 | 77.9% |
| 310 | Vineland, NJ | 95,259 | 160.3 | 61.9 | 594.2 | 1,538.9 | 60,724 | 63.7% | 68.424 | 110.5% |
| 311 | Logan, UT | 94,983 | 113.8 | 43.9 | 834.8 | 2,162.2 | 48,174 | 50.7% | 17.939 | 40.9% |
| 312 | Lawton, OK | 94,457 | 114.2 | 44.1 | 827.5 | 2,143.1 | 96,867 | 102.6% | 81.034 | 183.8% |
| 313 | Decatur, IL | 93,863 | 153.3 | 59.2 | 612.2 | 1,585.5 | 76,122 | 81.1% | 42.224 | 71.3% |
| 314 | Vacaville, CA | 93,141 | 71.0 | 27.4 | 1,312.0 | 3,398.2 | 92,428 | 99.2% | 28.373 | 103.6% |
| 315 | San Angelo, TX | 92,984 | 120.9 | 46.7 | 769.2 | 1,992.1 | 93,200 | 100.2% | 56.865 | 121.8% |
| 316 | Terre Haute, IN | 92,742 | 138.4 | 53.5 | 669.9 | 1,735.1 | 60,785 | 65.5% | 34.536 | 64.6% |
| 317 | Charlottesville, VA | 92,359 | 89.5 | 34.6 | 1,031.9 | 2,672.7 | 43,475 | 47.1% | 10.238 | 29.6% |
| 318 | Slidell, LA | 91,151 | 151.8 | 58.6 | 600.5 | 1,555.4 | 27,068 | 29.7% | 14.844 | 25.3% |
| 319 | Yauco, PR | 90,899 | 120.6 | 46.6 | 753.9 | 1,952.5 | 34,172 | 37.6% | 2.873 | 6.2% |
| 320 | Longmont, CO | 90,897 | 67.9 | 26.2 | 1,338.1 | 3,465.7 | 86,270 | 94.9% | 26.187 | 100.0% |
| 321 | Idaho Falls, ID | 90,733 | 115.3 | 44.5 | 787.1 | 2,038.5 | 56,813 | 62.6% | 22.349 | 50.2% |
| 322 | Muncie, IN | 90,580 | 120.9 | 46.7 | 749.4 | 1,941.0 | 70,085 | 77.4% | 27.196 | 58.2% |
| 323 | Temple, TX | 90,390 | 140.1 | 54.1 | 645.1 | 1,670.7 | 66,102 | 73.1% | 69.006 | 127.6% |
| 324 | Jackson, MI | 90,057 | 149.4 | 57.7 | 602.9 | 1,561.5 | 33,534 | 37.2% | 10.865 | 18.8% |
| 325 | Florence, SC | 89,557 | 184.0 | 71.1 | 486.7 | 1,260.5 | 37,056 | 41.4% | 20.888 | 29.4% |
| 326 | Santa Fe, NM | 89,284 | 137.5 | 53.1 | 649.4 | 1,681.9 | 67,947 | 76.1% | 45.978 | 86.6% |
| 327 | Mandeville–Covington, LA | 88,925 | 169.9 | 65.6 | 523.4 | 1,355.7 | 11,560 | 13% | 6.713 | 10.2% |
| 328 | Blacksburg, VA | 88,542 | 132.6 | 51.2 | 667.6 | 1,729.0 | 42,620 | 48.1% | 19.893 | 38.9% |
| 329 | Portsmouth, NH–ME | 88,200 | 240.0 | 92.7 | 367.5 | 951.7 | 20,779 | 23.6% | 15.635 | 16.9% |
| 330 | Anderson, IN | 88,133 | 171.1 | 66.1 | 515.1 | 1,334.1 | 56,129 | 63.7% | 41.371 | 62.6% |
| 331 | Dover–Rochester, NH–ME | 88,087 | 172.0 | 66.4 | 512.0 | 1,326.1 | 29,987 | 34% | 26.718 | 40.2% |
| 332 | Lawrence, KS | 88,053 | 78.8 | 30.4 | 1,116.8 | 2,892.4 | 87,643 | 99.5% | 33.564 | 110.4% |
| 333 | Hanford, CA | 87,941 | 71.9 | 27.7 | 1,223.9 | 3,169.8 | 53,967 | 61.4% | 16.589 | 59.9% |
| 334 | Tracy, CA | 87,569 | 57.6 | 22.3 | 1,519.1 | 3,934.6 | 82,922 | 94.7% | 22.003 | 98.7% |
| 335 | State College, PA | 87,454 | 74.7 | 28.8 | 1,171.4 | 3,033.9 | 42,034 | 48.1% | 4.557 | 15.8% |
| 336 | Port Huron, MI | 87,106 | 156.6 | 60.4 | 556.4 | 1,441.1 | 30,184 | 34.7% | 8.081 | 13.4% |
| 337 | Springfield, OH | 85,256 | 126.8 | 49.0 | 672.3 | 1,741.2 | 60,608 | 71.1% | 25.294 | 51.6% |
| 338 | Dalton, GA | 85,239 | 209.3 | 80.8 | 407.2 | 1,054.6 | 33,128 | 38.9% | 20.539 | 25.4% |
| 339 | Fajardo, PR | 85,225 | 131.6 | 50.8 | 647.8 | 1,677.8 | 36,993 | 43.4% | 8.135 | 16.0% |
| 340 | Lee's Summit, MO | 85,081 | 107.0 | 41.3 | 795.0 | 2,059.0 | 91,364 | 107.4% | 63.348 | 153.4% |
| 341 | Prescott Valley–Prescott, AZ | 84,744 | 132.0 | 51.0 | 641.8 | 1,662.2 | 38,822 | 45.8% | 38.653 | 75.8% |
| 342 | Napa, CA | 83,913 | 66.9 | 25.8 | 1,254.8 | 3,250.0 | 76,915 | 91.7% | 17.839 | 69.1% |
| 343 | Alton, IL–MO | 83,890 | 141.9 | 54.8 | 591.0 | 1,530.6 | 27,865 | 33.2% | 15.47 | 28.2% |
| 344 | Bend, OR | 83,794 | 102.9 | 39.7 | 814.7 | 2,110.0 | 76,639 | 91.5% | 33.006 | 83.1% |
| 345 | Manteca, CA | 83,578 | 56.5 | 21.8 | 1,478.0 | 3,828.0 | 67,096 | 80.3% | 17.733 | 81.3% |
| 346 | Alexandria, LA | 82,804 | 169.8 | 65.5 | 487.8 | 1,263.4 | 47,723 | 57.6% | 28.41 | 43.4% |
| 347 | Joplin, MO | 82,775 | 166.8 | 64.4 | 496.2 | 1,285.0 | 50,150 | 60.6% | 35.559 | 55.2% |
| 348 | Missoula, MT | 82,157 | 117.1 | 45.2 | 701.7 | 1,817.5 | 66,788 | 81.3% | 27.512 | 60.9% |
| 349 | Bismarck, ND | 81,955 | 100.4 | 38.8 | 816.4 | 2,114.6 | 61,272 | 74.8% | 30.845 | 79.5% |
| 350 | Kankakee, IL | 81,926 | 96.2 | 37.2 | 851.2 | 2,204.6 | 27,537 | 33.6% | 14.137 | 38.0% |
| 351 | Livermore, CA | 81,624 | 63.4 | 24.5 | 1,287.9 | 3,335.6 | 80,968 | 99.2% | 25.173 | 102.7% |
| 352 | Rapid City, SD | 81,251 | 109.4 | 42.3 | 742.5 | 1,923.0 | 67,956 | 83.6% | 54.71 | 129.3% |
| 353 | Wheeling, WV–OH | 81,249 | 121.8 | 47.0 | 667.3 | 1,728.4 | 28,486 | 35.1% | 13.791 | 29.3% |
| 354 | St. Joseph, MO–KS | 81,176 | 108.4 | 41.9 | 749.0 | 1,939.9 | 76,780 | 94.6% | 43.993 | 105.0% |
| 355 | Homosassa Springs–Beverly Hills–Citrus Springs, FL | 80,962 | 234.3 | 90.5 | 345.6 | 895.0 | 13,791 | 17% | 25.136 | 27.8% |
| 356 | Juana Díaz, PR | 80,928 | 123.8 | 47.8 | 653.6 | 1,692.9 | 72,897 | 90.1% | 60.29 | 126.1% |
| 357 | Hattiesburg, MS | 80,358 | 178.7 | 69.0 | 449.7 | 1,164.6 | 45,989 | 57.2% | 53.385 | 77.4% |
| 358 | Guayama, PR | 80,155 | 105.5 | 40.7 | 759.8 | 1,967.9 | 45,362 | 56.6% | 3.662 | 9.0% |
| 359 | Altoona, PA | 79,930 | 96.8 | 37.4 | 825.3 | 2,137.5 | 46,320 | 58% | 9.907 | 26.5% |
| 360 | Anniston–Oxford, AL | 79,796 | 224.7 | 86.8 | 355.1 | 919.6 | 23,106 | 29% | 45.636 | 52.6% |
| 361 | Lafayette–Louisville–Erie, CO | 79,407 | 102.4 | 39.5 | 775.6 | 2,008.7 | 24,453 | 30.8% | 9.463 | 24.0% |
| 362 | Madera, CA | 78,413 | 58.0 | 22.4 | 1,352.1 | 3,501.9 | 61,416 | 78.3% | 15.789 | 70.5% |
| 363 | Battle Creek, MI | 78,393 | 137.3 | 53.0 | 570.9 | 1,478.5 | 52,347 | 66.8% | 42.606 | 80.4% |
| 364 | Bowling Green, KY | 78,306 | 117.6 | 45.4 | 665.9 | 1,724.7 | 58,067 | 74.2% | 37.782 | 83.2% |
| 365 | Texarkana–Texarkana, TX–AR | 78,162 | 166.8 | 64.4 | 468.6 | 1,213.6 | 36,411 | 46.6% | 29.041 | 45.1% |
| 366 | Lebanon, PA | 77,086 | 116.7 | 45.1 | 660.3 | 1,710.1 | 25,477 | 33.1% | 4.167 | 9.2% |
| 367 | Valdosta, GA | 77,085 | 144.3 | 55.7 | 534.2 | 1,383.6 | 54,518 | 70.7% | 35.826 | 64.3% |
| 368 | Florence, AL | 77,074 | 160.9 | 62.1 | 478.9 | 1,240.3 | 39,319 | 51% | 25.997 | 41.9% |
| 369 | Newark, OH | 76,068 | 109.1 | 42.1 | 697.2 | 1,805.8 | 47,573 | 62.5% | 20.884 | 49.6% |
| 370 | Anderson, SC | 75,702 | 191.9 | 74.1 | 394.5 | 1,021.8 | 26,686 | 35.3% | 14.595 | 19.7% |
| 371 | Williamsburg, VA | 75,689 | 144.8 | 55.9 | 522.6 | 1,353.5 | 14,068 | 18.6% | 9.022 | 16.1% |
| 372 | Mansfield, OH | 75,250 | 130.3 | 50.3 | 577.4 | 1,495.6 | 47,821 | 63.5% | 30.872 | 61.4% |
| 373 | Lake Jackson–Angleton, TX | 74,830 | 108.0 | 41.7 | 693.0 | 1,795.0 | 26,849 | 35.9% | 19.441 | 46.6% |
| 374 | Auburn, AL | 74,741 | 129.3 | 49.9 | 578.2 | 1,497.6 | 53,380 | 71.4% | 58.067 | 116.4% |
| 375 | Wausau, WI | 74,632 | 121.4 | 46.9 | 614.8 | 1,592.4 | 39,106 | 52.4% | 18.778 | 40.0% |
| 376 | Oshkosh, WI | 74,495 | 79.8 | 30.8 | 933.7 | 2,418.2 | 66,083 | 88.7% | 25.591 | 83.1% |
| 377 | Cheyenne, WY | 73,588 | 91.0 | 35.1 | 808.7 | 2,094.6 | 59,466 | 80.8% | 24.521 | 69.9% |
| 378 | Watsonville, CA | 73,534 | 59.2 | 22.8 | 1,243.1 | 3,219.5 | 51,199 | 69.6% | 6.687 | 29.3% |
| 379 | Elizabethtown–Radcliff, KY | 73,467 | 147.5 | 57.0 | 498.0 | 1,289.8 | 28,531 | 38.8% | 25.359 | 44.5% |
| 380 | Sumter, SC | 73,107 | 170.1 | 65.7 | 429.7 | 1,113.0 | 40,524 | 55.4% | 32.086 | 48.8% |
| 381 | Lima, OH | 72,852 | 135.6 | 52.4 | 537.4 | 1,391.7 | 38,771 | 53.2% | 13.565 | 25.9% |
| 382 | Davis, CA | 72,794 | 36.6 | 14.1 | 1,991.0 | 5,156.6 | 65,622 | 90.1% | 9.887 | 70.1% |
| 383 | Westminster–Eldersburg, MD | 72,714 | 149.4 | 57.7 | 486.6 | 1,260.2 | 18,590 | 25.6% | 6.629 | 11.5% |
| 384 | Flagstaff, AZ | 71,957 | 90.2 | 34.8 | 797.8 | 2,066.2 | 65,870 | 91.5% | 63.871 | 183.5% |
| 385 | Jackson, TN | 71,880 | 132.5 | 51.1 | 542.7 | 1,405.5 | 65,211 | 90.7% | 53.73 | 105.1% |
| 386 | Camarillo, CA | 71,772 | 57.0 | 22.0 | 1,259.9 | 3,263.0 | 65,201 | 90.8% | 19.528 | 88.8% |
| 387 | Florida–Imbery–Barceloneta, PR | 71,747 | 118.6 | 45.8 | 604.7 | 1,566.2 | 12,680 | 17.7% | 1.51 | 3.3% |
| 388 | Sheboygan, WI | 71,313 | 86.6 | 33.4 | 823.5 | 2,132.9 | 49,288 | 69.1% | 13.974 | 41.8% |
| 389 | Weirton–Steubenville, WV–OH–PA | 70,889 | 130.8 | 50.5 | 541.9 | 1,403.6 | 19,746 | 27.9% | 18.054 | 35.8% |
| 390 | Bay City, MI | 70,585 | 104.4 | 40.3 | 675.8 | 1,750.3 | 34,932 | 49.5% | 10.17 | 25.2% |
| 391 | Owensboro, KY | 70,543 | 87.6 | 33.8 | 805.4 | 2,086.0 | 57,265 | 81.2% | 19.094 | 56.5% |
| 392 | Decatur, AL | 70,436 | 151.0 | 58.3 | 466.6 | 1,208.4 | 55,683 | 79.1% | 53.673 | 92.1% |
| 393 | Morgantown, WV | 70,350 | 97.1 | 37.5 | 724.4 | 1,876.3 | 29,660 | 42.2% | 10.168 | 27.1% |
| 394 | Porterville, CA | 70,272 | 53.1 | 20.5 | 1,322.6 | 3,425.5 | 54,165 | 77.1% | 17.607 | 85.9% |
| 395 | Pocatello, ID | 69,809 | 80.3 | 31.0 | 869.2 | 2,251.3 | 54,255 | 77.7% | 32.222 | 103.9% |
| 396 | Janesville, WI | 69,658 | 79.7 | 30.8 | 873.9 | 2,263.4 | 63,575 | 91.3% | 33.859 | 109.9% |
| 397 | Bristol–Bristol, TN–VA | 69,501 | 165.5 | 63.9 | 420.0 | 1,087.8 | 26,702 | 38.4% | 32.297 | 50.5% |
| 398 | Winchester, VA | 69,449 | 96.3 | 37.2 | 721.1 | 1,867.7 | 26,203 | 37.7% | 9.233 | 24.8% |
| 399 | St. Augustine, FL | 69,173 | 111.5 | 43.1 | 620.3 | 1,606.5 | 12,975 | 18.8% | 9.428 | 21.9% |
| 400 | Johnstown, PA | 69,014 | 100.0 | 38.6 | 690.1 | 1,787.2 | 20,978 | 30.4% | 5.893 | 15.3% |
| 401 | Hilton Head Island, SC | 68,998 | 175.1 | 67.6 | 394.0 | 1,020.4 | 37,099 | 53.8% | 41.363 | 61.2% |
| 402 | Dothan, AL | 68,781 | 143.7 | 55.5 | 478.5 | 1,239.3 | 65,496 | 95.2% | 89.399 | 161.1% |
| 403 | Lodi, CA | 68,738 | 41.2 | 15.9 | 1,668.1 | 4,320.3 | 62,134 | 90.4% | 13.611 | 85.6% |
| 404 | DeKalb, IL | 68,545 | 66.8 | 25.8 | 1,026.3 | 2,658.1 | 43,862 | 64% | 14.651 | 56.8% |
| 405 | West Bend, WI | 68,444 | 99.7 | 38.5 | 686.6 | 1,778.3 | 31,078 | 45.4% | 14.565 | 37.8% |
| 406 | Rocky Mount, NC | 68,243 | 119.0 | 46.0 | 573.2 | 1,484.7 | 57,477 | 84.2% | 43.788 | 95.2% |
| 407 | Elmira, NY | 67,983 | 97.9 | 37.8 | 694.4 | 1,798.6 | 29,200 | 43% | 7.249 | 19.2% |
| 408 | Carbondale, IL | 67,821 | 126.1 | 48.7 | 538.0 | 1,393.3 | 25,902 | 38.2% | 17.085 | 35.1% |
| 409 | Dubuque, IA–IL | 67,818 | 87.5 | 33.8 | 774.9 | 2,007.0 | 57,637 | 85% | 29.968 | 88.7% |
| 410 | Hammond, LA | 67,629 | 198.5 | 76.6 | 340.7 | 882.5 | 20,019 | 29.6% | 14.014 | 18.3% |
| 411 | Parkersburg, WV–OH | 67,229 | 109.8 | 42.4 | 612.4 | 1,586.2 | 31,492 | 46.8% | 11.82 | 27.9% |
| 412 | Wenatchee, WA | 67,227 | 81.3 | 31.4 | 827.3 | 2,142.8 | 31,925 | 47.5% | 7.767 | 24.7% |
| 413 | Harrisonburg, VA | 66,784 | 84.3 | 32.6 | 792.2 | 2,051.8 | 48,914 | 73.2% | 17.418 | 53.4% |
| 414 | Cleveland, TN | 66,777 | 141.4 | 54.6 | 472.2 | 1,223.0 | 41,285 | 61.8% | 26.892 | 49.3% |
| 415 | Zephyrhills, FL | 66,609 | 112.7 | 43.5 | 591.3 | 1,531.4 | 13,288 | 19.9% | 8.878 | 20.4% |
| 416 | Hanover, PA | 66,301 | 93.5 | 36.1 | 709.2 | 1,836.8 | 15,289 | 23.1% | 3.713 | 10.3% |
| 417 | Monessen–California, PA | 66,086 | 115.8 | 44.7 | 570.6 | 1,477.9 | 7,720 | 11.7% | 2.887 | 6.5% |
| 418 | Michigan City–La Porte, IN–MI | 66,025 | 100.9 | 39.0 | 654.4 | 1,694.8 | 31,479 | 47.7% | 20.41 | 52.3% |
| 419 | Glens Falls, NY | 65,443 | 107.6 | 41.6 | 608.1 | 1,575.0 | 14,700 | 22.5% | 3.851 | 9.3% |
| 420 | Jonesboro, AR | 65,419 | 121.6 | 47.0 | 538.0 | 1,393.5 | 67,263 | 102.8% | 79.869 | 169.9% |
| 421 | Conway, AR | 65,277 | 102.8 | 39.7 | 634.9 | 1,644.3 | 58,908 | 90.2% | 45.341 | 114.2% |
| 422 | Great Falls, MT | 65,207 | 80.6 | 31.1 | 809.2 | 2,095.7 | 58,505 | 89.7% | 21.79 | 70.1% |
| 423 | Paso Robles–Atascadero, CA | 65,088 | 81.4 | 31.4 | 799.2 | 2,069.9 | 29,793 | 45.8% | 19.65 | 62.6% |
| 424 | Casper, WY | 64,548 | 78.6 | 30.3 | 821.4 | 2,127.3 | 55,316 | 85.7% | 26.904 | 88.8% |
| 425 | Fairbanks, AK | 64,513 | 142.8 | 55.1 | 451.9 | 1,170.4 | 31,535 | 48.9% | 31.693 | 57.5% |
| 426 | Gadsden, AL | 64,172 | 186.6 | 72.0 | 343.9 | 890.8 | 36,856 | 57.4% | 37.161 | 51.6% |
| 427 | Saratoga Springs, NY | 64,100 | 117.8 | 45.5 | 544.1 | 1,409.3 | 26,586 | 41.5% | 28.065 | 61.7% |
| 428 | Petaluma, CA | 64,078 | 55.2 | 21.3 | 1,161.2 | 3,007.6 | 57,941 | 90.4% | 14.382 | 67.5% |
| 429 | Twin Rivers–Hightstown, NJ | 64,037 | 91.3 | 35.2 | 701.7 | 1,817.3 | 7,443 | 11.6% | 1.28 | 3.6% |
| 430 | Beckley, WV | 64,022 | 157.9 | 61.0 | 405.4 | 1,050.0 | 17,614 | 27.5% | 9.49 | 15.6% |
| 431 | Longview, WA–OR | 63,952 | 85.1 | 32.9 | 751.4 | 1,946.1 | 36,648 | 57.3% | 14.485 | 44.0% |
| 432 | Beloit, WI–IL | 63,835 | 89.0 | 34.4 | 717.5 | 1,858.4 | 36,966 | 57.9% | 17.373 | 50.5% |
| 433 | Los Lunas, NM | 63,758 | 179.4 | 69.3 | 355.4 | 920.5 | 14,835 | 23.3% | 14.634 | 21.1% |
| 434 | Victoria, TX | 63,683 | 75.2 | 29.0 | 847.2 | 2,194.2 | 62,592 | 98.3% | 35.48 | 122.3% |
| 435 | Mount Vernon, WA | 62,966 | 89.3 | 34.5 | 705.3 | 1,826.6 | 31,743 | 50.4% | 12.302 | 35.7% |
| 436 | Corvallis, OR | 62,433 | 54.7 | 21.1 | 1,141.7 | 2,956.9 | 54,462 | 87.2% | 14.13 | 67.0% |
| 437 | Kokomo, IN | 62,182 | 93.9 | 36.3 | 662.0 | 1,714.7 | 45,468 | 73.1% | 18.497 | 51.0% |
| 438 | Sherman–Denison, TX | 61,900 | 93.1 | 35.9 | 665.2 | 1,722.9 | 38,521 | 62.2% | 41.388 | 115.3% |
| 439 | Sebring–Avon Park, FL | 61,625 | 119.6 | 46.2 | 515.3 | 1,334.7 | 10,491 | 17% | 9.978 | 21.6% |
| 440 | Grand Forks, ND–MN | 61,270 | 63.3 | 24.4 | 967.8 | 2,506.6 | 52,838 | 86.2% | 19.905 | 81.6% |
| 441 | Bangor, ME | 61,210 | 110.1 | 42.5 | 556.0 | 1,440.0 | 33,039 | 54% | 34.261 | 80.6% |
| 442 | Goldsboro, NC | 61,054 | 137.0 | 52.9 | 445.5 | 1,153.8 | 36,437 | 59.7% | 28.142 | 53.2% |
| 443 | Benton Harbor–St. Joseph–Fair Plain, MI | 61,022 | 120.9 | 46.7 | 504.8 | 1,307.5 | 10,038 | 16.4% | 4.427 | 9.5% |
| 444 | Rome, GA | 60,851 | 123.5 | 47.7 | 492.9 | 1,276.6 | 36,303 | 59.7% | 30.911 | 64.8% |
| 445 | Ames, IA | 60,438 | 60.2 | 23.2 | 1,004.5 | 2,601.7 | 58,965 | 97.6% | 24.214 | 104.4% |
| 446 | Lewiston, ME | 59,397 | 91.7 | 35.4 | 647.9 | 1,678.0 | 36,592 | 61.6% | 34.147 | 96.5% |
| 447 | San Luis Obispo, CA | 59,219 | 52.9 | 20.4 | 1,120.1 | 2,900.9 | 45,119 | 76.2% | 12.777 | 62.6% |
| 448 | Pittsfield, MA | 59,124 | 86.8 | 33.5 | 681.4 | 1,764.9 | 44,737 | 75.7% | 40.469 | 120.8% |
| 449 | Morristown, TN | 59,036 | 155.0 | 59.8 | 380.9 | 986.5 | 29,137 | 49.4% | 27.902 | 46.7% |
| 450 | Midland, MI | 59,014 | 116.2 | 44.9 | 507.8 | 1,315.2 | 41,863 | 70.9% | 33.695 | 75.0% |
| 451 | Lexington Park–California–Chesapeake Ranch Estates, MD | 58,875 | 129.3 | 49.9 | 455.2 | 1,179.0 | 11,626 | 19.7% | 5.621 | 11.3% |
| 452 | Jefferson City, MO | 58,533 | 103.6 | 40.0 | 565.1 | 1,463.7 | 43,079 | 73.6% | 36.05 | 90.1% |
| 453 | Middletown, NY | 58,381 | 81.1 | 31.3 | 719.8 | 1,864.3 | 28,086 | 48.1% | 5.076 | 16.2% |
| 454 | Carson City, NV | 58,079 | 59.8 | 23.1 | 971.3 | 2,515.7 | 55,274 | 95.2% | 144.66 | 626.2% |
| 455 | Watertown, NY | 57,840 | 106.0 | 40.9 | 545.5 | 1,412.7 | 27,023 | 46.7% | 9.02 | 22.1% |
| 456 | Mankato, MN | 57,584 | 68.3 | 26.4 | 843.0 | 2,183.4 | 39,309 | 68.3% | 17.906 | 67.8% |
| 457 | Kingston, NY | 57,442 | 110.9 | 42.8 | 517.7 | 1,340.9 | 23,893 | 41.6% | 7.486 | 17.5% |
| 458 | Daphne–Fairhope, AL | 57,383 | 143.1 | 55.3 | 401.0 | 1,038.7 | 21,570 | 37.6% | 16.241 | 29.4% |
| 459 | Albany, OR | 56,997 | 62.1 | 24.0 | 918.4 | 2,378.6 | 50,158 | 88% | 17.537 | 73.1% |
| 460 | Hazleton, PA | 56,827 | 80.9 | 31.2 | 702.5 | 1,819.5 | 25,340 | 44.6% | 6.011 | 19.3% |
| 461 | Staunton–Waynesboro, VA | 56,611 | 98.8 | 38.1 | 573.2 | 1,484.5 | 23,746 | 41.9% | 19.975 | 52.4% |
| 462 | Williamsport, PA | 56,142 | 68.6 | 26.5 | 818.0 | 2,118.7 | 29,381 | 52.3% | 8.731 | 32.9% |
| 463 | Kahului, HI | 55,934 | 43.2 | 16.7 | 1,294.9 | 3,353.9 | 26,337 | 47.1% | 14.447 | 86.5% |
| 464 | Walla Walla, WA–OR | 55,805 | 71.7 | 27.7 | 778.8 | 2,017.0 | 31,731 | 56.9% | 12.805 | 46.2% |
| 465 | Woodland, CA | 55,513 | 31.6 | 12.2 | 1,757.1 | 4,550.8 | 55,468 | 99.9% | 15.303 | 125.4% |
| 466 | Hot Springs, AR | 55,121 | 116.4 | 44.9 | 473.7 | 1,227.0 | 35,193 | 63.8% | 35.016 | 78.0% |
| 467 | Columbus, IN | 54,933 | 70.6 | 27.3 | 778.3 | 2,015.8 | 44,061 | 80.2% | 27.497 | 100.7% |
| 468 | Fond du Lac, WI | 54,901 | 74.7 | 28.9 | 734.7 | 1,903.0 | 43,021 | 78.4% | 18.824 | 65.1% |
| 469 | Manhattan, KS | 54,622 | 53.6 | 20.7 | 1,018.2 | 2,637.0 | 52,281 | 95.7% | 18.762 | 90.6% |
| 470 | Titusville, FL | 54,386 | 77.9 | 30.1 | 698.3 | 1,808.7 | 43,761 | 80.5% | 29.372 | 97.6% |
| 471 | Delano, CA | 54,372 | 25.7 | 9.9 | 2,116.9 | 5,482.7 | 53,041 | 97.6% | 14.303 | 144.5% |
| 472 | East Stroudsburg, PA–NJ | 54,316 | 134.9 | 52.1 | 402.5 | 1,042.5 | 9,840 | 18.1% | 2.844 | 5.5% |
| 473 | Ithaca, NY | 53,661 | 63.7 | 24.6 | 842.9 | 2,183.1 | 32,108 | 59.8% | 5.388 | 21.9% |
| 474 | Bloomsburg–Berwick, PA | 53,618 | 84.7 | 32.7 | 633.4 | 1,640.5 | 14,855 | 27.7% | 4.35 | 13.3% |
| 475 | Pine Bluff, AR | 53,495 | 96.3 | 37.2 | 555.5 | 1,438.7 | 49,083 | 91.8% | 44.576 | 119.8% |
| 476 | Lake Havasu City, AZ | 53,427 | 76.5 | 29.5 | 698.3 | 1,808.5 | 52,527 | 98.3% | 46.34 | 157.1% |
| 477 | Farmington, NM | 53,049 | 90.4 | 34.9 | 587.1 | 1,520.5 | 45,877 | 86.5% | 31.509 | 90.3% |
| 478 | Cape Girardeau, MO–IL | 52,900 | 90.7 | 35.0 | 583.0 | 1,510.1 | 37,941 | 71.7% | 28.429 | 81.2% |
| 479 | San Marcos, TX | 52,826 | 68.9 | 26.6 | 767.2 | 1,987.1 | 44,894 | 85% | 30.219 | 113.6% |
| 480 | Sierra Vista, AZ | 52,745 | 78.4 | 30.3 | 672.6 | 1,741.9 | 43,888 | 83.2% | 152.274 | 502.6% |
| 481 | Cartersville, GA | 52,477 | 131.1 | 50.6 | 400.4 | 1,037.1 | 19,731 | 37.6% | 29.147 | 57.6% |
| 482 | Arroyo Grande–Grover Beach, CA | 52,000 | 59.6 | 23.0 | 872.2 | 2,259.0 | 17,252 | 33.2% | 5.835 | 25.4% |
| 483 | Lewiston, ID–WA | 51,924 | 73.1 | 28.2 | 710.4 | 1,839.9 | 31,894 | 61.4% | 17.231 | 61.1% |
| 484 | Cumberland, MD–WV–PA | 51,899 | 84.5 | 32.6 | 614.1 | 1,590.5 | 20,859 | 40.2% | 10.083 | 30.9% |
| 485 | Lompoc, CA | 51,509 | 27.7 | 10.7 | 1,859.4 | 4,815.7 | 42,434 | 82.4% | 11.597 | 108.4% |
| 486 | Hinesville, GA | 51,456 | 80.7 | 31.1 | 637.9 | 1,652.3 | 33,437 | 65% | 20.372 | 65.5% |
| 487 | Uniontown–Connellsville, PA | 51,370 | 100.6 | 38.8 | 510.9 | 1,323.2 | 10,372 | 20.2% | 2.041 | 5.3% |
| 488 | Casa Grande, AZ | 51,331 | 57.7 | 22.3 | 890.1 | 2,305.4 | 48,571 | 94.6% | 109.669 | 491.8% |
| 489 | Villas, NJ | 51,291 | 87.7 | 33.9 | 584.6 | 1,514.0 | 9,483 | 18.5% | 3.883 | 11.5% |
| 490 | Monroe, MI | 51,240 | 83.1 | 32.1 | 616.3 | 1,596.3 | 20,733 | 40.5% | 9.166 | 28.6% |
| 491 | Brunswick, GA | 51,024 | 112.4 | 43.4 | 454.1 | 1,176.2 | 15,383 | 30.1% | 17.073 | 39.3% |
| 492 | Danville, IL | 50,996 | 77.2 | 29.8 | 660.6 | 1,710.9 | 33,027 | 64.8% | 17.888 | 60.0% |
| 493 | Chambersburg, PA | 50,887 | 96.8 | 37.4 | 525.8 | 1,361.7 | 20,268 | 39.8% | 6.925 | 18.5% |
| 494 | Grants Pass, OR | 50,520 | 70.4 | 27.2 | 717.2 | 1,857.7 | 34,533 | 68.4% | 10.87 | 40.0% |
| 495 | New Bern, NC | 50,503 | 112.4 | 43.4 | 449.2 | 1,163.4 | 29,524 | 58.5% | 28.23 | 65.0% |
| 496 | Grand Island, NE | 50,440 | 72.9 | 28.1 | 692.3 | 1,793.1 | 48,520 | 96.2% | 28.408 | 101.1% |
| 497 | Pascagoula, MS | 50,428 | 102.4 | 39.5 | 492.4 | 1,275.4 | 22,392 | 44.4% | 15.38 | 38.9% |
Images
-
 1 - New York City, New York
 -
 2 – Los Angeles, California
 -
 3 – Chicago, Illinois
 -
 4 – Miami, Florida
 -
 5 – Philadelphia, Pennsylvania
 -
 6 – Dallas, Texas
 -
 7 – San Francisco, California
 -
 8 – Houston, Texas
 -
 9 – Washington, D.C.
 -
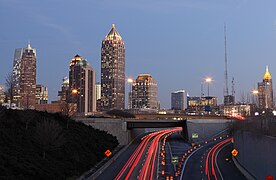 10 – Atlanta, Georgia
 -
 11 – Boston, Massachusetts
 -
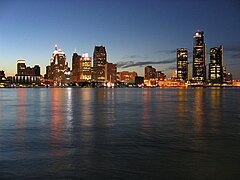 12 – Detroit, Michigan
 -
 13 – Phoenix, Arizona
 -
 14 – Seattle, Washington
 -
 15 – San Diego, California
 -
 16 – Minneapolis, Minnesota
 -
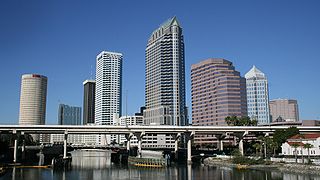 17 – Tampa, Florida
 -
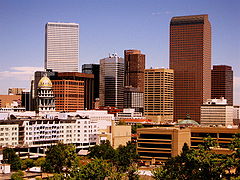 18 – Denver, Colorado
 -
 19 – Baltimore, Maryland
 -
 20 – St Louis, Missouri
 -

-
 23 - Las Vegas, Nevada
 -
 24 - Portland, Oregon
 -
 25 - Cleveland, Ohio
 -
 26 - San Antonio, Texas
 -
-

-
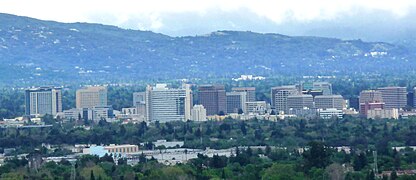 29 - San Jose, California
 -
 30 - Cincinnati, Ohio
 -

-
 32 - Orlando, Florida
 -
 33 - Indianapolis, Indiana
 -
-
 35 - Milwaukee, Wisconsin
 -
 36 - Columbus, Ohio
 -
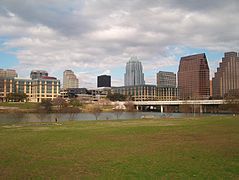 37 - Austin, Texas
 -

-

-
-
 41 - Memphis, Tennessee
 -
 42 - Salt Lake City, Utah
 -
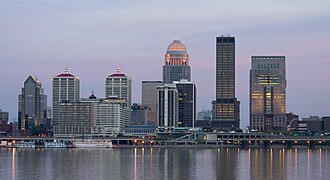 43 - Louisville, Kentucky
 -
 44 - Nashville, Tennessee
 -
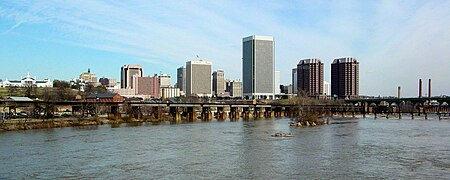 45 - Richmond, Virginia
 -
 46 - Buffalo, New York
 -

-
 49 - New Orleans, Louisiana
 -
-
 51 - Oklahoma City, Oklahoma
 -
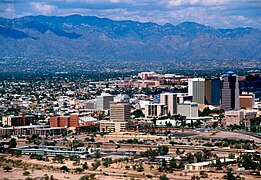 52 - Tucson, Arizona


.jpg)


2010 urban agglomerations
| Rank | Potential urban agglomeration | Census 2000 UAs contained within the potential agglomeration | Estimated population (2006–2008) |
|---|---|---|---|
| 1 | New York-Philadelphia-Connecticut | New York-Newark, NY-NJ-CT; Philadelphia-Camden, PA-NJ-DE-MD; Allentown-Bethlehem PA-NJ; Lancaster, PA; Pottstown, PA; Reading, PA; Trenton, NJ; Hightstown, NJ; Vineland, NJ; Poughkeepsie-Newburgh, NY; Bridgeport-Stamford, CT; Danbury, CT-NY; Hartford, CT; New Haven, CT; Norwich-New London, CT; Waterbury, CT; Springfield, MA-CT | 29,028,337 |
| 2 | Los Angeles-Riverside-San Bernardino | Los Angeles-Long Beach-Santa Ana, CA; Riverside-San Bernardino, CA; Camarillo, CA; Hemet, CA; Oxnard, CA; Santa Barbara, CA; Santa Clarita, CA; Simi Valley, CA; Temecula-Murrieta, CA; Thousand Oaks, CA | 15,492,749 |
| 3 | Chicago-Kenosha-Racine-Round Lake Beach | Chicago, IL-IN; Kenosha, WI; Round Lake Beach-McHenry-Grayslake, IL-WI; Racine, WI | 8,944,789 |
| 4 | Boston-Providence-Worcester | Boston, MA; Providence, RI-MA; Worcester, MA-CT; Barnstable Town, MA; Leominster-Fitchburg, MA; New Bedford, MA; Dover-Rochester, NH; Manchester, NH; Nashua, NH; Portsmouth, NH | 6,692,295 |
| 5 | Baltimore-Washington | Aberdeen, MD; Baltimore, MD; Washington, DC-VA-MD; St. Charles, MD | 6,585,315 |
| 6 | San Francisco-Oakland-San Jose | San Francisco-Oakland, CA; San Jose, CA; Antioch, CA; Concord, CA; Livermore, CA; Vallejo, CA | 5,870,212 |
| 7 | Miami-Ft. Lauderdale-Pompano Beach-West Palm Beach-Homestead | Miami-Ft. Lauderdale-Pompano Beach-West Palm Beach-Homestead, FL | 5,334,685 |
| 8 | Dallas-Fort Worth | Dallas-Fort Worth-Arlington, TX; Denton-Lewisville, TX; McKinney, TX | 5,006,527 |
| 9 | Houston-Texas City | Houston, TX; Texas City, TX; Galveston, TX; The Woodlands, TX | 4,599,176 |
| 10 | Detroit-Ann Arbor-Port Huron | Detroit, MI; Ann Arbor, MI; Port Huron, MI; South Lyon-Howell-Brighton, MI | 4,326,040 |
| 11 | Atlanta-Gainesville | Atlanta, GA; Gainesville, GA | 4,196,670 |
| - | San Juan-Aguadilla-Ponce | San Juan, PR; Aguadilla-Isabela-San Sebastián, PR; Arecibo, PR; Fajardo, PR; Florida-Barceloneta-Bajadero, PR; Guayama, PR; Juana Díaz, PR; Mayagüez, PR; Ponce, PR; San Germán-Cabo Rojo-Sabana Grande, PR; Yauco, PR | 3,591,491 |
| 12 | Phoenix-Mesa-Avondale | Phoenix-Mesa, AZ; Avondale-Goodyear, AZ | 3,328,183 |
| 13 | San Diego-Mission Viejo | San Diego, CA; Mission Viejo, CA | 3,273,255 |
| 14 | Seattle-Bremerton-Marysville | Seattle, WA; Bremerton, WA; Marysville, WA | 3,206,057 |
| 15 | Cleveland-Akron-Canton-Lorain-Elyria | Cleveland, OH; Akron, OH; Canton, OH; Lorain-Elyria, OH | 2,722,194 |
| 16 | Tampa-St. Petersburg-Lakeland-Winter Haven | Tampa-St. Petersburg, FL; Lakeland, FL; Winter Haven, FL; Brooksville, FL | 2,719,812 |
| 17 | Cincinnati-Dayton-Middletown | Cincinnati, OH-KY-IN; Dayton, OH; Middletown, OH; Springfield, OH | 2,426,070 |
| 18 | Denver-Boulder-Longmont | Denver-Aurora, CO; Boulder, CO; Longmont, CO; Lafayette-Louisville, CO | 2,339,587 |
| 19 | St. Louis-Alton | St. Louis, MO-IL; Alton, IL | 2,184,037 |
| 20 | Orlando-Ocala-Kissimmee | Orlando, FL; Ocala, FL; Kissimmee, FL; Lady Lake, FL; Leesburg-Eustis, FL | 1,814,061 |
| 21 | Pittsburgh-Uniontown-Monessen | Pittsburgh, PA; Uniontown-Connellsville, PA; Monessen, PA | 1,792,892 |
| 22 | Kansas City-Lee's Summit | Kansas City, MO-KS; Lee's Summit, MO | 1,468,106 |
| 23 | Salt Lake City-Ogden-Layton | Salt Lake City, UT; Ogden-Layton, UT | 1,439,004 |
| 24 | Indianapolis-Anderson | Indianapolis, IN; Anderson, IN | 1,367,392 |
| 25 | Charlotte-Gastonia-Concord | Charlotte, NC-SC; Gastonia, NC; Concord, NC; Rock Hill, SC | 1,282,839 |
| 26 | Nashville-Murfreesboro | Nashville-Davidson, TN; Murfreesboro, TN | 983,180 |
See also
- Outline of the United States
- Index of United States-related articles
- Geography
- United States
- Office of Management and Budget
- United States urban area (list)
Notes
- ^ In order to match the official lists from the U.S. Census Bureau and provide less clutter in the table, postal code abbreviations for the names of states are used in this column. For a list of the states and abbreviations used, please see the table below the map at this list of U.S. States.
- ^ a b The urban area is anchored by 3 adjacent cities.
References
- ^ "U.S. Census Urban Areas - UCLA Geoportal". apps.gis.ucla.edu. Retrieved 2022-06-22.
- ^ "Census Urban Area List". United States Census Bureau. Retrieved September 30, 2016.
- ^ "Proposed Urban Area Criteria for the 2010 Census" (PDF). United States Census Bureau. Retrieved October 28, 2020.
- ^ "Metropolitan and NECTA Divisions published by CES". U.S. Bureau of Labor Statistics. January 28, 2011.
- ^ "May 2009 Metropolitan and Nonmetropolitan Area Definitions". U.S. Bureau of Labor Statistics. August 16, 2010.
Works cited
- U.S. Census Bureau: List of Populations of Urbanized Areas
- 2010 Census Urban and Rural Classification and Urban Area Criteria
- Proposed Urban Area Criteria for the 2010 Census
External links
 Definitions from Wiktionary
 Media from Commons
 News from Wikinews
 Quotations from Wikiquote
 Texts from Wikisource
 Textbooks from Wikibooks
 Resources from Wikiversity