Computer graphics
The computer graphics is a branch of computer science that deals with the computer-based imaging , in the broad sense, with the image processing is concerned. Images created using computer graphics are called computer graphics .
Computer graphics include, on the one hand, the generation of graphics , the components of which can be described two-dimensionally in the plane. Other sub-areas deal with the question of how complex shapes can be modeled geometrically and how images or animations can be calculated ( rendered ) from virtual environments built from them .
Computer graphics have their origins in the 1950s, when computers were equipped with graphic output devices . As a result, input devices were developed that enabled the interactive operation of computers and, above all, paved the way for scientific and technical applications such as CAD and CAM . Today computer graphics are ubiquitous; Their applications range from graphical user interfaces to printed products, computer games and film technology to medicine.
history
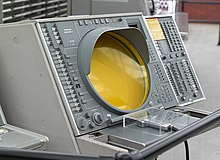
The beginning of computer graphics is often considered to be the Whirlwind , developed at MIT in the early 1950s , which was the first computer to have a cathode ray tube screen and an input device similar to a light pen , and which led directly to the SAGE interactive air surveillance system. The first commercial vector screens that could display dots and lines also appeared. At the same time, General Motors developed the first interactive CAD system, the DAC-1 .
Ivan Sutherland 's sketchpad drawing system, introduced in 1963, had a particular influence on the development of interactive computer graphics . It showed many possibilities of interaction that are also common in modern graphics software . Since punch cards were still used predominantly in the early 1960s, there was a demand for interactive user interfaces , but such systems were extremely expensive. This changed towards the end of the decade, as the first computer terminals with storage tubes graphics screens ( Direct-View Storage Tubes ) appeared on the market and tens of thousands of users allowed an affordable access to computer graphics. Important 3D computer graphics methods such as ray tracing and scanline algorithms were also developed at this time .
In the 1980s, other input devices such as mouse and graphics tablet became popular ; and color printers came onto the market. At the same time, vector screens were gradually being replaced by raster screens that could display filled areas. In 1974 ACM SIGGRAPH , now the largest association of researchers and industry representatives in the computer graphics field, held its first conference. The personal computer , which was mass-produced from the end of the 1970s , had comparatively poor graphics capabilities, but it drove manufacturers to produce inexpensive plotters and graphics tablets, thus making a decisive contribution to the spread of computer graphics.
The system performance of PCs and workstations soared in the 1980s that end users could now create computer graphics with easy-to-use programs. In addition, the important areas of application CAD and CAM achieved a breakthrough. The first 3D graphics software came onto the market for both these and other applications . Artistic applications had always accompanied computer graphics, but now opened up a market as Computer Generated Imagery for the film and advertising industries.
In the 1990s, conventional computers achieved sufficient performance to be able to combine different technologies, such as computer graphics and image processing or image and sound content. Under the catchphrase multimedia , the boundaries between pure computer graphics and other areas became blurred. Over the course of the decade, the weight shifted from scientific and technical to non-technical areas of application. This was noticeable, among other things, in the fact that fully computer-generated feature-length films were produced. In the mid-1990s, hardware acceleration for 3D computer graphics was also introduced in the non-professional sector .
Since the beginning of the 21st century, there has been a lively interest in high-contrast images ( high dynamic range images ) in both photography and image synthesis . Real-time graphics benefit from powerful graphics processors that can create a variety of effects using programmable shaders . Efforts to calculate the global lighting , which is often indispensable for a realistic effect, in real time have so far (2010) only partially succeeded.
Two-dimensional graphics
Raster and vector graphics
Since the 1980s, only raster screens have been customary in which the image to be displayed is represented by a raster of image points ( pixels ), each of which is assigned a color value. Images that exist in this form are called raster graphics . They can be generated by software or the result of digitization . An important advantage of raster screens is the ability to display colored filled areas. Many printers and other output devices also use a dot matrix. However, raster graphics suffer from display problems such as the staircase effect , which is a result of the limited image resolution (number of pixels). The visible part of the frame buffer , a special memory area of the graphics card, contains the image displayed on the screen in a device-dependent data format .
Several standardized file formats have been developed for permanent storage and cross-system exchange of raster graphics . These graphic formats vary considerably in their properties, for example in the support of various image compression methods. For reasons of storage space, indexed colors are often used in graphics files , in which the colors used in the image are stored in a separate table. Raster graphics can also contain an alpha channel that indicates the “transparency” of each pixel.
Some types of images, such as line drawings or charts, are better saved as vector graphics . In this case, no pixels are saved , but the basic graphic objects ( primitives ) that make up the image. This type of representation is independent of the image resolution and allows loss-free processing of the image content. In order to be able to display a vector graphic on raster screens, it must first be converted into a raster graphic. This process is called screening .
Raster algorithms

Various basic graphic objects are used for 2D vector graphics. These include lines, circles, ellipses, polygons and other curves. All of these basic objects must first be rasterized in order to be able to display them on a raster screen. Parameters such as fill and line colors, line widths and line styles must also be taken into account. When rasterizing lines , circles , ellipses and polygons , iterative (step-by-step) algorithms are often used that decide, based on the starting point, which pixel should be colored next.
The rasterization of a vector graphic often has to be limited to a certain area, for example a rectangular window . The easiest way to do this is to completely rasterize the basic objects, but only color those pixels that are actually within the desired image section. However, several more efficient methods have been developed in which a basic object is cropped to the image section before rasterization. Such clipping algorithms are used in both 2D and 3D computer graphics.
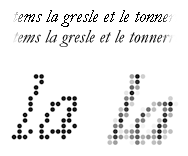
To fill any contiguous areas of color are floodfill algorithms applied. In the case of monochrome rasterization, in addition to the inevitable staircase effect, other problems such as "missing" pixels can arise due to the finite resolution of the output device. This is particularly a problem with characters. So-called hinting must be used here in order to be able to display the characters in the best possible quality even with a small font size or on low-resolution screens.
Scanning and anti-aliasing
When rasterizing an image, each pixel must be assigned a color value that represents the ideal image description at this point as well as possible. More complex image descriptions can only be evaluated at individual points, which can be interpreted as scanning in terms of signal processing . Small figures can fall through the pixel grid or aliasing effects can occur in which regularly arranged, very small image details are displayed completely incorrectly. This problem is particularly evident in computer graphics, as the ideal image tends to contain hard object edges.
Methods that attempt to mitigate the undesirable effects that occur as a result of the scan are called antialiasing . For this purpose, the image regions surrounding a pixel are included in the rasterization. Even small details flow into the color of a pixel, even if they should be between two pixels. The step effect can also be significantly reduced by using antialiasing.
Brightness and color
The color value of each pixel in a raster graphic is usually specified using red, green and blue (RGB) values. The number of values that each of these three color channels can assume is indicated by the color depth ; many screens allow 256 values per color channel ( true color ). However, the RGB color space is not the easiest to use for the user to choose colors . Other color spaces are used in drawing programs, such as the HSV color space , in which a color is defined by hue, saturation and lightness. When four-color printing is the CMYK color model worked.
The brightness of the screen pixels is not proportional to the color values specified in the framebuffer. A grayscale value of 50% is not shown on the screen as gray with 50% brightness, but rather darker. In order to output correct brightness, computer-generated images must therefore always undergo a gamma correction or - depending on the type of screen - other brightness adjustments. Color management techniques can also be used to ensure that colors are displayed as consistently as possible on different devices .
Sometimes it is necessary to reduce the number of colors in a raster graphic. This is done by means of color reduction , in which the colors that are most representative of the graphic must be selected. In addition, dithering can be used to spread the error caused by the color reduction. There are special methods for generating print rasters for output on printers .
Some graphic formats allow the color values of an image to be specified with a very high range of brightness. Such high dynamic range images (HDRIs) save a much more lifelike image impression than conventional formats and enable subsequent changes in brightness without loss of quality. However, currently (in 2010) only a few screens are capable of approximate reproduction of HDRIs.
Geometric modeling
Geometric modeling is the computer-aided description of both two-dimensional curves and three-dimensional surfaces and bodies. In addition to its use in computer graphics, it forms the basis of engineering and scientific applications, such as physical simulations.
Bodies can be represented in different ways; each representation scheme has advantages and disadvantages in terms of memory requirements, precision, and complexity. Not every scheme guarantees that physically realizable bodies are always represented. A distinction is made between direct representation schemes, in which the volume of the body itself is described, and indirect schemes, in which a body is described using its edges and surfaces. These two methods can also be combined.
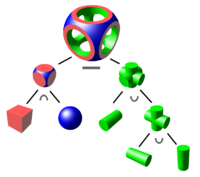
The two most commonly used representation schemes are Constructive Solid Geometry (CSG) and surface representations. CSG is a direct representation scheme in which objects are modeled with the help of basic bodies such as spheres, cuboids or cylinders. Operations such as union, intersection and difference are applied to these basic bodies, so that at the end a formula results that describes how the basic bodies are linked to one another. CSG is particularly common in the CAD area, as it can be used to describe many of the objects used there in a natural way.
In the surface representation ( Boundary Representation ) , however, a body will be described with reference to its surface; it is therefore an indirect representation scheme. The objects modeled by means of surface representation are usually composed of so-called free-form surfaces that can be deformed at control points. Local changes to the model are thus easily possible. A widespread type of freeform surfaces are Non-Uniform Rational B-Splines (NURBS). For reasons of efficiency, NURBS are usually converted (triangulated) into polygon or triangular networks before they are displayed . General two-dimensional curves are also mostly described using splines , the curve of which is determined by control points. Here, Bézier curves are used , which are converted into polygonal lines for rasterization.
The result of the 3D modeling is a scene which, in addition to the object geometry, contains material properties , light sources and the position and direction of view of a virtual observer.
Three-dimensional graphics
Based on a scene , 3D computer graphics are calculated using image synthesis, also known as rendering . In contrast to modeling, this process runs automatically. A distinction is made between the interactive synthesis of images in real time, in which mostly hardware acceleration is used, and the realistic image synthesis, in which emphasis is placed above all on high image quality or physical correctness.
Real-time rendering
In real-time rendering, a series of images is calculated at a high frame rate and the underlying scene is changed interactively by the user. With a few exceptions, graphics hardware only supports points, lines and triangles as basic graphic objects, so other display schemes must first be converted into triangular networks.
With real-time rendering, the graphics pipeline describes the path from the scene to the finished image as a model. This process is largely carried out directly in hardware by today's graphics cards . Techniques such as collision detection , animation or morphing , which change the scene and for which the application program is responsible, are an exception .
Many steps in the graphics pipeline are used to gradually express the basic objects of the scene in other coordinate systems , which simplify the calculation. This usually includes a central projection in order to obtain a perspective image. In addition, clipping and culling techniques are used to trim or remove areas outside the visible volume. After the various coordinate transformations have been completed, the projected basic objects are in the correct position on the screen. There they are rasterized by coloring the pixels belonging to them. Since only the parts that are visible to the viewer should be displayed in the case of overlapping triangles, an occlusion calculation is carried out using Z-buffering .
Graphics APIs are usually used to control graphics pipelines , which abstract the graphics hardware and relieve the programmer of many tasks. In the professional field, the OpenGL standard is of greatest importance, while programs running under Windows , especially computer games, primarily use DirectX .
Shading
As shading ( "shading") in general, the calculation of the color of surfaces using the associated material properties, and the directly arriving from the light sources is referred to. Shading is used in both real-time rendering and realistic rendering. The indirect lighting through light reflection between objects is initially not taken into account. So-called non-photorealistic rendering represents a special case , in which, for example, alienations are created for aesthetic reasons.
Local lighting models with which various materials can be simulated are used to describe the reflection behavior of a surface . The Lambertian law is suitable for example for matte surfaces such as walls, while the Phong reflection model shiny surfaces can be represented. In real-time rendering, the colors are often calculated for the corner points of a triangle and then interpolated within the triangle ( Gouraud shading ). This results in a less angular appearance than with flat shading , in which triangles are uniformly filled with one color.
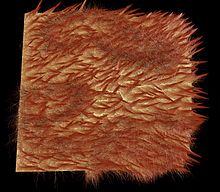
To simulate surface details, mapping techniques are used that vary the material or geometry properties at each point on the surface using a function or raster graphic. Texture mapping, for example, is used to depict a two-dimensional image (texture) on a surface. Another technique is bump mapping , which can be used to represent surface irregularities. Mirroring effects can be achieved in real-time rendering with environment mapping .
Realistic rendering
Whether a rendered image looks realistic depends largely on the extent to which the distribution of light within a scene is simulated. While with shading only the direct lighting is calculated, with indirect lighting the reflection of light between objects plays a role. This enables effects such as rooms that are only lit overall by a narrow gap. If all types of light reflection are taken into account, one speaks of global lighting . Global lighting must be taken into account for a realistic result and is not possible or only possible to a very limited extent with real-time methods. Mathematically it is described by the rendering equation .
One of the methods used in realistic image synthesis is ray tracing . Ray tracing is primarily an algorithm for computation of masking, which is based on the emission of rays, but can also compute light reflections and refractions in extended forms. To simulate global lighting, methods such as path tracing or photon mapping , which are based on ray tracing, are used.
Another algorithm for realistic image synthesis is radiosity . It is based on the division of the surfaces into small partial areas, for which the rendering equation is solved numerically . In its basic form, radiosity can only be used on ideally diffuse surfaces. In contrast to ray tracing, the light distribution is calculated independently of the point of view. This makes radiosity particularly suitable for rendering static scenes in real time, for which a time-consuming forecast is justifiable.
In the film industry, the REYES method is mainly used, in which the surfaces of the scene are broken down into very small polygons, for which the color is calculated individually.
Volume graphic
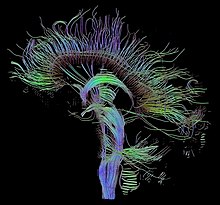
With volume graphics , the objects to be rendered are not described as surfaces, but as spatial data sets, so-called voxel grids . These are values arranged in a grid that describe the "density" of an object at a certain point. This form of data representation is particularly suitable for objects such as clouds that do not have clear outlines. Special techniques such as splatting have been developed for rendering voxel grids . Since many imaging processes generate voxel data, volume graphics are particularly important for medicine.
animation
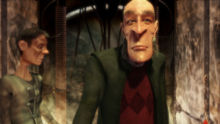
The computer-aided generation of animations requires techniques that go beyond the static modeling and synthesis of individual images. Many computer animations are based on keyframe animation , in which parameters of the scene such as the position and shape of objects or the camera viewing direction are set for only a few individual images. The values of these parameters are interpolated for the images in between using suitable splines. The rotation of objects can also be interpolated using mathematical methods.
Objects are often modeled hierarchically for animation, so that the movement of an object higher in the hierarchy affects all sub-objects. One example is a planetary system in which moons rotate around planets and these in turn rotate around the sun. In some cases, like in robotics , objects are modeled as a coherent structure, the individual parts of which are connected to one another by joints. Such structures can be animated using direct or inverse kinematics . More complex motion capture techniques are also available for character animation .
Animating multiple objects often requires collision detection techniques. In computer games in particular, artificial intelligence is also used to animate objects within the framework of group simulation so that they carry out a specific goal. With larger groups of dozen objects, swarming behavior often arises that can be plausibly simulated using comparatively simple techniques. An even higher number of objects can be described by particle systems. Forces are exerted on many thousands of very small particles in order to simulate phenomena such as explosions, liquids, smoke or fire. However, really realistic results can only be achieved with physically based techniques that require complex calculations.
Applications
imaging in medicine
Computer graphics find an important application in human-computer interaction , the branch of computer science that studies the user-friendly design of interactive systems and their user interfaces . This area was often treated together with computer graphics not only because it deals with graphical user interfaces or process visualization , but also because researchers in the field of computer graphics had early access to input and output devices that were new at the time. Computer graphics in the form of presentation graphics or in desktop publishing documents are ubiquitous.
Image processing is a related but distinct area of computer graphics . It deals with the preparation of already existing images in order to automatically evaluate their content, i.e. it performs the opposite task of computer graphics. The techniques of image processing are also used to some extent in image processing .
Visual digital art developed with the beginning of computer graphics. The artistic design of computer graphics is used in computer games that use increasingly complex 3D models and advanced rendering algorithms. In film technology and advertising, almost all types of computer graphics technology are used to produce animated films and computer-generated imagery. Many modern films use digital compositing techniques to overlay separately filmed foreground scenes over a background.
CAD uses computer technology as a "virtual drawing board" to design machine parts and other products or to control the subsequent manufacturing processes using computer-aided manufacturing . In cartography and geographic information systems , computer graphics are used to generate both precise and schematic representations from geographical and other spatial measurement data.
Simulations and visualizations of virtual environments range from architecture to scientific and safety-critical areas. Both virtual and augmented reality focus on the interaction with the viewer, such as changing perspective when turning the head. Both 3D computer graphics and highly developed display technologies are used. While in virtual reality the worlds are completely generated in the computer, augmented reality deals with the integration of artificial objects into reality, for example via head-mounted displays .
In medicine, images that are as meaningful as possible are generated from data obtained through imaging processes . This is mainly done with the means of volume graphics.
Computer graphics is part of the computer visualistics , visual computing , media informatics and computer science courses .
literature
Books:
- Michael Bender, Manfred Brill: Computer graphics: an application-oriented textbook . Hanser, Munich 2006, ISBN 3-446-40434-1 .
- Hans-Joachim Bungartz , Michael Griebel, Christoph Zenger: Introduction to Computer Graphics: Basics, Geometric Modeling, Algorithms . 2nd Edition. Vieweg, Braunschweig / Wiesbaden 2002, ISBN 3-528-16769-6 .
- James Foley, Andries van Dam, Steven K. Feiner, John F. Hughes: Computer Graphics: Principles and Practice . 2nd Edition. Addison-Wesley, Reading 1996, ISBN 0-201-84840-6 .
- David Rogers: Procedural Elements for Computer Graphics . WCB / McGraw-Hill, Boston 1998, ISBN 0-07-053548-5 .
- Peter Shirley, Michael Gleicher, Stephen R. Marschner, Erik Reinhard, Kelvin Sung, Wiliam B. Thompson, Peter Willemsen: Fundamentals of Computer Graphics . No. 2 . AK Peters, Wellesley 2005, ISBN 1-56881-269-8 .
- Natascha Adamowsky (Ed.): Digital Modernism. Matthias Zimmermann's model worlds . Hirmer Verlag, Munich 2018, ISBN 978-3-7774-2388-3
Magazines (selection):
- ACM Transactions on Graphics, ISSN 0730-0301
- Computer Graphics Forum, ISSN 0167-7055
- IEEE Computer Graphics and Applications, ISSN 0272-1716
- IEEE Transactions on Visualization and Computer Graphics, ISSN 1077-2626
Web links
- HyperGraph - Teaching Computer Graphics - learning materials on computer graphics topics
- A Critical History of Computer Graphics and Animation - Detailed description of the history of computer graphics
- Computer graphics WBT - Web Based Training on Computer Graphics
Individual evidence
- ↑ James Foley et al. a .: Computer Graphics: Principles and Practice . P. 2
- ↑ Peter Shirley et al. a .: Fundamentals of Computer Graphics . P. 1
- ^ A b Carl Machover: Four Decades of Computer Graphics. IEEE Computer Graphics and Applications 14, 6 (November 1994): 14-19, here p. 14, ISSN 0272-1716
- ^ Carl Machover: Four Decades of Computer Graphics . P. 17
- ^ Carl Machover: Four Decades of Computer Graphics . P. 18
- ^ Max Agoston: Computer Graphics and Geometric Modeling: Implementation and Algorithms . Springer, London 2005, ISBN 1-85233-818-0 , p. 157.
- ↑ Tomas Akenine-Möller, Eric Haines: Real-Time Rendering . AK Peters, Natick MA 2002, ISBN 1-56881-182-9 , p. 7.
- ↑ Peter Shirley et al. a .: Fundamentals of Computer Graphics . P. 2
