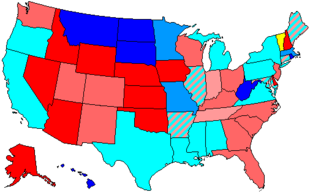
Election to the United States House of Representatives in 1994
The 1994 election to the United States House of Representatives took place on November 8, 1994, in the middle of President Bill Clinton's first term ; So it was called midterm elections ( midterm elections ).
As a result, they led to the dramatic loss of the Democratic Party , which lost 54 seats to the Republican Party . The Republicans were against it all in the 1992 election won constituencies claim. This election ended the democratic majority in the House of Representatives that had existed since 1954. This landslide victory was caused by a series of scandals in the leadership of the Democratic Party. This allowed the Republicans, under the leadership of Newt Gingrich, to wage an election campaign directed against the supposedly corrupt Washington establishment. In addition, there was the unsuccessful attempt by the Clinton administration to reform the health system with the planned introduction of compulsory health insurance, and the plans to tighten gun control , which were highly unpopular among the conservatives .
A very important factor in the choice was the religious right (the so-called "born again" or " evangelical Christians ", born-again or evangelical Christians ), which was a significant constituency of the electorate. The proportion of these voters was estimated at around 27% and had increased steadily in comparison with previous years (estimated 18% in 1988, 24% in 1992). These religious right were overwhelmingly supporters of the Republican Party (76% versus 24% Democrats).
Many well-known Democratic politicians, including the previous Speaker of the House of Representatives , Tom Foley , lost their seats in the election . Newt Gingrich succeeded him in the office of Speaker .
The election results

| Parties | Seats | be right | ||||||
|---|---|---|---|---|---|---|---|---|
| 1992 | 1994 | +/- | Strength | be right | % | modification | ||
| republican | 176 | 230 | +54 | 52.9% | 36.325.809 | 51.5% | + 6.7% | |
| Democrats | 258 | 204 | −54 | 46.9% | 31,542,823 | 44.7% | −5.2% | |
| Independent | 1 | 1 | ± 0 | 0.2% | 497,403 | 0.9% | −0.4% | |
| Libertarian party | - | - | - | - | 415,944 | 0.6% | −0.3% | |
| Conservative party | - | - | - | - | 302.735 | 0.4% | + 0.1% | |
| Natural Law Party | - | - | - | - | 62,556 | 0.1% | ± 0.0% | |
| Green party | - | - | - | - | 40.177 | 0.1% | ± 0.0% | |
| Other parties | - | - | - | - | 1,306,201 | 1.9% | −0.7% | |
| total | 435 | 435 | 0 | 100.0% | 70,493,648 | 100.0% | - | |
| Source: Election Statistics - Office of the Clerk | ||||||||
Individual evidence
- ↑ Klinkner, Philip A .: Midterm: The Elections of 1994 in Context . Westview Press, 1996

