
Seattle-Tacoma International Airport
| Seattle-Tacoma International Airport |
|
|---|---|

|
|
| Characteristics | |
| ICAO code | KSEA |
| IATA code | SEA |
| Coordinates | |
| Height above MSL | 132 m (433 ft ) |
| Transport links | |
| Distance from the city center | 11 miles south of Seattle , 14 miles northeast of Tacoma |
| Street | I-5 / WA 99 / WA 509 / WA 518 |
| Local transport |
Bus : King County Metro Rapid Ride A line, Route 156/180 Sound Transit Route 560/574 Light Rail : Seattle Link |
| Basic data | |
| opening | 1944 |
| operator | Port of Seattle |
| surface | 1012 ha |
| Terminals | 3 |
| Passengers | 49,849,520 (2018) |
| Air freight | 432,315 t (2018) |
| Flight movements |
438,391 (2018) |
| Employees | 19,100 (2017) |
| Runways | |
| 16L / 34R | 3627 m × 46 m concrete |
| 16C / 34C | 2873 m × 46 m concrete |
| 16R / 34L | 2591 m × 46 m concrete |
The Seattle-Tacoma International Airport ( IATA : SEA , ICAO : KSEA , simply "Sea-Tac" for short ) is the international airport of the cities of Seattle and Tacoma in the US state of Washington . It serves as the hub for Alaska Airlines and Delta Air Lines .
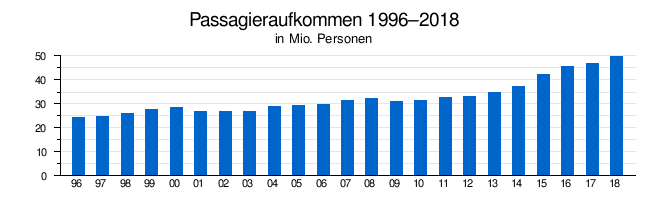
In 2018, around 49.8 million passengers were carried, making it the ninth busiest airport in the United States.
Location and transport links
Seattle-Tacoma International Airport is located 11 miles south of Seattle and 14 miles northeast of Tacoma. It is entirely within the SeaTac City area . The Washington State Route 99 runs east of the airport, the Washington State Route 509 west of the airport and the Washington State Route 518 north of the airport. In addition, Interstate 5 runs two kilometers east of the airport.
The Seattle-Tacoma International Airport is by bus and light rail in the public transport involved. The buses on the Rapid Ride A line and routes 156 and 180 of the operator King County Metro and the buses on routes 560 and 574 of the operator Sound Transit connect it with surrounding cities. In addition, it is served by the so far only line of the Seattle light rail , which is also operated by Sound Transit.
history
Seattle-Tacoma Airport was established by the Port of Seattle as an airport for civil air traffic in 1944 after the US military took control of the Boeing factory's airport during World War II . The company received $ 1 million from the Civil Aeronautics Administration and $ 100,000 from the City of Tacoma for construction .
Commercial air travel began in 1947. After Northwest Airlines began serving Tokyo in 1949 , the word International was added to the name of the airport. A new passenger terminal was opened on July 9 of the same year . The runway was extended twice, first in 1959 to allow jet planes to take off and land, and in 1961 to cope with the increase in traffic during the world exhibition . Between 1967 and 1973, a second runway, a parking garage and two terminals were built.
In the 1970s, several residents complained, among other things, of aircraft noise , vibrations and exhaust fumes emitted from the airport. As a result, $ 100 million was invested to eliminate these problems.
Airport facilities


Runways
Air traffic is handled on three runways. The eastern runway is designated 16L / 34R and is 3,627 meters long. The middle runway is designated 16C / 34R, is 2,873 meters long and was originally commissioned in 1969. The last runway - the shortest - was put into operation in 2008. This is called 16R / 34L and is 2591 meters long. It is on the western edge of the airport area between the taxiway and the expressway parallel to the other two lanes. All runways are 46 meters wide and have a grooved concrete surface.
terminal
Seattle-Tacoma International Airport has a main terminal with four concourses and two satellite terminals on the apron. In addition, three separate people mover lines are in operation under the name Satellite Transit System , two of which connect the satellite terminals with the concourses of the main terminal. The airport has a total of 80 gates .
Airlines and Destinations
Seattle-Tacoma International Airport is the main hub for Alaska Airlines and its subsidiary Horizon Air . It also serves as a hub for Delta Air Lines . It is used by 32 airlines.
A total of 91 national and 29 international destinations are served. The international route network includes scheduled flights to Canada and Mexico as well as intercontinental flights to Asia and Europe . The only destination in the German-speaking area is Frankfurt am Main , which is served by Condor Flugdienst and Lufthansa .
Air freight is also carried by 24 airlines. FedEx flies from here u. a. to Anchorage , Memphis and Oakland . Aerologic flies twice a week from Frankfurt via Seattle to Los Angeles and from there back to Frankfurt.
Airline market shares
|
|
|
|
||||||||||||||||||||||||||||||||||||||||||||||||||||||||||||||||||||||||||||||||||||||||||||||||||||||||||||||||||||||||||||||||||||||||||||||||||||||||||||||||||||||||||||||||||||||||||||||||||||||||||||||||
- ↑ The figures include the respective feeder airlines.
- ↑ The figures include the respective feeder airlines.
- ↑ The figures include the respective feeder airlines.
- ↑ The figures include the respective feeder airlines.
Traffic figures

| Seattle-Tacoma International Airport traffic figures 1966–2018 | ||||||
|---|---|---|---|---|---|---|
| year | Passenger volume | Air freight ( tons ) | Airmail (tons) | Aircraft movements (with military) |
||
| National | International | total | ||||
| 2018 | 44,421,969 | 5,427,551 | 49,849,520 | 374,671 | 57,644 | 438.391 |
| 2017 | 41,804,350 | 5,130,269 | 46,934,619 | 366.205 | 59,651 | 416.124 |
| 2016 | 40,870,654 | 4,866,461 | 45.737.115 | 309.105 | 57,326 | 412.170 |
| 2015 | 37.960.191 | 4,380,346 | 42,340,537 | 277,370 | 55.266 | 381,408 |
| 2014 | 33,675,719 | 3,822,548 | 37,498,267 | 275,481 | 51,758 | 340,478 |
| 2013 | 31.247.376 | 3,579,365 | 34,826,741 | 244,447 | 48,262 | 317.186 |
| 2012 | 29,975,042 | 3,248,069 | 33.223.111 | 237.310 | 46,300 | 309,597 |
| 2011 | 29,838,192 | 2,985,028 | 32.823.220 | 234,586 | 45,308 | 314,947 |
| 2010 | 28,745,014 | 2,808,152 | 31,553,166 | 238.062 | 45.230 | 313,954 |
| 2009 | 28,593,782 | 2,633,730 | 31,227,512 | 226.285 | 43,857 | 317,873 |
| 2008 | 29,274,094 | 2,922,434 | 32,196,528 | 245.916 | 44,852 | 345.047 |
| 2007 | 28,585,819 | 2,710,809 | 31,296,628 | 270,746 | 48,267 | 347.046 |
| 2006 | 27,517,599 | 2,478,825 | 29.996.424 | 289.143 | 52,838 | 340.058 |
| 2005 | 26,817,991 | 2,471,035 | 29.289.026 | 284,775 | 53,815 | 341,762 |
| 2004 | 26,368,438 | 2,436,116 | 28,804,554 | 285.162 | 62,355 | 358,894 |
| 2003 | 24,527,470 | 2,272,443 | 26,799,913 | 279.502 | 71,916 | 354.770 |
| 2002 | 24,440,713 | 2,297,845 | 26,738,558 | 286,594 | 88,159 | 364.735 |
| 2001 | 24,683,837 | 2,352,236 | 27,036,073 | 294.286 | 107,249 | 400,635 |
| 2000 | 25,962,051 | 2,446,502 | 28,408,553 | 311,381 | 145,539 | 445,677 |
| 1999 | 25.270.402 | 2,435,086 | 27,705,488 | 300.501 | 143,723 | 433,660 |
| 1998 | 23.710.257 | 2,153,209 | 25,863,466 | 294.165 | 134.162 | 407.576 |
| 1997 | 22,887,340 | 1,842,773 | 24.730.113 | 281.147 | 112,639 | 385,298 |
| 1996 | 22,639,215 | 1,685,381 | 24,324,596 | 285,977 | 102.241 | 395.216 |
| 1995 | 21,107,946 | 1,666,040 | 22,773,986 | 309,679 | 98,519 | 386,536 |
| 1994 | 19,482,971 | 1,489,848 | 20,972,819 | 320.027 | 90.109 | 353.052 |
| 1993 | 17,393,527 | 1,406,997 | 18,800,524 | 297,326 | 84.216 | 339.459 |
| 1992 | 16,462,515 | 1,499,702 | 17,962,217 | 284.242 | 77,366 | 345.995 |
| 1991 | 14,759,181 | 1,554,108 | 16,313,289 | 268.221 | 79,445 | 338,607 |
| 1990 | 14,399,529 | 1,840,780 | 16.240.309 | 245.136 | 68,324 | 355.007 |
| 1989 | 13.710.455 | 1,530,803 | 15.241.258 | 226.239 | 65,196 | 334.924 |
| 1988 | 13,095,487 | 1,400,032 | 14,495,519 | 211,232 | 65,845 | 315,944 |
| 1987 | 13.180.582 | 1,264,900 | 14,445,482 | 193,309 | 65,680 | 292.045 |
| 1986 | 12,465,343 | 1,177,323 | 13,642,666 | 157.027 | 65,975 | 259.939 |
| 1985 | 10,436,161 | 1,030,594 | 11,466,755 | 146.142 | 64,050 | 234,722 |
| 1984 | 9,468,444 | 1,008,186 | 10,476,630 | 167.704 | 59,859 | 223,828 |
| 1983 | 9,256,036 | 885.701 | 10,141,737 | 158.917 | 54,618 | 209.253 |
| 1982 | 8,518,366 | 760.371 | 9,278,737 | 147,950 | 50,697 | 211.394 |
| 1981 | 8,150,623 | 967.007 | 9,117,630 | 161,434 | 49.195 | 207.945 |
| 1980 | 8,247,226 | 947.424 | 9,194,650 | 161.410 | 49,767 | 212,744 |
| 1979 | 9,017,605 | 802.814 | 9,820,419 | 171,437 | 42,759 | 211,942 |
| 1978 | 7,665,983 | 701.994 | 8,367,977 | 169.063 | 43,477 | 195.011 |
| 1977 | 6,646,413 | 686.030 | 7,332,443 | 173.618 | 41,746 | 190.026 |
| 1976 | 6,158,045 | 648.703 | 6,806,748 | 162,543 | 37,699 | 173,525 |
| 1975 | 5,497,178 | 615.245 | 6,112,423 | 153.114 | 37.126 | - |
| 1974 | 5,137,734 | 634.482 | 5,772,216 | 130,869 | 37.141 | - |
| 1973 | 4,644,053 | 561.040 | 5,205,093 | 112,323 | 38,369 | - |
| 1972 | 4,381,861 | 407.101 | 4,788,962 | 94,532 | 42,738 | - |
| 1971 | 4,319,336 | 378.269 | 4,697,605 | 84,483 | 48,074 | - |
| 1970 | 4,270,257 | 383.186 | 4,653,443 | 75,078 | 55.093 | - |
| 1969 | 4,423,000 | 381.928 | 4,804,928 | 78,767 | 60,411 | - |
| 1968 | 4,070,198 | 364,580 | 4,434,778 | 69,442 | 54,135 | - |
| 1967 | 3,514,830 | 338,777 | 3,853,607 | 59,376 | 37,061 | - |
| 1966 | 2,539,582 | 282,425 | 2,822,007 | 47,680 | 25,888 | - |
Busiest routes
| rank | city | Passengers | Airlines |
|---|---|---|---|
| 1 | Los Angeles , California | 1,250,930 | Alaska , American Eagle , Delta , United / United Express |
| 2 | San Francisco , California | 1,160,280 | Alaska, Delta / Delta Connection , United / United Express |
| 3 | Anchorage , Alaska | 1,008,880 | Alaska, Delta, JetBlue , Sun Country |
| 4th | Denver , Colorado | 924.880 | Alaska, Delta, Frontier , Southwest , United / United Express |
| 5 | Las Vegas , Nevada | 881.440 | Alaska, Delta, Southwest, Spirit |
| 6th | Chicago-O'Hare , Illinois | 821,900 | Alaska, American, Delta, Spirit, United |
| 7th | Phoenix , Arizona | 801.050 | Alaska, American, Delta, Southwest |
| 8th | Portland , Oregon | 660.390 | Alaska, Delta / Delta Connection |
| 9 | Dallas / Fort Worth , Texas | 621.970 | Alaska, American, Spirit |
| 10 | San Jose , California | 621.660 | Alaska, Delta / Delta Connection, Southwest |
Incidents
- On April 2, 1956, a Boeing 377 operated by Northwest Airlines ( aircraft registration number N74608 ) suffered severe vibrations after the landing flaps were retracted shortly after take-off from Seattle-Tacoma Airport. The altitude could no longer be maintained, and a ditching was carried out in the Puget Sound bay , almost 9 kilometers southwest of the departure airport. About 15 minutes later the plane sank. Of the 38 occupants, 5 were killed, 1 crew member and 4 passengers.
- On November 24, 1971, a plane on Northwest Airlines Flight 305 from Seattle-Tacoma to Portland was hijacked by a man named Dan Cooper . He dismissed the passengers after 200,000 US dollars and four parachutes had received. Then he let the plane take off again and jumped over southwest Washington with the money.
- On August 10, 2018, a handler stole a Horizon Air De Havilland DHC-8-400 and flew it around over Puget Sound before the machine crashed on an uninhabited island. The man is said to have acted with suicidal intent.
See also
Web links
- Official airport website (English)
- Official website of the airport operator (English)
- Entry in the Washington encyclopedia HistoryLink (English)
Individual evidence
- ^ Seattle-Tacoma International Airport Fact Sheet. (No longer available online.) PortSeattle.org, archived from the original on April 3, 2018 ; accessed on April 2, 2018 . Info: The archive link was inserted automatically and has not yet been checked. Please check the original and archive link according to the instructions and then remove this notice.
- ↑ AirportIQ 5010: Seattle-Tacoma International. GCR1.com, accessed November 27, 2017 .
- ↑ a b c d e f Airport Statistics. PortSeattle.org, accessed February 6, 2019 .
- ↑ a b c d e Airport Basics. PortSeattle.org, accessed March 26, 2019 .
- ^ Ground Transportation. PortSeattle.org, accessed March 25, 2019 .
- ↑ Airport Projects. PortSeattle.org, accessed March 26, 2019 .
- ↑ a b Airlines and Destinations. PortSeattle.org, accessed March 26, 2019 .
- ↑ Air Cargo Carriers. PortSeattle.org, accessed March 26, 2019 .
- ↑ a b c d Seattle-Tacoma International Airport Annual Activity Report. Tableau.com , accessed March 26, 2019 .
- ↑ a b c Airport Statistics. PortSeattle.org, accessed February 6, 2019 .
- ^ Seattle / Tacoma International. Transtats.BTS.gov , accessed April 2, 2018 .
- ↑ Accident Report B-377 N74608 , Aviation Safety Network (English), accessed on February 18 2020th
- ↑ accident report DHC-8-400 N449QX , Aviation Safety Network (English), accessed on March 10 of 2019.
Everett | King County | Pullman / Moscow | Renton | Seattle-Tacoma | Spokane (Felts) | Spokane (International) | Wenatchee
Military: Fairchild | Whidbey Island
Anchorage | Atlanta | Baltimore | Boston | Charlotte | Chicago (Midway) | Chicago (O'Hare) | Cincinnati | Dallas / Fort Worth | Denver | Detroit | Fort Lauderdale | Honolulu | Houston | Indianapolis | Las Vegas | Los Angeles | Louisville | Memphis | Miami | Minneapolis / Saint Paul | New York (JFK) | New York (LaGuardia) | Newark | Orlando | Philadelphia | Phoenix | Portland | Salt Lake City | San Diego | San Francisco | Seattle / Tacoma | Tampa | Washington (Dulles) | Washington (Reagan)