Weibull distribution
| Weibull distribution | |
Density  function Density function for various shape parameters function Density function for various shape parameters
|
|
Distribution  function Distribution function for various shape parameters k function Distribution function for various shape parameters k
|
|
| parameter |
- shape parameter - inverse scale parameter
|
|---|---|
| carrier | |
| Density function | |
| Distribution function | |
| Expected value | |
| Variance | |
The Weibull distribution is a two-parameter family of continuous probability distributions over the set of positive real numbers . With a suitable choice of its two parameters, it resembles a normal distribution , an exponential distribution or other asymmetrical distributions. Among other things, it is used for statistical modeling of wind speeds or to describe the service life and failure frequency of electronic components or (brittle) materialsused. Unlike an exponential distribution, it takes into account the previous history of an object, it is memory-based and takes into account the aging of a component not only over time, but also depending on its use. It can be adapted to rising, constant and falling failure rates of technical systems. The distribution is named after the Swedish engineer and mathematician Waloddi Weibull . It has a special meaning in the event time analysis .
definition
The Weibull distribution has two parameters.
Scale parameters
The scale parameter is .
In some applications, especially with time dependencies, its reciprocal value , the characteristic service life , is replaced. is the time span after which approx. 63.2% of the units have failed in life cycle analyzes. This value is a characteristic of the Weibull distribution.
- .
If no scale parameter is given, it is meant implicitly .
Shape parameters
The shape parameter, or Weibull module, is the parameter .
Alternatively, the letters or are used.
Typical values in practice are in the range .
Various more specific probability distributions can be implemented using the shape parameter :
- For is the exponential distribution with a constant failure rate.
- For is the Rayleigh distribution .
- For there is a distribution with vanishing skewness (similar to the normal distribution ).
Density, distribution etc.
A Weibull distribution with parameters is given .
The density function is:
The distribution function is:
The survival function , or reliability function, is given by:
The failure rate is:
- .
Another common convention is parameterization by , i. H. the Weibull distribution is defined as a nonnegative random variable with the density function
- with , .
This representation is often used in English-speaking countries and in statistical programs.
properties
Expected value
The expectation of the Weibull distribution is
with the gamma function .
Variance
The variance of the distribution is
- .
Crookedness
The skew of the distribution is
with the mean and the standard deviation .
entropy
The entropy of the Weibull distribution (expressed in nats ) is
where denotes the Euler-Mascheroni constant .
Applications
In the case of systems with different causes of failure, such as technical components, these can be mapped with three Weibull distributions in such a way that a " bathtub curve " results. The distributions then cover these three areas:
- Early failures , for example in the running-in phase ("teething troubles").
- Random failures with in the operating phase
- Fatigue and wear failures at the end of the product life
In mechanical process engineering , the Weibull distribution is used as a special particle size distribution . Here, however, it is referred to as the RRSB distribution (according to Rosin, Rammler, Sperling and Bennet).
For , the distribution is one of those distributions with heavy boundaries whose density falls more slowly than exponentially.
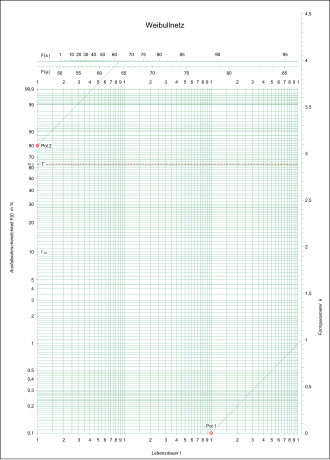
Weibull network
One carries the distribution in the form
in a double logarithmic diagram, which is also known as the Weibull network, the result is a straight line in which the parameter can easily be read off as a slope . The characteristic service life can then be determined as follows:
- .
Here denotes the y-axis intercept .
It often happens that, in spite of stress, failures only occur after an initial period of operation (for example as a result of brake pad wear). This can be taken into account in the Weibull distribution function. It then looks like this:
If the function is applied again, the result is not a straight line, but an upwardly convex curve. If you move all points by the value , the curve changes into a straight line.
Wind speed
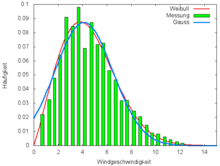
The graphic shows an example of a series of measurements of wind speeds (green). A Gaussian fit (blue) does not come close to the numbers. There are no negative wind speeds, nor is the distribution symmetrical. A Weibull distribution introduces a second free parameter. It approximates the distribution for high and low wind speeds very well, as does the values around the maximum. An expected value of 4.5 m / s follows from the fit parameters and , in good agreement with the value of 4.6 m / s determined from the measured values.
Relationship to other distributions
Relationship to the exponential distribution
- It can be seen that the case gives the exponential distribution . In other words, the exponential distribution deals with problems with a constant failure rate . However, if one examines questions with a rising ( ) or falling ( ) failure rate, one moves from the exponential distribution to the Weibull distribution.
- If this is the parameter , a system with a failure rate that increases over time, i.e. an aging system, is described.
- If has an exponential distribution with parameters , then the random variable has a Weibull distribution . As evidence, consider the distribution function of : . This is the distribution function of a Weibull distribution.
Stretched exponential function
The function
is called the stretched exponential function .
See also
literature
- Bernard W. Lindgren: Statistical Theory. Chapman & Hall, New York et al. a. 1993, ISBN 0-412-04181-2 .
- Marek Fisz : Probability Theory and Mathematical Statistics. German Science Publishing House, Berlin 1970.
- Joachim Hartung, Bärbel Elpelt, Karl-Heinz Klösener: Statistics. Oldenbourg, Munich 2002, ISBN 3-486-25905-9 .
- Horst Rinne, Hans-Joachim Mittag: Statistical methods of quality assurance. Hanser, Munich / Vienna 2002, ISBN 3-446-15503-1 .
- Holger Wilker: Weibull statistics in practice, guidelines for determining the reliability of technical products. BoD, Norderstedt 2010, ISBN 978-3-8391-6241-5 .
Web links
- Weibull distribution in reliability analysis
- Weibull distribution and its application in ceramics
- Practical instruction for determining the Weibull distribution in ceramics
swell
- ↑ Ayse Kizilersu, Markus Kreer, Anthony W. Thomas: The Weibull distribution . In: Significance . 15, No. 2, 2018, pp. 10-11. doi : 10.1111 / j.1740-9713.2018.01123.x .
- ↑ See also: en: Exponentiated Weibull distribution
- ↑ Reliability assurance for automobile manufacturers and suppliers. 3. Edition. VDA, Frankfurt a. M. 2000, ISSN 0943-9412 , section 2.4.3. (Quality management in the automotive industry 3)


![\ lambda ^ {{- 2}} [\ Gamma (1 + 2 / k) - \ Gamma ^ {2} (1 + 1 / k)]](https://wikimedia.org/api/rest_v1/media/math/render/svg/499dd1ffa14fd3b892ad13bfdc81c8de7518e73f)


![\ operatorname {Var} (X) = {\ frac {1} {\ lambda ^ {2}}} \ left [\ Gamma \ left (1 + {\ frac {2} {k}} \ right) - \ Gamma ^ {2} \ left (1 + {\ frac {1} {k}} \ right) \ right]](https://wikimedia.org/api/rest_v1/media/math/render/svg/a1338af04f20021d457a333cc5f6e43170f03d90)


