
European Union demographics

Based on an estimate by Eurostat , there were around 512 million inhabitants in the European Union in 2018 (500 million in 2008) on an area of 4,324,782 square kilometers. With a population density of 118 inhabitants / km², the European Union is one of the most densely populated regions in the world.
overview
Populations of the member states

The most populous member state is Germany with an estimated population of 82.1 million inhabitants, the least populous member state is Malta with 0.4 million inhabitants. The birth rates in the European Union are very low with an average of around 1.6 children per woman. The highest birth rates are in Ireland, with 16.876 births per thousand people per year, and France, with 13.013 births per thousand people per year. Germany has the lowest birth rate in the European Union with 8,221 births per thousand inhabitants and year.
| Member state | population | Percentage to the EU |
Area km² |
Percentage to the EU |
Population density Ew./km² |
|---|---|---|---|---|---|
| 507.416.607 | 100 | 4,324,782 | 100 | 116.0 | |
|
|
11,203,992 | 2.21 | 30,510 | 0.7 | 352.0 |
|
|
7,245,677 | 1.43 | 110,912 | 2.5 | 68.5 |
|
|
5,627,235 | 1.11 | 43.094 | 1.0 | 128.1 |
|
|
80,780,000 | 15.92 | 357.021 | 8.1 | 229.9 |
|
|
1,315,819 | 0.26 | 45.226 | 1.0 | 29.6 |
|
|
5,451,270 | 1.07 | 337.030 | 7.6 | 15.8 |
|
|
65.856.609 | 12.98 | 643,548 | 14.6 | 99.6 |
|
|
10,992,589 | 2.17 | 131,957 | 3.0 | 85.4 |
|
|
4,604,029 | 0.91 | 70,280 | 1.6 | 64.3 |
|
|
60,782,668 | 11.98 | 301,320 | 6.8 | 200.4 |
|
|
4,246,700 | 0.84 | 56,594 | 1.3 | 75.8 |
|
|
2,001,468 | 0.39 | 64,589 | 1.5 | 35.0 |
|
|
2,943,472 | 0.58 | 65,200 | 1.5 | 51.4 |
|
|
549.680 | 0.11 | 2,586 | 0.1 | 190.1 |
|
|
425.384 | 0.08 | 316 | 0.0 | 1,305.7 |
|
|
16,829,289 | 3.32 | 41,526 | 0.9 | 396.9 |
|
|
8,507,786 | 1.68 | 83,858 | 1.9 | 99.7 |
|
|
38,495,659 | 7.59 | 312,685 | 7.1 | 121.9 |
|
|
10,427,301 | 2.05 | 92,931 | 2.1 | 114.4 |
|
|
19,942,642 | 3.93 | 238.391 | 5.4 | 90.2 |
|
|
9,644,864 | 1.90 | 449.964 | 10.2 | 20.6 |
|
|
5,415,949 | 1.07 | 48,845 | 1.1 | 110.8 |
|
|
2,061,085 | 0.41 | 20,253 | 0.5 | 101.4 |
|
|
46.507.760 | 9.17 | 504.782 | 11.4 | 93.4 |
|
|
10,512,419 | 2.07 | 78,866 | 1.8 | 132.8 |
|
|
9,879,000 | 1.95 | 93.030 | 2.1 | 107.8 |
|
|
64,308,261 | 12.67 | 244,820 | 5.5 | 251.7 |
|
|
858,000 | 0.17 | 9,250 | 0.2 | 86.6 |
Cities
There are 15 cities in the European Union with Berlin as the most populous city. The Rhine-Ruhr metropolitan region is also the largest metropolitan region in the European Union with an estimated 10 million inhabitants.

| rank | Surname | Check- residents |
Area (km²) |
Ew. / km² |
was standing | Country | source |
|---|---|---|---|---|---|---|---|
| 1 | Berlin | 3,419,623 | 892 | 3.834 | Nov 30, 2013 |
|
AfS |
| 2 | Madrid | 3,266,126 | 607 | 5,381 | Jan. 1, 2019 |
|
INE |
| 3 | Rome | 2,651,040 | 1,285 | 2,063 | Oct 31, 2013 |
|
ISTAT |
| 4th | Paris | 2,273,305 | 105 | 21,651 | Jan. 1, 2013 |
|
INSEE |
| 5 | Bucharest | 1,883,425 | 228 | 8,260 | Oct 20, 2011 |
|
INS |
| 6th | Vienna | 1,775,843 | 415 | 4,257 | May 28, 2014 |
|
STAT |
| 7th | Hamburg | 1,753,380 | 755 | 2,315 | Nov 30, 2013 |
|
STATN |
| 8th | Budapest | 1,735,711 | 525 | 3,306 | Jan. 1, 2013 |
|
KSH |
| 9 | Warsaw | 1,783,321 | 518 | 3,443 | June 30, 2019 |
|
CIS |
| 10 | Barcelona | 1,636,762 | 100 | 16,368 | Jan. 1, 2019 |
|
INE |
| 11 | Munich | 1,402,455 | 310 | 4,524 | Sep 30 2013 |
|
BLfSD |
| 12 | Milan | 1,315,416 | 160 | 8,221 | Oct 31, 2013 |
|
ISTAT |
| 13 | Sofia | 1,301,683 | 492 | 2,646 | Dec 31, 2012 |
|
NSI |
| 14th | Prague | 1,243,201 | 496 | 2,527 | Dec 31, 2013 |
|
ČSÚ |
| 15th | Cologne | 1,027,679 | 405 | 2,537 | 30th of June 2013 |
|
LDS NRW |

Berlin is the most populous city in the European Union

Madrid has been the geographical, political and cultural center of Spain for centuries

Rome in the ancient capital of the Roman Empire is also known as the "Eternal City"

View from the triumphal arch over to La Défense in Paris

The Vienna International Center is one of the four United Nations offices worldwide

The Speicherstadt in Hamburg, one of the largest historical department store complexes

Modern Warsaw


languages
In the European Union, 24 languages are currently recognized as official and working languages. The language question was determined by the first regulation ever issued by the EEC (for the text of Regulation 1/1958 see below). The legal basis for the regulation is currently Art. 342 TFEU: "Regardless of the statute of the Court of Justice of the European Union, the regulation of the language issue for the organs of the Union is unanimously adopted by the Council through regulations." According to Art. 24 TFEU, all Union citizens have the right to to address the EU institutions in one of the 24 languages mentioned in Art. 55 of the EU Treaty and to receive an answer in the same language. In addition to these official languages, there are numerous minority languages such as B. Catalan or Basque in Spain or Russian in the Baltic countries. The EU declares that it will respect and respect languages and linguistic diversity. With the accession of Croatia on July 1, 2013, the Croatian language became the 24th official language of the EU.
- Language skills in the EU

German
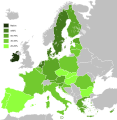
English

French

Spanish
Italian

Russian


| language | Official language in the Member State | spoken as mother tongue (proportion of the population) | spoken as a foreign language (proportion of the population) | Total speakers in the EU (proportion of the population) |
|---|---|---|---|---|
| German | 18% | 14% | 32% | |
| English | 13% | 38% | 51% | |
| French | 14% | 14% | 28% | |
| Italian | 13% | 3% | 16% | |
| Spanish | 9% | 6% | 15% | |
| Polish | 9% | 1 % | 10% |
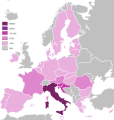
religion
2005 Eurobarometer survey

Believe in a god
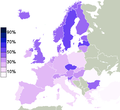
Believe in a kind of supernatural

Agnostic or atheistic


| Religion / belief | Population share |
|---|---|
| Christianity | 71.6% |
| - Roman Catholic | 45.3% |
| - Protestant | 11.1% |
| - Christian Orthodox | 9.6% |
| - other Christian denominations | 5.6% |
| other religion | 4.5% |
| - Muslim | 1.8% |
| - Buddhist | 0.4% |
| - Jewish | 0.3% |
| - Hindu | 0.3% |
| - Sikhist | 0.1% |
| - other religions | 1.6% |
| no religion | 24.0% |
| - not believing / agnosticism | 13.6% |
| - atheism | 10.4% |
health
Health expectation
The health expectancy is from Eurostat calculated with the indicator "healthy life years" (HLY). This statistical indicator of health expectancy is calculated separately for men and women at birth and at the age of 50 and 65 years. For this purpose, data on the proportions of the healthy and sick population and data on age-specific mortality are evaluated. Good health is defined as the absence of functional limitations / disabilities. The key figure “Healthy Years of Life (GLJ) at the age of 65” indicates the number of years that a person at 65 will still live in good health. The key figure “GLJ” is therefore an indicator of health expectation , which links information on mortality and illness. For this purpose, data on the age-specific proportions of the healthy and sick population and data on age-specific mortality are used. Good health is defined by the absence of functional restrictions / complaints. The figure is also called symptom-free life expectancy (BFLE).
The measure is calculated using the Sullivan method, which is based on data on the age-specific proportion of the population with and without disabilities and on mortality data. This method is often used because it is uncomplicated, because the basic data are available and because it can be used for many countries regardless of the size and age structure of the population. However, the GLJ indicator can be influenced by cultural differences with regard to the reporting of disabilities.
Ranking health expectation

- The GLJ estimates are provided for the 27 EU Member States using the EU-SILC data for 2016
(see figure on the left). - The analyzes of the values for healthy life years indicate significant inequalities between the European countries.
- So z. For example, the health expectation of women in Sweden is 16.2 years higher than in Austria .
- The health expectation in Sweden is 16.0 years higher for men than in Austria .
See also:
Health Expectation Table

Life expectancy
According to Eurostat data, the average life expectancy at birth in 2016 was 81 years in the EU. For men it was 78.2 years and for women 83.3 years. Life expectancy in the European Union was more than 10 years above the global average of almost 70 years. EU citizens had the longest average life expectancy in Spain at 83.5 years. On the other hand, citizens of Lithuania, Bulgaria and Latvia had the shortest life expectancy within the EU at 74.9 years each. In terms of life expectancy, the southern European countries in particular took high places, although they are not necessarily among the richest countries in the Union. The lower ranks are all occupied by Eastern European countries.
| rank | Country | Life expectancy (total) |
Life expectancy (men) |
Life expectancy (women) |
|---|---|---|---|---|
| 1 |
|
83.5 | 80.5 | 86.3 |
| 2 |
|
83.4 | 81.0 | 85.6 |
| 3 |
|
82.7 | 80.5 | 84.9 |
| 4th |
|
82.7 | 79.5 | 85.7 |
| 5 |
|
82.7 | 80.1 | 85.4 |
| 6th |
|
82.6 | 80.6 | 84.4 |
| 7th |
|
82.4 | 80.6 | 84.1 |
| 8th |
|
81.8 | 79.3 | 84.1 |
| 9 |
|
81.8 | 79.9 | 83.6 |
| 10 |
|
81.7 | 80.0 | 83.2 |
| 11 |
|
81.5 | 79.0 | 84.0 |
| 12 |
|
81.5 | 78.9 | 84.0 |
| 13 |
|
81.5 | 78.6 | 84.4 |
| 14th |
|
81.3 | 78.1 | 84.3 |
| 15th |
|
81.2 | 78.2 | 84.3 |
| 16 |
|
81.2 | 79.4 | 83.0 |
| 17th |
|
81.0 | 78.6 | 83.5 |
| - |
|
81.0 | 78.2 | 83.6 |
| 18th |
|
80.9 | 79.0 | 82.8 |
| 19th |
|
79.1 | 76.1 | 82.1 |
| 20th |
|
78.2 | 75.0 | 81.3 |
| 21st |
|
78.0 | 73.3 | 82.2 |
| 22nd |
|
78.0 | 73.9 | 82.0 |
| 23 |
|
77.3 | 73.8 | 80.7 |
| 24 |
|
76.2 | 72.6 | 79.7 |
| 25th |
|
75.3 | 71.7 | 79.1 |
| 26th |
|
74.9 | 71.3 | 78.5 |
| 27 |
|
74.9 | 69.5 | 80.1 |
| 28 |
|
74.9 | 69.8 | 79.6 |
See also: Health Expectation: Indicator Healthy Life Years (GLJ)
statistics
Human Development Index
According to the 2015 Human Development Index , the most developed country in the EU is Denmark. Then come the Netherlands, Germany, Ireland and Sweden. Almost all countries have a very high level of human development. Only Romania and Bulgaria only have high levels of human development.

| Rank in the EU | Rank worldwide | Country | classification | HDI |
|---|---|---|---|---|
| 1 | 4th |
|
very high development | 0.923 |
| 2 | 5 |
|
very high development | 0.922 |
| 3 | 6th |
|
very high development | 0.916 |
| 4th | 6th |
|
very high development | 0.916 |
| 5 | 14th |
|
very high development | 0.907 |
| 6th | 14th |
|
very high development | 0.907 |
| 7th | 19th |
|
very high development | 0.892 |
| 8th | 21st |
|
very high development | 0.890 |
| 9 | 22nd |
|
very high development | 0.888 |
| 10 | 23 |
|
very high development | 0.885 |
| 11 | 24 |
|
very high development | 0.883 |
| - | 25th |
|
very high development | 0.880 |
| 12 | 25th |
|
very high development | 0.880 |
| 13 | 26th |
|
very high development | 0.876 |
| 14th | 27 |
|
very high development | 0.873 |
| 15th | 28 |
|
very high development | 0.870 |
| 16 | 29 |
|
very high development | 0.865 |
| 17th | 30th |
|
very high development | 0.861 |
| 18th | 32 |
|
very high development | 0.850 |
| 19th | 35 |
|
very high development | 0.844 |
| 20th | 36 |
|
very high development | 0.843 |
| 21st | 37 |
|
very high development | 0.839 |
| 22nd | 37 |
|
very high development | 0.839 |
| 23 | 43 |
|
very high development | 0.830 |
| 24 | 44 |
|
very high development | 0.828 |
| 25th | 46 |
|
very high development | 0.819 |
| 26th | 47 |
|
very high development | 0.818 |
| 27 | 52 |
|
high development | 0.793 |
| 28 | 59 |
|
high development | 0.782 |
Age pyramid
Birth rate & death rate
Birth rate : 10.1 births / 1000 inhabitants (2016)
Death rate : 10.2 deaths / 1000 inhabitants (2016)
Child mortality rate : 4.0 deaths / 1000 births (2016)
Life expectancy : (2016)
- Total: 80.2 years
- Men: 77.4 years
- Women: 83.2 years
Marriages & fertility
Marriage rate : 4.9 marriages / 1000 inhabitants (2007)
Divorce rate : 2.0 divorces / 1000 population (2005) Fertility rate : 1.61 children / woman 2016
Births outside of marriage: 39.5% in 2011
Demographics
EU net migration rate
Net migration rate : 2.5 immigrants / 1000 inhabitants (2016)
Migration in the member states
On the one hand, there is a not inconsiderable number of citizens of the European Union from the Schengen area who change their place of residence within the EU. The two main groups here are, on the one hand, younger people for reasons of job search. These migrate to the economically stronger countries. The other larger group is made up of older people who are moving their old age to the south of the European Union because of the better, warmer climate.
In addition to internal migration, more people immigrate to the European Union than emigrate from there. The EU's net immigration rate in 2008 was 3.1 per 1,000 people. Annual absolute immigration has fluctuated from 1.5 to 2.0 million immigrants since 2003.
| Member state | Total population | Not born in the country | % | From another EU member state | % | Not from an EU member state | % |
|---|---|---|---|---|---|---|---|
|
|
501.098 | 47,348 | 9.4 | 15,980 | 3.2 | 31,368 | 6.3 |
|
|
81,802 | 9,812 | 12.0 | 3,396 | 4.2 | 6,415 | 7.8 |
|
|
64,716 | 7,196 | 11.1 | 2.118 | 3.3 | 5,078 | 7.8 |
|
|
62.008 | 7,012 | 11.3 | 2,245 | 3.6 | 4,767 | 7.7 |
|
|
45,989 | 6,422 | 14.0 | 2,328 | 5.1 | 4,094 | 8.9 |
|
|
60,340 | 4,798 | 8.0 | 1,592 | 2.6 | 3,205 | 5.3 |
|
|
16,575 | 1,832 | 11.1 | 428 | 2.6 | 1,404 | 8.5 |
|
|
11.305 | 1,256 | 11.1 | 315 | 2.8 | 940 | 8.3 |
|
|
9,340 | 1,337 | 14.3 | 477 | 5.1 | 859 | 9.2 |
|
|
8,367 | 1,276 | 15.2 | 512 | 6.1 | 764 | 9.1 |
|
|
10,637 | 793 | 7.5 | 191 | 1.8 | 602 | 5.7 |
|
|
5,534 | 500 | 9.0 | 152 | 2.8 | 348 | 6.3 |
Population development
It is believed that the population of the European Union will increase from 495 million on January 1, 2008 to 521 million in 2035 and then gradually decrease to 506 million by 2060. A decline in the annual number of births is predicted for the period from 2008 to 2060.
At the same time, it is assumed that the number of annual deaths will continue to rise. Presumably, the number of deaths will exceed the number of births from 2015 onwards and the population growth due to natural growth will therefore stop. From this point onwards, positive net migration is likely to be the only population growth factor. From 2035 onwards, however, this positive net migration is unlikely to compensate for the negative natural change, and there will probably be a decline in the population.
In addition, the population of the European Union is likely to continue to age; the proportion of the elderly (65 years and over) will increase from 17.1% in 2008 to 30.0% in 2060, and the proportion of people 80 years and over will increase from 4, 4% increase to 12.1%.

| Member State | Population 2008 | Population 2035 | Percentage change | Population 2060 | Percentage change |
|---|---|---|---|---|---|
|
|
10,918 | 11,906 | 9.05% | 12,295 | 12.61% |
|
|
7,505 | 6,535 | −12.92% | 5,485 | −26.92% |
|
|
5,561 | 5,858 | 5.34% | 5,920 | 6.46% |
|
|
81,752 | 79,150 | −3.18% | 70,759 | −13.45% |
|
|
1,340 | 1,243 | −7.24% | 1,132 | −15.52% |
|
|
5,375 | 5,557 | 3.39% | 5,402 | 0.50% |
|
|
63.136 | 69,021 | 9.32% | 71,800 | 13.72% |
|
|
11,330 | 11,575 | 2.16% | 11,118 | −1.87% |
|
|
4,480 | 6,057 | 26.04% | 6,752 | 37.51% |
|
|
60,626 | 61,995 | 2.26% | 59,390 | −2.04% |
|
|
2,230 | 1,970 | −11.60% | 1,682 | −24.57% |
|
|
3,245 | 2,998 | −7.61% | 2,548 | −21.48% |
|
|
512 | 633 | 23.63% | 732 | 42.97% |
|
|
416 | 429 | 3.12% | 405 | −2.64% |
|
|
16,655 | 17,271 | 3.70% | 16,596 | −0.35% |
|
|
8,404 | 9,075 | 7.98% | 9,037 | 7.53% |
|
|
38,200 | 36,141 | −5.39% | 31,139 | −18.48% |
|
|
10,617 | 11,395 | 7.33% | 11,265 | 6.10% |
|
|
21,414 | 19,619 | −8.38% | 16,921 | −20.98% |
|
|
9.416 | 10,382 | 10.26% | 10,875 | 15.49% |
|
|
5,435 | 5,231 | −3.75% | 4,547 | −16.34% |
|
|
2,050 | 1,992 | −2.83% | 1,779 | −13.22% |
|
|
47,190 | 53,027 | 12.37% | 51,913 | 10.01% |
|
|
10,533 | 10,288 | −2.33% | 9,514 | −9.67% |
|
|
9,986 | 9,501 | −4.86% | 8,717 | −12.71% |
|
|
62,436 | 70,685 | 13.21% | 76,677 | 22.81% |
|
|
804 | 1,121 | 39.4% | 1,320 | 64.18% |
|
|
502,489 | 520.654 | 3.62% | 505.719 | 0.64% |
EU demographic strategy
In 2006 the European Commission proposed five strategic measures to "meet the challenges of demographic change":
- Support for demographic renewal through better conditions for families and the compatibility of work and family
- Promotion of employment - more jobs and a longer working life with a high quality of life
- Increasing productivity and economic performance through investments in education and research
- Reception and integration of migrants in Europe
- Ensure sustainable public finances for adequate pensions, medical care and long-term care
See also
- Demography of Denmark
- Demography of Germany
- France demographics
- Demographics of Italy
- Demography of Austria
- Demography of Spain
Web links
- Demography Report 2010 Demography report of the EU (PDF; 3.1 MB; 184 pages), see also summaries: European Commission , fmm-magazin.de , cdl-online.de
- Demographic analysis European Commission (with further links)
- Ron Davies: Promoting fertility in the EU: Social policy options for Member States . Library of the European Parliament, 2013, p. 10.
- Eulalia Claros: Migration in the EU . In: Library statistical spotlight . Library of the European Parliament. Retrieved June 14, 2013.
Individual evidence
- ^ Population on January 1st. In: table. Eurostat , 2018, accessed 30 June 2019 .
- ↑ Figures for France also include the four overseas departments ( French Guiana , Guadeloupe , Martinique , Réunion ) which are an integral part of the EU, not including the Collectivité d'outre-mer and the other territories that are not part of the EU .
- ^ Office for Statistics Berlin-Brandenburg ( Memento of the original from May 23, 2014 in the Internet Archive ) Info: The archive link was automatically inserted and not yet checked. Please check the original and archive link according to the instructions and then remove this notice.
- ↑ a b Cifras oficiales de población resultantes de la revisión del Padrón municipal a 1 de enero . Population statistics from the Instituto Nacional de Estadística (population update).
- ↑ a b Population of Italian cities on October 31, 2013
- ^ Population of the Paris department on January 1, 2013
- ↑ 38. Press release from the National Statistics Institute of Romania
- ↑ www.statistik.at
- ↑ Population of Hamburg (monthly figures)
- ^ Population of Budapest on January 1, 2013 ( Memento from October 17, 2013 in the Internet Archive )
- ↑ population. Size and Structure by Territorial Division. As of June 30, 2019. Główny Urząd Statystyczny (GUS) (PDF files; 0.99 MiB), accessed December 24, 2019 .
- ↑ Population of cities in Bavaria ( Memento of the original from October 9, 2014 in the Internet Archive ) Info: The archive link was inserted automatically and has not yet been checked. Please check the original and archive link according to the instructions and then remove this notice.
- ^ Population of Sofia on December 31, 2012
- ↑ Population of Prague on December 31, 2013 ( MS Excel ; 66 kB)
- ↑ Population of the municipalities of North Rhine-Westphalia on December 31, 2019 - update of the population based on the census of May 9, 2011. State Office for Information and Technology North Rhine-Westphalia (IT.NRW), accessed on June 17, 2020 . ( Help on this )
- ↑ European Union: Special Eurobarometer - The Europeans and their languages ( Memento of the original from March 9, 2013 in the Internet Archive ) Info: The archive link has been inserted automatically and has not yet been checked. Please check the original and archive link according to the instructions and then remove this notice. , (pdf file, 6.77 MByte, accessed November 25, 2010)
- ↑ Eurobarometer 83.4 (May-June 2015): Climate change, Biodiversity and Discrimination of Minority Groups. Retrieved November 10, 2017 .
- ↑ EuroStat Glossary: Healthy Life Years (GLJ) , accessed on April 22, 2019
- ↑ Glossary: Death . European Union. Retrieved April 22, 2019.
- ↑ Healthy Years of Life and Life Expectancy at Age 65 by Gender , EuroStat, accessed April 22, 2019
- ^ Sullivan's Method , accessed April 22, 2019
- ↑ Healthy life years (CODED - Eurostat Concepts and Terms Database) , accessed April 22, 2019
- ↑ a b EuroStat statistics explained: Healthy life years statistics , accessed on April 22, 2019
- ↑ Regulation (EC) No. 1177/2003 of the European Parliament and of the Council of June 16, 2003 on Community Statistics on Income and Living Conditions (EU-SILC)
- ↑ Life expectancy in the EU. Eurostat, accessed on 6 July 2018 .
- ↑ United Nations Development Program (Ed.): Human Development Report 2015 . ISBN 978-92-1126398-5 ( Online [PDF; accessed January 9, 2018]).
- ↑ a b c d The World Factbook - Central Intelligence Agency. Retrieved September 10, 2017 .
- ↑ a b Eurostat 2005 ( Memento of the original dated December 8, 2006 in the Internet Archive ) Info: The archive link was inserted automatically and has not yet been checked. Please check the original and archive link according to the instructions and then remove this notice.
- ↑ Eurostat 2007 ( Memento of the original dated March 31, 2010 in the Internet Archive ) Info: The archive link was inserted automatically and has not yet been checked. Please check the original and archive link according to the instructions and then remove this notice.
- ↑ http://epp.eurostat.ec.europa.eu/statistics_explained/index.php?title=File:Total_fertility_rate,_1960-2011_%28live_births_per_woman%29.png&filetimestamp=20130129121040
- ↑ Archived copy ( memento of the original from October 6, 2014 in the Internet Archive ) Info: The archive link was inserted automatically and has not yet been checked. Please check the original and archive link according to the instructions and then remove this notice.
- ↑ http://www.presseurop.eu/en/content/article/3869241-new-promised-land
- ↑ Number of German retirees outside the Federal Republic is growing
- ↑ a b 5.4 million children born in EU27 in 2008 . Eurostat. Archived from the original on May 10, 2013. Info: The archive link was inserted automatically and has not yet been checked. Please check the original and archive link according to the instructions and then remove this notice. Retrieved October 21, 2014.
- ↑ Population projections 2008-2060
- ↑ European Commission: Demographic Analysis (short summary of five strategies for coping with the challenges of demographic change, html). ec.europa.eu. Without an article date in the article text (from around 2013), accessed on July 4, 2016 .