
Sunspot
Sunspots are dark spots on the visible solar surface ( photosphere ) that are cooler and therefore emit less visible light than the rest of the surface. Their number and size form the simplest measure of what is known as solar activity . The frequency of sunspots is subject to an average periodicity of eleven years, which is known as the sunspot cycle . The cause of the spots and the outbreaks occurring in their vicinity are strong magnetic fields , which in some areas hinder the transport of heat from the interior to the sun's surface.


In contrast to the optical impression in the telescope, sunspots are by no means black, but - according to Planck's law of radiation - only emit about 30% of normal sunlight. This value follows from their temperature, which is up to 1500K lower than that of their surroundings . The total area of the sunspots varies depending on the phase in the 11-year cycle between 0.0 and a maximum of 0.4% of the total surface.
Emergence
Since the sun consists of hot, fluctuating gases, its surface does not move uniformly either: the equatorial regions rotate in around 25 days, while those in the near polar latitudes need 30 or more days to complete one orbit. This leads to distortions of the internal - initially bipolar - magnetic field in the course of a cycle (see below). Local field arcs are created that break through the photosphere and carry its matter out into the corona ; the resulting cooling of the surface becomes visible as a stain. Where the field lines are perpendicular, it is darkest (umber), where they run obliquely to the surface, it is less dark (penumbra).
Since the arcs each have an entry and exit point, sunspots appear in pairs. The leading spot is closer to the solar equator than the trailing spot ; This deviation decreases with increasing distance from the solar poles ( Act Joy ). The polarity of the preceding spot corresponds to that of the respective solar hemisphere, the opposite applies to the one behind.
As the cycle progresses, the spots become more frequent and larger (group formation). Finally they gather at the equator, where they largely neutralize one another; the rest of the magnetized gas fields are carried to the poles: The total magnetic field of the sun becomes uniform again (bipolar), but with reversed polarity.
The exact properties of the underlying so-called solar dynamo have not yet been fully clarified.
Sunspots are usually fringed by faculae or plages : hot regions that emit high-energy radiation. If there is a "short circuit" of the field arcs, the magnetic field collapses suddenly and the plasma is released; the result is a coronal mass ejection .
properties
Temperatures and magnetic fields
The mean surface temperature of the sun is around 5770 K, as it radiates almost like a Planckian " black body " at a radiation temperature of 6050 K. At these temperatures, the maximum energy emitted is in the range of visible light . The core area of a sunspot, the umbra (" umbra "), is only around 4270 K hot, the surrounding area - the penumbra (" penumbra ") around 5207 K. At these lower temperatures, the radiation intensity in visible light drops significantly, in the umber to about 30%. Umbra and penumbra therefore appear significantly darker when observed through a solar filter or when projecting the eyepiece .
The reason for the cooling are strong magnetic fields, which hinder the convection and thus the heat transport from the inside of the sun. In visible light, the sunspots therefore indicate the most active regions on the sun. In addition, with a high number of sunspots it can happen that two adjacent, but oppositely polarized magnetic field lines reconnect ( reconnection ) and release the released energy into the room. Flares are a visible variant . If there is an outbreak of radiation in the direction of the earth, this can lead to strong disturbances in the earth's magnetic field and even affect the operation of satellites or electrical systems on earth. In addition, such a radiation outbreak increases the likelihood of northern lights even in moderate latitudes.

With a measuring device from the Solar and Heliospheric Observatory , the speed of sound could be measured both in the vicinity of sunspots and at a depth of 24,000 km. The cause of the sometimes considerable deviations has not yet been clarified.
In years with a reduced number of spots, solar radiation is also reduced by around 1 ‰. The lower solar radiation on the earth during a minimum of spots causes a reduction in the surface temperature of up to 0.1 ° C. Stronger climatic fluctuations can also occur regionally . The years between 1645 and 1715, the Maunder minimum, during which no sunspots were observed, coincide with the Little Ice Age . In addition to reduced volcanic activity and other factors, the lower solar radiation is considered to be the cause of the cooling at that time.
As the sun's activity fluctuates, so does the earth's ionosphere . This has an impact on radio transmission in the shortwave range . ( See also: amateur radio )
Sunspot groups
Sunspots usually appear in groups, but begin as small individual spots from the union of several convection cells ( granules ). As soon as a single spot grows, it becomes a magnetically bipolar group ( type B ). Some spots grow, form the above-mentioned farms (penumbra) and are then used as type C and type D , respectively. They regress after a few days or weeks ( types H and J ). However, some continue to grow and can extend as Type E, F or G for more than 200,000 km. These giant groups can persist for several months and be accompanied by flare eruptions . But they only occur around the sunspot maximum.
The sunspots can be used to observe the rotation of the sun as they move along on the surface. At the equator , the sun rotates around 20% faster than near the pole, with a period of 25.03 days. This phenomenon, known from the physics of fluids, is called differential rotation . The apparent period of revolution at the solar equator for an observer on earth is, however, 26.87 days due to the earth's orbit around the sun in the same direction and is called the synodic period .

Sunspot, terrestrial image

Image of a huge sunspot captured by ALMA .
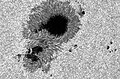
Sunspot from December 13, 2006, Ø ≈ 20,000 km, colored grayscale image by Hinode , 480–640 nm

Magnetic field in the vicinity of a sunspot

Simulation of magnetic field lines on the sun

.jpg)


.jpg)
Cycles

The sunspot cycle describes the periodicity in the frequency of sunspots. It describes a period of an average of 11 years, which is also known as the Schwabe cycle after Samuel Heinrich Schwabe . In the spot minimum, no spots are often seen for months , but hundreds at the sunspot maximum. Within this cycle, the patches change their heliographic latitude and magnetic polarity , so that they actually follow a 22-year cycle ( Hale cycle according to George Ellery Hale ).
Duration of a cycle
The 11-year sunspot cycle is not exactly regular. Although the average is 11.04 years, cycles of 9 to 14 years also occur. The average value also varies over the centuries - the solar cycles in the 20th century, for example, at 10.2 years on average, were shorter than those of previous centuries. The course of the Maund minimum and further minima suggests a variation in the total intensity of the sun on a time scale of several 100 years, which is still unconfirmed, however, as the recordings have not been made long enough. The 10 Be distribution in the Greenland Ice suggests more than 20 extreme solar minima within the last 10,000 years.
The course of the cycle itself is not constant either. The transition from the minimum to the maximum of solar activity occurs faster, the higher the maximum will be. This was first postulated by the Swiss astronomer Max Waldmeier . In contrast to the steep rise, however, the number of sunspots only decreases slowly when the minimum is reached. Only in the case of a very low maximum are ascent and descent approximately the same length.
Start and end of a cycle

In the past, the beginning of a new cycle was derived from the low point of the cycle curve. Thanks to improved measurement technology, it is now possible to determine the magnetic field polarity of sunspots. A new cycle begins when the polarity of related spots on the sun's surface is reversed. The resolution of the figure on the right is too low to be able to read the point in time of the change, but the reversal of polarity between neighboring phases can be clearly seen.
The cycles were numbered consecutively by Rudolf Wolf , starting in 1749 (see history ). The sun is currently in the 24th cycle.
During the end of the 23rd to the 24th cycle, sunspots with the old polarity as well as new ones with reversed polarity were observed in March 2008. The actual minimum and the clear beginning of the 24th cycle could not be differentiated even in October 2008. The calm sun showed a late weak maximum in February 2014 and suggests an even weaker one around 2023.
| Cycle number | Start: year-month | Maximum: year-month | Sunspot relative number |
|---|---|---|---|
| 18th | 1944-02 | 1947-05 | 201 |
| 19th | 1954-04 | 1957-10 | 254 |
| 20th | 1964-10 | 1968-03 | 125 |
| 21st | 1976-06 | 1979-01 | 167 |
| 22nd | 1986-09 | 1989-02 | 165 |
| 23 | 1996-09 | 2000-03 | 139 |
| 24 | 2008-01 | 2014-02 | 102 |
As mentioned above, the two spots in a bipolar group have a different magnetic orientation, just like the leading spots in the northern hemisphere have an opposite magnetic orientation to those in the southern hemisphere. However, the polarity of the preceding spots does not change within a sunspot cycle. This only changes with the next sunspot cycle, so that a complete cycle spans 22 years ( Hale cycle ).
In the 19th century and up to around 1970 it was assumed that there could still be an approximately 80-year period (Gleißberg cycle, after Wolfgang Gleißberg ), which resulted in low values of the relative number R from 1800 to 1840 and (less clearly) 1890 –1920 expressed. More recent research has deviated from this hypothesis or explains the fluctuations by a kind of super convection. Other hypotheses speak not only of an 80-year cycle, but also of an additional 400-year cycle.
Duration of the ascent and descent according to Max Waldmeier
According to the eruption theory developed by Max Waldmeier , the descent from the maximum of the spots to the minimum takes longer, the higher the maximum. This connection is called the Waldmeier effect . In contrast, the rise to a high maximum is shorter than the average; the integral over time (i.e. the area under the activity curve) is almost constant.
Although Waldmeier's hypothesis became obsolete due to the discovery of magnetic field disturbances in sunspots, the statistics of the ascents and descents are true except for rare fluctuations.
Width effect


At the beginning of a sunspot cycle, the first spots form at about 30 ° - 40 ° heliographic latitude north and south of the solar equator. In the course of the following years, the areas of origin shifted further and further towards the equator. Halfway through the cycle, solar activity is at its highest and sunspots appear at around 15 ° latitude. The number and area is greatest now. At the end of the cycle, isolated spots form approximately ± 5 ° in width and the cycle ends. At the same time, however, the first spots of the next cycle are forming in the high latitudes.
If the distribution on the latitudes and the extent of the spots are plotted in a diagram over time ( Spörer's law ), the result is a butterfly diagram - similar to the open wings of a butterfly .
Active longitudes and flip-flop cycle
Since the beginning of the 20th century, people have been looking for excellent longitudes in which sunspots tend to occur (active longitudes), but the search remained unsuccessful for a long time - the longitudes found varied, depending on the evaluation method, both in number and in their location, and they were not stable over long periods of time. At the beginning of the 21st century, however, the situation seems to change: Usoskin and Berdyugina investigated the approach of “wandering longitudes” and found two active longitudes offset by 180 °, which are subject to differential rotation and did not change over the examined period of 120 years . After the results of the first publications were questioned as possible "artifacts" of the evaluation and filter technology used, the results could meanwhile also be verified on the raw data without further filtering.
The two active longitudes are not active at the same time: the activity changes from one to the other within a solar rotation, the average period here is 3.8 years in the northern hemisphere and 3.65 in the southern hemisphere - about a third of the Schwabe cycle. This cycle, which was discovered in the activity of stars as early as 1998, is also called the flip-flop cycle .
Quantification of the sunspots

Relative number of sunspots
The frequency of sunspots has long been recorded by the relative number (also called Wolf's relative number, defined by Rudolf Wolf , or Zurich Sunspot Number , according to the Swiss Federal Observatory in Zurich ). The individual spots (number f) are counted and ten times the number of groups (g) are added, with single spots (type A and I) also counting as a "group". The results of the counts depend on the observer and his instruments. Therefore they have to be made comparable by an individual correction factor k. The resulting simple measure of solar activity

For over 100 years, it has proven itself just as well as the complex area measurement of sunspots (maximum per thousand of the sun's area).
Thanks to the simple calculation method, it is possible to estimate far back in time - more precisely from 1610, the year the telescope was invented . The headquarters to which observatories and many amateur astronomers reported these daily measurements was the Swiss Federal Observatory in Zurich until the end of 1979, and since then the data has been collected at the Observatoire royal de Belgique . The organization based there is called SIDC (Solar Influences Data Analysis Center). There are, however, a number of other observer networks that collect data and exchange it with one another.

In a minimum year the mean is below 10 (de facto 0 to 3 small spots), at the time of the maximum the monthly mean increases to 60 to 200 (on average about 5 to 10 larger groups of spots). However, since the visibility of spots increases with the size of the telescope used, the Zurich formula was developed, which refers to a “standard telescope”. This sometimes results in strange relative numbers (e.g. for a single spot instead of observed ), but this does not affect the value of the measure.


Already with a small telescope from 5 to 10 cm aperture to solar activity and cycle, can be rotational , butterfly effect and other well observed (see also solar observation ). Of course, you should never look into the sun through an unprotected telescope - this can cause serious eye damage! Special solar filters or special optics ( Herschel wedge , H-alpha filter ) are used as professional aids for safe observation . The easiest way is to the sun's image onto white paper projected by the eyepiece unscrewed a few millimeters and the paper a few decimeter is kept behind ( eyepiece ). The north direction can also be determined so easily because the image moves precisely to the west due to the earth's rotation .
10.7 cm radio flux index
The relative number of spots correlates very strongly with the radio wave radiation of the sun at 10.7 cm wavelength. The radiation intensity is referred to as Radio Flux Index F 10.7 . The radiation density is measured in W / m² / Hz , sometimes given in Jansky , but mostly in Solar Flux Units (sfu):
- 1 sfu = 10 4 Jy = 10 −22 W / m² / Hz
The solar flux is more suitable for measuring solar activity than the sunspot relative number, as this depends on the subjective, manual counting of the sunspots. It can be converted into the sunspot relative number and vice versa.
Classification
Waldmeier classification
The Swiss astronomer Max Waldmeier (dissertation around 1935) came up with the idea of dividing the various types and sizes of sunspots into a scheme that also reflects the development over time: from small individual spots (type A, see picture) to huge shaded areas (type E and type F) and the subsequent regression.
Small spots (A) develop from so-called pores (larger cells of the granulation ), but often disappear again after a few hours. If they exist a little longer, they become magnetically bipolar (type B or C) and can sometimes develop into D or E / F and persist for several weeks as a group of spots up to 250,000 km long. Most of the time, however, the regression of B or C spots goes directly to types H or J.
Stages of development

The local amplification of the magnetic field hinders - as mentioned above - the heat transport of some convection cells. The darker grain of these granules (about 1000 K cooler) develops into a single spot (type A). Some of them go away within a few days, others develop into a bipolar group of two (B). Larger groups (types C to D) with penumbra can develop from them, which occasionally reach stage E / F with up to 100 spots. These groups of spots (up to 200,000 km in size) (see cover picture) regress to small double and single spots (H, I) within a few weeks or months.
According to this classification by Max Waldmeier (around 1940), not all of the small spots of type A / B become larger groups of spots of type C and higher, but rather small pores with penumbra (stage H or I). Only if they develop into the largest types D, E or F can they become dark double spots with penumbra when they regress. Such groups of two are always magnetically polarized differently, and on the other hemisphere exactly the other way round. This is an indication of large, slow currents in the interior of the sun, which also cause the 11-year rhythm.
Group type E
A type E sunspot group is the second largest stage of development of bipolar groups of spots. It can only occur several times a month when there is high solar activity - that is, when there are many sunspots.
Type E has numerous single spots (20–100) and like types D, F and G clear penumbra . There the temperature of the solar gas (on average just under 6270 K) is only slightly above 5270 K, compared to 4270 K in the darkest parts of the umber . A typical E group has dimensions of 10 earth diameters; the earth itself would disappear in some isolated spots.
Group type F
A sunspot group of type F is the largest, but not very common stage of development of bipolar groups of spots. An example can be seen in the photo above.
According to Max Waldmeier's classification, not all small sunspot groups of type A or B develop into larger sunspot groups of types C to E. With sufficient solar activity, i. In other words, with many magnetic disturbances and sunspots, type F often arises from type E and presupposes this.
Type F has the largest number of single spots (up to about 200) and the maximum area of penumbra, the penumbra. There the normal temperature of the solar gas is only reduced by about 500 to 1000 K, compared to 2000 K in the darkest parts of the umber.
After about 2–10 weeks, the group regresses as a single spot (type I) via type G or H until it disappears.
Further classifications
The Royal Greenwich Observatory conducted extensive solar observations from 1875 to 1997 . The sunspots were divided into individual spots, pairs, groups and their combinations with 10 categories.
history


Some sunspots are so large that you can see them with the naked eye at sunset , for example. There has been a record of this for over 2000 years. Observations from Anaxagoras (around 467 BC) cannot be clearly assigned. Theophrastus v. Eresus (4th / 3rd century BC) clearly speaks of a spot on the sun in his "weather signs". Records from China date back to 165 and 28 BC. Chr.
Avicenna reported that a sunspot could be seen on the sun for eight days in the year 807 . An observation from the year 1128 by John of Worcester went unnoticed, since the worldview of that time could only imagine a "flawless" sun. Any spots therefore had to be objects between the earth and the sun, such as undiscovered planets, moons or clouds .
In different epochs, however, ideas appeared that saw dark holes, floating cinders or cooler spots in the sunspots .
Systematic observation of sunspots began after the invention of the telescope . The oldest private record from this period is from December 8, 1610 by Thomas Harriot . In March 1611, Johann Fabricius first published on sunspots.

Long-term observations were carried out independently by Galileo Galilei and Christoph Scheiner . Galileo wrote in his lettere solari in 1613 about his observations going back to 1611. Scheiner discovered the sunspots from the tower of the Holy Cross Church in Ingolstadt on the morning of March 21, 1611 together with his student Johann Baptist Cysat . Early on, Galileo took today's view that the spots were structures on the surface of the sun.
The observation of sunspots was then carried out only sporadically because of the Maunder minimum (1645–1715). During these 70 years the sun had a period of low sunspot activity. Around then the lighter areas of the sun flares were discovered.
As early as the 18th century, the Danish astronomer Christian Pedersen Horrebow suggested that some activity phenomena show a certain periodicity in relation to their frequency. In the Göschen volume astrophysics by WF Wislicenus 1899 (1st edition) and 1909 (3rd edition revised by Hans Ludendorff ) the following is written:
“In 1775 Horrebow suggested that the spots show a certain periodicity in relation to the frequency of their appearance. This assumption was confirmed in the 19th century by Schwabe's investigations. "
Christian Pedersen Horrebow (1718–1776) was like his father Peder Nielsen Horrebow (1679–1764) director of the observatory in Copenhagen , which until 1861 was based in Rundetårn .
However, recognition for the discovery of the cyclical nature of sunspot activity went to the Anhalt pharmacist and amateur astronomer Samuel Heinrich Schwabe from Dessau. On the basis of his everyday observations over the course of 17 years (1826–1843) he also noticed that the frequency of sunspots fluctuates periodically in a ten-year trend. Schwabe then submitted the documents and his conclusions to the then director of the Swiss Federal Observatory in Zurich, Rudolf Wolf , who confirmed them.
Using thousands of other solar information and names of sunspots from the 17th to 19th centuries, Wolf began to calculate the periodicity of the sunspots over the year 1826 to Galileo. Wolf reconstructed the statistical development of solar activity from 1749 onwards, called the Zurich time series.
Wolf numbered the sunspot cycles and selected the 0th cycle as the starting point with its maximum in 1749. Previous cycles were given negative numbers.
Current
The researchers hope that the STEREO satellites will provide new insights into solar anomalies. The 3D information should help to understand the physics of the sun even better and allow better predictions about the influences of solar activity on the earth.
Two other satellites also play an important role in the observation of the sun: the aging SOHO and, since 2010, the SDO .
See also
- astrophysics
- Sunspot theory , explanatory approach of business cycle theory
literature
- Judit Brody: The enigma of sunspots. A story of discovery and scientific revolution. Floris Books, Edinburgh 2002, ISBN 0-86315-370-4 .
- Michael Stix: The Sun. An Introduction. 2nd edition, corrected, 2nd printing. Springer, Berlin a. a. 2004, ISBN 3-540-20741-4 .
- John H. Thomas (Ed.): Sunspots. Theory and observations. Kluwer, Dordrecht u. a. 1992, ISBN 0-7923-1852-8 ( NATO ASI series. Series C: Mathematical and physical sciences 375).
- John H. Thomas, Nigel O. Weiss: Sunspots and Starspots. Cambridge University Press, Cambridge 2008, ISBN 978-0-521-86003-1 ( Cambridge Astrophysics Series 46).
Web links
- What are sunspots and solar storms? from the alpha-Centauri television series(approx. 15 minutes). First broadcast on July 18, 1999.
- Classification according to Waldmeier
- VdS Sun specialist group / worldwide amateur solar observation network
Individual evidence
- ↑ J. Bennett, et al .: M.Donahue astronomy. The cosmic perspective (Ed. Harald Lesch ), 5th, updated edition (1170 pp.), Chapter 14; Pearson Studium Verlag, Munich 2010
- ↑ Jing Li / Roger K. Ulrich: Long-term measurements of sunspot magnetic tilt angles
- ↑ Four Years of SOHO Discoveries, page 8 (PDF; 5.7 MB)
- ↑ AP Schurer et al. a .: Small influence of solar variability on climate over the past millennium . In: Nature Geoscience . 2015, doi : 10.1038 / NGEO2040 .
- ^ Mike Lockwood: Solar Influence on Global and Regional Climates . In: Surveys in Geophysics . 2012, chap. 6 , doi : 10.1007 / s10712-012-9181-3 (English, link.springer.com ).
- ^ Causes of Change in Large-Scale Temperature over the Past Millennium . In: Intergovernmental Panel on Climate Change [IPCC] (Ed.): Fifth assessment report (AR5) . 2013, 10.7.1.
- ↑ solar irradiance and Grand Minima ( Memento of 25 May 2009 at the Internet Archive )
- ^ Herrmann, Joachim: dtv-Atlas Astronomie. Deutscher Taschenbuch Verlag, Munich, 2005. ISBN 3-423-03267-7
- ^ Change of solar cycle March 2008
- ↑ Sunspot relative numbers
- ↑ Solar Cycle 24 begins on January 4, 2008. NASA, accessed August 31, 2009 .
- ↑ M. Waldmeier 1935, dissertation at the ETH Zurich, cf. also Max Waldmeier: New properties of the sunspot curve . In: Astronomical communications from the Swiss Federal Observatory, Zurich . tape 14 , 1935, pp. 105-136 ( harvard.edu - full text online).
- ↑ Ashok Ambastha: Physics of the Invisible Sun: Instrumentation, Observations, and Inferences . CRC Press, 2020, ISBN 978-1-00-076071-2 , Chapter 4.7.5 The Waldmeier Effect, p. 105-106 .
- ↑ SV Berdyugina, IG Usoskin: Active longitudes in sunspot activity. Century scale persistence. A&A, 2003, 405, 1121-1128.
- ↑ SV Berdyugina, IG Usoskin, J. Poutanen: Preferred sunspot longitudes: non-axisymmetry and differential rotation. A&A, 2005, 441, 347-352.
-
^ Zurich Sunspot Number. astronomy.swin.edu.au;
Semper observatory. Collegium Helveticum: About us (on collegium.ethz.ch). - ↑ Hans-Ulrich Keller: Compendium of Astronomy: Introduction to the Science of the Universe. Kosmos, 2019. Chapter 4.1 The sun. Page 99.
- ^ Measuring Energy from the Sun. In: Space Today Online. Retrieved August 31, 2009 .
- ↑ NASA
- ↑ Willis, DM; Davda, VN; Stephenson, FR: Comparison between Oriental and Occidental Sunspot Observations, Quarterly Journal of the Royal Astronomical Society, Vol. 37, 1996
- ↑ Jacques Gernet: The Chinese World. Suhrkamp, Frankfurt am Main 1997, p. 574.
- ↑ Linton, p. 228.
- ↑ Solar observations in 1843 , Schwabe, 1843
- ↑ Sun images in 3-D. In: sueddeutsche.de. April 24, 2007, accessed July 7, 2010 .