
World population: Difference between revisions
No edit summary |
fixed # per talk page; also removing ref that isn't need in lead and doesn't appear to support anything that isn't already amply supported in the main body |
||
| Line 1: | Line 1: | ||
{{Short description|Total number of living humans on Earth}} |
|||
[[Image:World population.svg|right|thumb|400px|Map of [[countries]] by population—[[People's Republic of China|China]] and [[India]], the only two countries to have a population greater than 1 billion, together possess more than a third of the world's population. (See ''[[List of countries by population]].'')]] |
|||
{{pp-vandalism|small=yes}} |
|||
[[Image:WorldPopulation.png|thumb|Population by continent as a percentage of world population (1750–2005)]] |
|||
{{Use American English|date=November 2022}} |
|||
{{Use dmy dates|date=March 2024}} |
|||
[[File:World Population Prospects.svg|thumb|High, medium, and low projections of the future human world population<ref name=":4">{{Cite web |date=2022 |title=World Population Prospects 2022, Graphs / Profiles |url=https://population.un.org/wpp/Graphs/Probabilistic/POP/TOT/900 |access-date= |publisher=United Nations Department of Economic and Social Affairs, Population Division}}</ref>]] |
|||
In [[demographics of the world|world demographics]], the '''world population''' is the total number of humans currently living. It was estimated by the United Nations to have exceeded eight billion in mid-November 2022. It took around 300,000 years of human [[prehistory]] and [[human history|history]] for the human population to reach a billion and only 218 years more to reach 8 billion. |
|||
The '''world population''' is the total number of living [[human]]s on [[Earth]] at a given time. As of September 2008, the world's [[population]] is estimated to be about '''6.7 [[billion]]''' (6,700,000,000). In line with population projections, this figure continues to [[population growth|grow]] at rates that were unprecedented before the 20th century, although the rate of growth has almost halved since its peak of 2.2% per year, which was reached in 1963. The world's population, on its current growth trajectory, is expected to reach nearly 9 billion by the year 2042.<ref>[http://www.worldometers.info/population/ World Population Clock - Worldometers]</ref><ref>[http://www.census.gov/ipc/www/idb/worldpopinfo.html International Data Base (IDB) - World Population]</ref> |
|||
The human population has experienced [[Population growth|continuous growth]] following the [[Great Famine of 1315–1317]] and the end of the [[Black Death]] in 1350, when it was nearly 370,000,000.<ref>Jean-Noël Biraben (1980), "An Essay Concerning Mankind's Evolution". ''Population'', Selected Papers. Vol. 4. pp. 1–13. Original paper in French:(b) Jean-Noël Biraben (1979)."Essai sur l'évolution du nombre des hommes". ''Population''. Vol. 34 (no. 1). pp. 13–25.</ref> The highest global [[List of countries by population growth rate|population growth rates]], with increases of over 1.8% per year, occurred between 1955 and 1975, peaking at 2.1% between 1965 and 1970.<ref name=":1">{{cite web |url=https://esa.un.org/unpd/wpp/DataQuery/ |title=World Population Prospects |publisher=United Nations|access-date=15 September 2016|archive-url=https://web.archive.org/web/20160919061238/https://esa.un.org/unpd/wpp/DataQuery/|archive-date=19 September 2016|url-status=dead}}</ref> The growth rate declined to 1.1% between 2015 and 2020 and is projected to decline further in the 21st century.<ref name=":8">{{Cite web |date=2019 |title=World Population Prospects, Standard Projections, Archive, 2019 Revision |url=https://population.un.org/wpp/Download/Archive/Standard/ |website=United Nations Department of Economic and Social Affairs, Population Division}}</ref> The global population is still increasing, but there is significant uncertainty about its long-term trajectory due to changing [[Total fertility rate|fertility]] and [[Mortality rate|mortality]] rates.<ref>{{Cite journal |last1=Ortiz-Ospina |first1=Esteban |last2=Roser |first2=Max |date=9 May 2013 |title=World Population Growth |url=https://ourworldindata.org/world-population-growth |journal=Our World in Data|access-date=13 October 2016|archive-url=https://web.archive.org/web/20161013144559/https://ourworldindata.org/world-population-growth/|archive-date=13 October 2016|url-status=live}}</ref> The [[UN Department of Economics and Social Affairs]] projects between 9 and 10 billion people by 2050 and gives an 80% [[confidence interval]] of 10–12 billion by the end of the 21st century,<ref name=":4" /> with a growth rate by then of zero. Other [[Demography|demographers]] predict that the human population will begin to decline in the second half of the 21st century.<ref>{{Cite news |last1=Cave |first1=Damien |last2=Bubola |first2=Emma |last3=Sang-Hun |first3=Choe |date=22 May 2021 |title=Long Slide Looms for World Population, With Sweeping Ramifications |language=en-US |work=The New York Times |url=https://www.nytimes.com/2021/05/22/world/global-population-shrinking.html |archive-url=https://ghostarchive.org/archive/20211228/https://www.nytimes.com/2021/05/22/world/global-population-shrinking.html |archive-date=28 December 2021 |url-access=limited|access-date=23 May 2021 |issn=0362-4331}}{{cbignore}}</ref> |
|||
==Population figures== |
|||
The total number of births globally is currently (2015–2020) 140 million/year, which is projected to peak during the period 2040–2045 at 141 million/year and then decline slowly to 126 million/year by 2100.<ref name=":2" /> The total number of deaths is currently 57 million/year and is projected to grow steadily to 121 million/year by 2100.<ref name=":3" /> |
|||
Censuses taken between 300–400 AD{{Dubious|date=March 2008}} showed over 50 [[million]] people living in the combined eastern and western Roman empire.{{Fact|date=February 2008}}(citation Dr. Kenneth W. Harl, tulane.edu) |
|||
The [[median]] [[median age|age]] of human beings {{As of|2020|lc=y}} is 31 years.<ref name=":0">{{Citation |title=World |date=19 October 2021 |url=https://www.cia.gov/the-world-factbook/countries/world/ |work=The World Factbook |publisher=Central Intelligence Agency |language=en|access-date=1 November 2021}}</ref> |
|||
Below is a [[table]] with historical and predicted [[population]] figures shown in millions.<ref name="unpp">[http://esa.un.org/unpp World population prospects]: the 2004 revision population database</ref><ref>[http://www.un.org/esa/population/publications/sixbillion/sixbillion.htm The World at un.org]</ref><ref name=autogenerated1>[http://www.globalchange.umich.edu/globalchange2/current/lectures/human_pop/human_pop.html Population Growth over Human History]</ref> The availability of historical population figures varies by region. (Note: These projections here are not kept up to date.) Please see [[World population estimates]] for more figures. |
|||
==History== |
|||
[[File:Illustration of contemporary and past human populations Our World in Data.png|thumb|Visual comparison of the world population in past and present]] |
|||
{{Further|Estimates of historical world population|Human history}} |
|||
Estimates of world population by their nature are an aspect of [[modernity]], possible only since the [[Age of Discovery]]. Early estimates for the population of the world<ref>the [[English compound|compound]] "world population" becomes common from c. the 1930s, adapted from early 20th-century "world's population"; pre-20th century authors use "population of the world".</ref> date to the 17th century: [[William Petty]], in 1682, estimated the world population at 320 million (current estimates ranging close to twice this number); by the late 18th century, estimates ranged close to one billion (consistent with current estimates).<ref>"The population of the world, which Sir W. P. in 1682, stated at only 320 millions, has been estimated by some writers at about 730 million, by others, at upwards of 900 million; Mr. Wallace, of Edinburgh, conjectured it might amount to 1 billion, and this number has since generally been adopted who have noticed the subject;" ''The Monthly Magazine'' 4 (July–December 1797), [https://books.google.com/books?id=0S0AAAAAYAAJ&pg=PA167 p. 167].</ref> More refined estimates, broken down by continents, were published in the first half of the 19th century, at 600 million to 1 billion in the early 1800s and 800 million to 1 billion in the 1840s.<ref>600 million: Simon Gray, ''The Happiness of States'' (1818), [https://books.google.com/books?id=ue5eAAAAcAAJ&pg=PA356 p. 356] {{Webarchive|url=https://web.archive.org/web/20190606203312/https://books.google.com/books?id=ue5eAAAAcAAJ&pg=PA356 |date=6 June 2019 }}. |
|||
800 million: Gordon Hall, Samuel Newell, ''The Conversion of the World'' (1818), [https://books.google.com/books?id=ZzA3AAAAMAAJ&pg=PA10 p. 10] {{Webarchive|url=https://web.archive.org/web/20190606203315/https://books.google.com/books?id=ZzA3AAAAMAAJ&pg=PA10 |date=6 June 2019 }}. |
|||
800 to 1000 million: John Redman Coxe, ''Considerations Respecting the Recognition of Friends in Another World'' (1845), [https://archive.org/details/60340180R.nlm.nih.gov/page/n28 p. 21] (footnote with references).</ref> |
|||
It is difficult for estimates to be better than rough approximations, as even current population estimates are fraught with uncertainties from 3% to 5%.<ref name=Kapitza2 /> |
|||
===Ancient and post-classical history=== |
|||
{{main|Classical demography|Medieval demography}} |
|||
Estimates of the population of the world at the time agriculture emerged in around 10,000 BC have ranged between 1 million and 15 million.<ref>{{cite book |author=Luc-Normand Tellier |date=2009 |url=https://books.google.com/books?id=cXuCjDbxC1YC&pg=PA26 |title=Urban world history: an economic and geographical perspective |page=26 |isbn=978-2-7605-1588-8}}</ref><ref>Ralph Thomlinson, 1975, Demographic Problems: Controversy over population control, 2nd Ed., Dickenson Publishing Company, Ecino, CA, {{ISBN|0-8221-0166-1}}.</ref> Even earlier, genetic evidence suggests humans may have gone through a population bottleneck of between 1,000 and 10,000 people about 70,000 BC, according to the now largely discredited [[Toba catastrophe theory]]. By contrast, it is estimated that around 50–60 million people lived in the combined eastern and western [[Roman Empire]] in the 4th century AD.<ref>{{cite web |url=http://www.tulane.edu/~august/H303/handouts/Population.htm |title=Population estimates of the Roman Empire |year=1998 |publisher=Tulane.edu|archive-url=https://web.archive.org/web/20160507061006/http://www.tulane.edu/~august/H303/handouts/Population.htm|archive-date=7 May 2016 |author=Dr. Kenneth W. Harl |access-date=8 December 2012}}</ref> |
|||
The [[Plague of Justinian]] caused Europe's population to drop by around 50% between the 6th and 8th centuries AD.<ref>{{cite web |url=http://science.nationalgeographic.com/science/health-and-human-body/human-diseases/plague-article.html |title=Plague, Plague Information, Black Death Facts, News, Photos |work=National Geographic |access-date=3 November 2008 |archive-url=https://web.archive.org/web/20130722230538/http://science.nationalgeographic.com/science/health-and-human-body/human-diseases/plague-article.html |archive-date=22 July 2013 |url-status=dead}}</ref> The population of Europe was more than 70 million in 1340.<ref>{{cite encyclopedia |url=http://www.britannica.com/EBchecked/topic/195896/history-of-Europe/276190/Demographic-and-agricultural-growth#ref=ref994290 |title=History of Europe – Demographic and agricultural growth |encyclopedia=Encyclopædia Britannica |year=2012|access-date=17 December 2012|archive-url=https://web.archive.org/web/20121220154316/http://www.britannica.com/EBchecked/topic/195896/history-of-Europe/276190/Demographic-and-agricultural-growth#ref=ref994290|archive-date=20 December 2012|url-status=live}}</ref> From 1340 to 1400, the world's population fell from an estimated 443 million to 350–375 million,<ref>{{cite web |url=https://www.census.gov/population/international/data/worldpop/table_history.php |title=Historical Estimates of World Population |publisher=Census.gov|access-date=12 November 2016|archive-url=https://web.archive.org/web/20120709092946/https://www.census.gov/population/international/data/worldpop/table_history.php|archive-date=9 July 2012|url-status=live}}</ref> with the [[Indian subcontinent]] suffering the most tremendous loss and Europe suffering the [[Black Death]] [[pandemic]];<ref name="Essai sur l'évolution du nombre des hommes">{{cite journal |last1=Biraben |first1=Jean-Noël |title=Essai sur l'évolution du nombre des hommes |journal=Population |year=1979 |volume=34 |issue=1 |pages=13–25 |doi=10.2307/1531855 |jstor=1531855 |s2cid=143406315 |url=https://www.jstor.org/stable/1531855 |access-date=11 February 2022}}</ref> it took 200 years for European population figures to recover.<ref>{{cite journal |last=Jay |first=Peter |url=http://www.time.com/time/world/article/0,8599,2050585,00.html |title=A Distant Mirror |journal=TIME Europe |date=17 July 2000 |volume=156 |issue=3 |access-date=9 August 2014 |url-status=dead |archive-url = https://web.archive.org/web/20080725005418/http://www.time.com/time/europe/magazine/2000/0717/peter.html |archive-date=25 July 2008}}</ref> The population of China decreased from 123 million in 1200 to 65 million in 1393,<ref>{{cite book |author=Horst R. Thieme |date=2003 |url=https://books.google.com/books?id=cHcjnkrMweYC&pg=PA285 |title=Mathematics in population biology |page=285 |publisher=Princeton University Press |isbn=978-0-691-09291-1}}</ref> presumably from a combination of [[Mongol Empire|Mongol]] invasions, famine, and plague.<ref>{{cite book |author=Graziella Caselli |author2=Gillaume Wunsch |author3=Jacques Vallin |name-list-style=amp |date=2005 |url=https://books.google.com/books?id=nmgNXoiAiU4C&pg=RA2-PA34 |title=Demography: Analysis and Synthesis, Four Volume Set: A Treatise in Population |page=34 |publisher=Academic Press |isbn=978-0-12-765660-1}}</ref> |
|||
Starting in AD 2, the [[Han dynasty]] of [[ancient China]] kept consistent family registers to properly assess the poll taxes and labor service duties of each household.<ref name="nishijima 1986 pp595-96">Nishijima, Sadao (1986), "The economic and social history of Former Han", in Twitchett, Denis; Loewe, Michael, ''Cambridge History of China: Volume I: the Ch'in and Han Empires, 221 B.C. – A.D. 220'', Cambridge: Cambridge University Press, pp 595–96.</ref> In that year, the population of [[Western Han]] was recorded as 57,671,400 individuals in 12,366,470 households, decreasing to 47,566,772 individuals in 9,348,227 households by AD 146, towards the [[end of the Han dynasty]].<ref name="nishijima 1986 pp595-96"/> From 200 to 400, the world population fell from an estimated 257 million to 206 million, with China suffering the greatest loss.<ref name="Essai sur l'évolution du nombre des hommes"/> At the founding of the [[Ming dynasty]] in 1368, China's population was reported to be close to 60 million; toward the end of the dynasty in 1644, it may have approached 150 million.<ref>{{cite web |url=http://afe.easia.columbia.edu/special/china_1750_demographic.htm |title=Qing China's Internal Crisis: Land Shortage, Famine, Rural Poverty |year=2009 |publisher=[[Columbia University]]: Asia for Educators|access-date= 9 July 2013|archive-url= https://web.archive.org/web/20110708082757/http://afe.easia.columbia.edu/special/china_1750_demographic.htm|archive-date= 8 July 2011|url-status= live}}</ref> England's population reached an estimated 5.6 million in 1650, up from an estimated 2.6 million in 1500.<ref>{{cite encyclopedia |url=http://www.britannica.com/EBchecked/topic/195896/history-of-Europe/58335/Demographics#ref=ref310375 |title=History of Europe – Demographics |encyclopedia=Encyclopædia Britannica|access-date=9 July 2013|archive-url=https://web.archive.org/web/20130723052625/http://www.britannica.com/EBchecked/topic/195896/history-of-Europe/58335/Demographics#ref=ref310375|archive-date=23 July 2013|url-status=live}}</ref> New crops that were brought to Asia and Europe from the Americas by Portuguese and Spanish colonists in the 16th century are believed to have contributed to population growth.<ref>{{cite web |url=http://afe.easia.columbia.edu/china/geog/population.htm |title=China's Population: Readings and Maps |publisher=Columbia University: East Asian Curriculum Project|access-date= 18 December 2012|archive-url= https://web.archive.org/web/20110719173803/http://afe.easia.columbia.edu/china/geog/population.htm|archive-date= 19 July 2011|url-status= live}}</ref><ref>{{cite web |url=http://www.learnnc.org/lp/editions/nchist-twoworlds/1866 |title=The Columbian Exchange |publisher=[[University of North Carolina]]|access-date= 18 December 2012|url-status=dead|archive-url= http://archive.wikiwix.com/cache/20110726194333/http://www.learnnc.org/lp/editions/nchist-twoworlds/1866|archive-date= 26 July 2011}}</ref><ref>{{Cite book |title=Vindaloo: the Portuguese and the chilli pepper. Curry: A Tale of Cooks and Conquerors. |last=Collingham |first=Lizzie |publisher=Oxford: Oxford University Press. |year=2006 |isbn=978-0-19-988381-3 |pages=47–73}}</ref> Since their introduction to Africa by Portuguese traders in the 16th century,<ref>{{cite web |url=http://researchnews.osu.edu/archive/suprtubr.htm |title=Super-Sized Cassava Plants May Help Fight Hunger in Africa |publisher=[[Ohio State University]] |date=24 May 2006|access-date= 9 July 2013|url-status=dead|archive-url= https://web.archive.org/web/20131208143623/http://researchnews.osu.edu/archive/suprtubr.htm|archive-date= 8 December 2013}}</ref> maize and [[cassava]] have similarly replaced traditional African crops as the most important [[staple food]] crops grown on the continent.<ref>{{cite book |url=https://archive.org/details/albertschweitzer00jame |url-access=registration |title=Albert Schweitzer: a biography |publisher=Syracuse University Press |first=James |last=Brabazon |date=2000 |page=[https://archive.org/details/albertschweitzer00jame/page/242 242] |isbn=978-0-8156-0675-8}}</ref> |
|||
The [[Pre-Columbian era|pre-Columbian]] population of the Americas is uncertain; historian David Henige called it "the most unanswerable question in the world."<ref>{{Cite web |url=http://www.usna.edu/Users/history/kolp/HH345/PRE1492.HTM |title=U.S. News & World Report: How many people were here before Columbus? Pick a number |date=18 August 1997|archive-url=https://web.archive.org/web/20080305224956/http://www.usna.edu/Users/history/kolp/HH345/PRE1492.HTM|access-date=9 August 2019|archive-date=5 March 2008}}</ref> By the end of the 20th century, scholarly consensus favored an estimate of roughly 55 million people, but numbers from various sources have ranged from 10 million to 100 million.<ref>{{cite journal |title=Microchronology and Demographic Evidence Relating to the Size of Pre-Columbian North American Indian Populations |journal=[[Science (journal)|Science]] |date=16 June 1995 |doi=10.1126/science.268.5217.1601 |pmid=17754613 |volume=268 |issue=5217 |pages=1601–1604 |last1=Snow |first1=D. R |bibcode=1995Sci...268.1601S |s2cid=8512954}}</ref> Encounters between European explorers and populations in the rest of the world often introduced local [[List of epidemics|epidemics]] of extraordinary virulence.<ref>{{cite book |author=Arthur C. Aufderheide |author2=Conrado Rodríguez-Martín |author3=Odin Langsjoen|name-list-style=amp |date=1998 |url=https://archive.org/details/cambridgeencyclo0000aufd |url-access=registration |title=The Cambridge encyclopedia of human paleopathology |publisher=Cambridge University Press |page=[https://archive.org/details/cambridgeencyclo0000aufd/page/205 205] |isbn=978-0-521-55203-5}}</ref> According to the most extreme scholarly claims, as many as 90% of the [[Population history of indigenous peoples of the Americas|Native American population]] of the [[New World]] died of [[Old World]] diseases such as [[smallpox]], [[measles]], and [[influenza]].<ref>{{cite web |url=https://www.pbs.org/gunsgermssteel/variables/smallpox.html |title=The Story Of... Smallpox – and other Deadly Eurasian Germs |publisher=Public Broadcasting Service |year=2005|access-date=24 April 2013|archive-url=https://web.archive.org/web/20180129120446/http://www.pbs.org/gunsgermssteel/variables/smallpox.html|archive-date=29 January 2018|url-status=live}}</ref> Over the centuries, the Europeans had developed high degrees of immunity to these diseases, while the indigenous peoples had no such immunity.<ref>{{Cite book |last=Austin Alchon |first=Suzanne |title=A pest in the land: new world epidemics in a global perspective |url=https://books.google.com/books?id=YiHHnV08ebkC&pg=PA31 |publisher=University of New Mexico Press |date=2003 |page=31 |isbn=978-0-8263-2871-7 | access-date = 15 November 2015 | archive-url = https://web.archive.org/web/20160518062224/https://books.google.com/books?id=YiHHnV08ebkC&pg=PA31&dq | archive-date = 18 May 2016 | url-status = live}}</ref> |
|||
===Modern history=== |
|||
[[File:2006megacities.svg|thumb|upright=1.6|right|Map showing urban areas with at least one million inhabitants in 2006. Only 3% of the world's population lived in urban areas in 1800; this proportion had risen to 47% by 2000, and reached 50.5% by 2010.<ref>{{cite web |url=http://www.indexmundi.com/world/demographics_profile.html |title=World Demographics Profile 2012 |publisher=Index Mundi|access-date=22 May 2012|archive-url=https://web.archive.org/web/20120607034921/http://www.indexmundi.com/world/demographics_profile.html|archive-date=7 June 2012|url-status=live}}</ref> By 2050, the proportion may reach 70%.<ref>{{cite web |url=http://www.fastcodesign.com/1669244/by-2050-70-of-the-worlds-population-will-be-urban-is-that-a-good-thing |title=By 2050, 70% of the world's population will be urban. Is that a good thing? |publisher=Fast Co. Design |year=2012|access-date=1 May 2012|archive-url=https://web.archive.org/web/20120512121735/http://www.fastcodesign.com/1669244/by-2050-70-of-the-worlds-population-will-be-urban-is-that-a-good-thing|archive-date=12 May 2012|url-status=live}}</ref>]] |
|||
During the European [[British Agricultural Revolution|Agricultural]] and [[Industrial Revolution]]s, the [[life expectancy]] of children increased dramatically.<ref>{{citation |url=http://home.vicnet.net.au/~ozideas/poprus.htm |title=Population crises and cycles in history – A review by Claire Russell and W.M.S. Russell |publisher=Vicnet.net.au|access-date=26 March 2015|url-status=dead|archive-url=https://web.archive.org/web/20110405081151/http://home.vicnet.net.au/~ozideas/poprus.htm|archive-date=5 April 2011}}</ref> The percentage of the children born in London who [[infant mortality|died before the age of five]] decreased from 74.5% in 1730–1749 to 31.8% in 1810–1829.<ref name=Buer>{{cite book |first=Mabel C. |last=Buer |title=Health, Wealth and Population in the Early Days of the Industrial Revolution |url=https://archive.org/details/b29977368 |location=London |publisher=George Routledge & Sons |date=1926 |page=[https://archive.org/details/b29977368/page/30 30] |isbn=978-0-415-38218-2}}</ref><ref>{{cite web |url=https://www.bbc.co.uk/history/british/victorians/foundling_01.shtml |title=The Foundling Hospital |publisher=BBC History |date=5 October 2012|access-date=22 April 2013|archive-url=https://web.archive.org/web/20130617072755/http://www.bbc.co.uk/history/british/victorians/foundling_01.shtml|archive-date=17 June 2013|url-status=live}}</ref> Between 1700 and 1900, Europe's population increased from about 100 million to over 400 million.<ref>{{cite encyclopedia |url=http://www.britannica.com/EBchecked/topic/387301/modernization/12022/Population-change |title=Modernization – Population Change |encyclopedia=Encyclopædia Britannica|access-date=6 February 2013|archive-url=https://web.archive.org/web/20090406074344/http://www.britannica.com/EBchecked/topic/387301/modernization/12022/Population-change|archive-date=6 April 2009|url-status=live}}</ref> Altogether, the areas populated by people of European descent comprised 36% of the world's population in 1900.<ref>{{cite book |author=Graziella Caselli |author2=Gillaume Wunsch |author3=Jacques Vallin|name-list-style=amp |date=2005 |url=https://books.google.com/books?id=nmgNXoiAiU4C&pg=RA2-PA42 |title=Demography: Analysis and Synthesis, Four Volume Set: A Treatise in Population |page=42 |publisher=Academic Press |isbn=978-0-12-765660-1}}</ref> |
|||
Population growth in the Western world became more rapid after the introduction of [[vaccination]] and other improvements in medicine and [[sanitation]].<ref>{{cite web |url=https://www.bbc.co.uk/history/british/victorians/victorian_medicine_01.shtml |title=Victorian Medicine – From Fluke to Theory |publisher=BBC History |date=1 February 2002|access-date=17 February 2013|archive-url=https://web.archive.org/web/20130305103509/http://www.bbc.co.uk/history/british/victorians/victorian_medicine_01.shtml|archive-date=5 March 2013|url-status=live}}</ref> Improved material conditions led to the population of Britain increasing from 10 million to 40 million in the 19th century.<ref>{{cite web |url=https://www.independent.co.uk/news/uk/home-news/a-portrait-of-britain-in-2031-395231.html |title=A portrait of Britain in 2031 |work=The Independent |date=24 October 2007|access-date=17 February 2013|archive-url=https://web.archive.org/web/20171209044150/https://www.independent.co.uk/news/uk/home-news/a-portrait-of-britain-in-2031-395231.html|archive-date=9 December 2017|url-status=live}}</ref> The population of the United Kingdom reached 60 million in 2006.<ref>{{cite news |url=http://news.bbc.co.uk/1/hi/uk/5281360.stm |title=UK population breaks through 60m |work=BBC News |date=24 August 2006|access-date=14 April 2012|archive-url=https://web.archive.org/web/20090208232413/http://news.bbc.co.uk/1/hi/uk/5281360.stm|archive-date=8 February 2009|url-status=live}}</ref> The United States saw its population grow from around 5.3 million in 1800 to 106 million in 1920, exceeding 307 million in 2010.<ref>{{cite web |url=http://geography.about.com/od/obtainpopulationdata/a/uspop.htm |title=US population through history |publisher=About.com|access-date=14 April 2012|archive-url=https://web.archive.org/web/20120113011006/http://geography.about.com/od/obtainpopulationdata/a/uspop.htm|archive-date=13 January 2012|url-status=live}}</ref> |
|||
The first half of the 20th century in [[Russian Empire|Imperial Russia]] and the [[Soviet Union]] was marked by a succession of major wars, [[famine]]s and other disasters which caused large-scale population losses (approximately 60 million excess deaths).<ref>{{cite book |author=Jay Winter, Emmanuel Sivan |title=War and Remembrance in the Twentieth Century |url=https://books.google.com/books?id=ZK2A5x7E8IkC&pg=PA64 |date=2000 |publisher=Cambridge University Press |isbn=978-0521794367 |page=64| access-date=20 July 2015| archive-url=https://web.archive.org/web/20150904015129/https://books.google.com/books?id=ZK2A5x7E8IkC&pg=PA64| archive-date=4 September 2015| url-status=live}}</ref><ref>{{cite book |author=Mark Harrison |date=2002 |url=https://books.google.com/books?id=yJcD7_Q_rQ8C&pg=PA167 |title=Accounting for War: Soviet Production, Employment, and the Defence Burden, 1940–1945 |page=167 |publisher=Cambridge University Press |isbn=978-0-521-89424-1}}</ref> After the collapse of the Soviet Union, Russia's population declined significantly – from 150 million in 1991 to 143 million in 2012<ref>{{cite news |url=https://www.telegraph.co.uk/news/worldnews/vladimir-putin/9078672/Vladimir-Putin-vows-to-reverse-Russian-population-decline.html |title=Vladimir Putin vows to reverse Russian population decline |work=[[The Daily Telegraph]] |date=13 February 2012|access-date=13 April 2012|archive-url=https://web.archive.org/web/20120424133957/http://www.telegraph.co.uk/news/worldnews/vladimir-putin/9078672/Vladimir-Putin-vows-to-reverse-Russian-population-decline.html|archive-date=24 April 2012|url-status=live}}</ref> – but by 2013 this decline appeared to have halted.<ref>{{cite web |url=http://www.rferl.org/content/russia-demography-health-birthrate-deaths/24998304.html |title=Russia's Population Decline Said To Have 'Stopped' |publisher=Radio Free Europe/Radio Liberty |date=27 May 2013|access-date=15 June 2013}}</ref> |
|||
Many countries in the [[developing world]] have experienced extremely rapid population growth since the early 20th century, due to economic development and improvements in public health. China's population rose from approximately 430 million in 1850 to 580 million in 1953,<ref>{{Cite journal |title=China's demographic evolution 1850–1953 reconsidered |journal=The China Quarterly |issue=75 |year=1978 |jstor=652987 |pages=639–646 |last1=Schran |first1=Peter |volume=75 |doi=10.1017/S0305741000042594 |s2cid=154294204}}</ref> and now stands at over 1.3 billion. The population of the [[Indian subcontinent]], which was about 125 million in 1750, increased to 389 million in 1941;<ref>{{cite web |url=http://www.petersoninstitute.org/publications/chapters_preview/98/1iie2806.pdf |title=Reintegrating India with the World Economy |publisher=Peterson Institute for International Economics |year=2003|access-date=8 November 2012|archive-url=https://web.archive.org/web/20120304085740/http://www.petersoninstitute.org/publications/chapters_preview/98/1iie2806.pdf|archive-date=4 March 2012|url-status=live}}</ref> today, India, Pakistan and Bangladesh are collectively home to about {{Formatnum: {{#expr: ({{Formatnum: <!-- INDIA: --> 1,266,883,598 |R}} + {{Formatnum: <!-- PAKISTAN: --> 201,995,540 |R}} + {{Formatnum: <!-- BANGLADESH: --> 156,186,882 |R}}) / 1e9 round 2}}}} billion people.<ref>{{cite web |url=https://www.cia.gov/library/publications/the-world-factbook/rankorder/2119rank.html#in |title=The World Factbook – Central Intelligence Agency |website=cia.gov|access-date=8 January 2017|archive-url=https://web.archive.org/web/20110927165947/https://www.cia.gov/library/publications/the-world-factbook/rankorder/2119rank.html#in|archive-date=27 September 2011|url-status=dead}}</ref> [[Java]], an island in [[Indonesia]], had about 5 million inhabitants in 1815; it had a population of over 139 million in 2020.<ref>{{cite encyclopedia |url=https://www.britannica.com/place/Java-island-Indonesia |title=Java (island, Indonesia) |encyclopedia=Encyclopædia Britannica|access-date=16 November 2022|archive-url=https://web.archive.org/web/20221110131115/https://www.britannica.com/place/Java-island-Indonesia|archive-date=10 November 2022|url-status=live}}</ref> In just one hundred years, the population of Brazil decupled (x10), from about 17 million in 1900, or about 1% of the world population in that year, to about 176 million in 2000, or almost 3% of the global population in the very early 21st century. Mexico's population grew from 13.6 million in 1900 to about 112 million in 2010.<ref>{{cite web |author=Jorge Durand |url=http://www.migrationinformation.org/Feature/display.cfm?ID=203 |title=From Traitors to Heroes: 100 Years of Mexican Migration Policies |publisher=[[University of Guadalajara]] |date=March 2004|access-date=16 July 2013|archive-url=https://web.archive.org/web/20110505074111/http://www.migrationinformation.org/Feature/display.cfm?ID=203|archive-date=5 May 2011|url-status=live}}</ref><ref>{{cite web |url=http://www.hist.umn.edu/~rmccaa/ipums-global/mexico_ipums_dublin_workshop.pdf |title=Population and Housing Census: Mexico 2010 |publisher=[[University of Minnesota]] |date=3 March 2011|access-date=16 July 2013|archive-url=https://web.archive.org/web/20131103195505/http://www.hist.umn.edu/~rmccaa/ipums-global/mexico_ipums_dublin_workshop.pdf|archive-date=3 November 2013|url-status=live}}</ref> Between the 1920s and 2000s, Kenya's population grew from 2.9 million to 37 million.<ref>{{cite news |first=Gunnar |last=Heinsohn|author-link=Gunnar Heinsohn |url=https://www.nytimes.com/2008/01/17/opinion/17iht-edheinsohn.1.9292632.html |title=Kenya's Violence: Exploding population |newspaper=The New York Times |date=7 January 2008|access-date=7 July 2013|archive-url=https://web.archive.org/web/20140715084143/http://www.nytimes.com/2008/01/17/opinion/17iht-edheinsohn.1.9292632.html|archive-date=15 July 2014|url-status=live}}</ref> |
|||
===Milestones by the billions=== |
|||
{{main|World population milestones}} |
|||
{| class="wikitable" style="text-align:center; float:right; clear:right; margin-left:8px; margin-right:0;" |
|||
|+ World population milestones in billions<ref name=":6">{{Cite web |last=Nations |first=United |title=World population to reach 8 billion on 15 November 2022 |url=https://www.un.org/en/desa/world-population-reach-8-billion-15-november-2022 |access-date=14 November 2022 |publisher=United Nations |language=en}}</ref> (Worldometers estimates) |
|||
|- |
|||
! scope="row" | Population |
|||
! scope="col" | 1 |
|||
! scope="col" | 2 |
|||
! scope="col" | 3 |
|||
! scope="col" | 4 |
|||
! scope="col" | 5 |
|||
! scope="col" | 6 |
|||
! scope="col" | 7 |
|||
! scope="col" | 8 |
|||
! scope="col" | 9 |
|||
! scope="col" | 10 |
|||
|- |
|||
! scope="row" | Year |
|||
| 1804 || 1927 || 1960 || 1974 || 1987 || 1999 || 2011 || 2022 || ''2037'' || ''2057'' |
|||
|- |
|||
! scope="row" | Years elapsed |
|||
| 200,000+ || 123 || 33 || 14 || 13 || 12 || 12 || 11 || ''15'' || ''20'' |
|||
|} |
|||
The UN estimated that the world population reached one billion for the first time in 1804. It was another 123 years before it reached two billion in 1927, but it took only 33 years to reach three billion in 1960.<ref>{{cite web |url=https://www.un.org/esa/population/publications/sixbillion/sixbilpart1.pdf |title=The World at Six Billion: Introduction |publisher=United Nations |year=1999 |access-date=14 July 2013 |url-status=dead |archive-url=https://web.archive.org/web/20160205063346/http://www.un.org/esa/population/publications/sixbillion/sixbilpart1.pdf |archive-date=5 February 2016}}</ref> Thereafter, it took 14 years for the global population to reach four billion in 1974, 13 years to reach five billion in 1987, 12 years to reach six billion in 1999 and, according to the United States Census Bureau, 13 years to reach seven billion in March 2012.<ref name=USCBcite>{{cite web |url=https://www.census.gov/population/popclockworld.html |title=U.S. Census Bureau – World POPClock Projection |date=July 2013 |access-date=18 February 2018 |archive-url=https://web.archive.org/web/20111118011415/http://www.census.gov/population/popclockworld.html |archive-date=18 November 2011 |url-status=live}} The number on this page is automatically updated daily.</ref> The United Nations, however, estimated that the world population reached seven billion in October 2011.<ref name="UN7bn">{{cite news |url=https://www.bbc.co.uk/news/world-15459643 |title=Population seven billion: UN sets out challenges |date=26 October 2011 |work=BBC News|access-date=27 October 2011|archive-url=https://web.archive.org/web/20111026202531/http://www.bbc.co.uk/news/world-15459643|archive-date=26 October 2011|url-status=live}}</ref><ref name=Guardian7>{{cite news |url=https://www.theguardian.com/world/2011/oct/31/seven-billionth-baby-born-philippines?intcmp=122 |title=World's 'seven billionth baby' is born |date=31 October 2011 |work=The Guardian|access-date=31 October 2011 |location=London |first=Jasmine |last=Coleman|archive-url=https://web.archive.org/web/20130930143837/http://www.theguardian.com/world/2011/oct/31/seven-billionth-baby-born-philippines?intcmp=122|archive-date=30 September 2013|url-status=live}}</ref><ref name=UPI7bn>{{cite web |url=http://www.upi.com/Top_News/US/2011/10/31/7-billion-people-is-a-serious-challenge/UPI-73301320046200/ |title=7 billion people is a 'serious challenge |work=United Press International |date=31 October 2011|access-date=9 November 2011|archive-url=https://web.archive.org/web/20111103213419/http://www.upi.com/Top_News/US/2011/10/31/7-billion-people-is-a-serious-challenge/UPI-73301320046200/|archive-date=3 November 2011|url-status=live}}</ref> |
|||
According to the UN, the global population reached eight billion in November 2022,<ref name="auto">{{Cite web |title=World set to reach 8 billion people on 15 November 2022 |url=https://www.unfpa.org/press/world-set-reach-8-billion-people-15-november-2022 |access-date=8 October 2022 |website=United Nations Population Fund |language=en}}</ref> but because the growth rate is slowing, it will take another 15 years to reach around 9 billion by 2037 and 20 years to reach 10 billion by 2057.<ref name=":7">{{Cite web |year=2019 |title=World Population Prospects 2019, Total Population – Both Sexes file, Medium Variant tab |url=https://population.un.org/wpp/Download/Standard/Population/ |website=United Nations Department of Economic and Social Affairs}}</ref> Alternative scenarios for 2050 range from a low of 7.4 billion to a high of more than 10.6 billion.<!--Please don't cull these references. Readers need to see the resources for themselves, to see such things as prediction variation, stability, and source. If you are of a mind to do something, just elaborate on the text and spread the references out. It's what I'd do if I had the time, but this exercise has used up as much time as I can spare--><ref name=WorldPopProspects>*{{Cite book |chapter=Ch. 5: Population Size and Composition |title=World Population Prospects, the 2000 Revision |volume=III |publisher=United Nations Population Division |page=171 |chapter-url=https://www.un.org/esa/population/publications/wpp2000/chapter5.pdf |access-date=3 July 2010}} |
|||
* {{Cite book |date=2002 |chapter=Executive Summary |title=World Population Prospects: The 2002 Revision Volume III: Analytical Report |chapter-url=https://www.un.org/esa/population/publications/wpp2002/English.pdf|access-date=3 July 2010}} |
|||
* {{Cite web |year=2004 |pages=3, 14 |title=World Population to 2300 |place=New York |publisher=United Nations Department of Economic and Social Affairs: Population Division |url=https://www.un.org/esa/population/publications/longrange2/WorldPop2300final.pdf |access-date=3 July 2010 |archive-url=https://web.archive.org/web/20180919132323/http://www.un.org/esa/population/publications/longrange2/WorldPop2300final.pdf |archive-date=19 September 2018 |url-status=live}} |
|||
* {{Cite web |date=June 2010 |title=World Population: 1950–2050 |publisher=[[United States Census Bureau]] |url=https://www.census.gov/ipc/www/idb/worldpopgraph.php |access-date=3 July 2010 |archive-url=https://web.archive.org/web/20131005014003/http://www.census.gov/ipc/www/idb/worldpopgraph.php |archive-date=5 October 2013 |url-status=live}} |
|||
* {{Cite web |year=2009 |title=2009 World Population Data Sheet |place=Washington, DC |publisher=[[Population Reference Bureau]] |url=http://www.prb.org/pdf09/09wpds_eng.pdf |access-date=3 July 2010 |archive-url=https://web.archive.org/web/20100422034436/http://www.prb.org/pdf09/09wpds_eng.pdf |archive-date=22 April 2010 |url-status=live}}</ref> Projected figures vary depending on underlying statistical assumptions and the variables used in projection calculations, especially the [[fertility]] and [[Mortality rate|mortality]] variables. Long-range predictions to 2150 range from a population decline to 3.2 billion in the "low scenario", to "high scenarios" of 24.8 billion.<ref name=WorldPopProspects/> One extreme scenario predicted a massive increase to 256 billion by 2150, assuming the global fertility rate remained at its 1995 level of 3.04 children per woman; however, by 2010 the global fertility rate had declined to 2.52.<ref name=LongRangeProjections2003KeyFindings/><ref name=Fertility2010>{{cite web |url=http://esa.un.org/unpd/wpp/Excel-Data/DB01_Period_Indicators/WPP2010_DB1_F01_TOTAL_FERTILITY.XLS |title=Total fertility estimates, 1950–2010 |publisher=UN Population Division |date=April 2011|access-date=14 June 2012|archive-url=https://web.archive.org/web/20120607191518/http://esa.un.org/unpd/wpp/Excel-Data/DB01_Period_Indicators/WPP2010_DB1_F01_TOTAL_FERTILITY.XLS|archive-date=7 June 2012|url-status=dead}}</ref> |
|||
There is no estimation for the exact day or month the world's population surpassed one or two billion. The points at which it reached three and four billion were not officially noted, but the International Database of the United States Census Bureau placed them in July 1959 and April 1974 respectively. The United Nations did determine, and commemorate, the "Day of 5 Billion" on 11 July 1987, and the "Day of 6 Billion" on 12 October 1999. The Population Division of the United Nations declared the "[[Day of Seven Billion]]" to be 31 October 2011.<ref>{{cite web |url=http://esa.un.org/unpd/wpp/Other-Information/faq.htm |title=World Population Prospects, the 2008 Revision – Frequently Asked Questions |publisher=Population Division of the Department of Economic and Social Affairs of the United Nations Secretariat |date=10 November 2010|access-date=26 March 2015|archive-url=https://web.archive.org/web/20150224215308/http://esa.un.org/unpd/wpp/Other-Information/faq.htm|archive-date=24 February 2015|url-status=dead}}</ref> The United Nations marked the birth of the [[Vinice Mabansag|eight billionth person]] on 15 November 2022.<ref>[https://news.un.org/en/story/2022/07/1122272 "World population to reach 8 billion this year, as growth rate slows"] {{Webarchive|url=https://web.archive.org/web/20220716035213/https://news.un.org/en/story/2022/07/1122272 |date=16 July 2022 }}, UN News, 11 July 2022.</ref><ref name="auto"/> |
|||
==Global demographics== |
|||
{{main|Demographics of the world}} |
|||
[[File:Expectancy of life.svg|thumb|400px| |
|||
{{legend-col |
|||
|{{legend|#0000CD|>80}} |
|||
|{{legend|#4169E1|77.5–80}} |
|||
|{{legend|#00BFFF|75–77.5}} |
|||
|{{legend|#3CB371|72.5–75}} |
|||
|{{legend|#32CD32|70–72.5}} |
|||
|{{legend|#ADFF2F|67.5–70}} |
|||
|{{legend|#FFFF00|65–67.5}} |
|||
|{{legend|#FFD700|60–65}} |
|||
|{{legend|#FF8C00|55–60}} |
|||
|{{legend|#FF4500|50–55}} |
|||
}} 2015 map showing average life expectancy by country in years. In 2015, the World Health Organization estimated the average global life expectancy as 71.4 years.<ref name="WHOStats2016">{{cite web |title=World Health Statistics 2016: Monitoring health for the SDGs Annex B: tables of health statistics by country, WHO region and globally |publisher=World Health Organization |url=https://www.who.int/gho/publications/world_health_statistics/2016/EN_WHS2016_AnnexB.pdf |page=110 |year=2016 |access-date=3 August 2018 |archive-url=https://web.archive.org/web/20180517033759/http://www.who.int/gho/publications/world_health_statistics/2016/EN_WHS2016_AnnexB.pdf |archive-date=17 May 2018 |url-status=live}}</ref>]] |
|||
As of 2020, the global [[Human sex ratio|sex ratio]] is approximately 1.01 males to 1 female.<ref name=cia-factbook>{{cite web|url=https://www.cia.gov/the-world-factbook/countries/world/#people-and-society|title=World - The World Factbook|date=20 February 2024|website=CIA World Fact Book|publisher=Central Intelligence Agency|access-date=24 February 2024}}</ref> Approximately 24.7% of the global population is aged under 15, while 65.2% is aged 15–64 and 10.1% is aged 65 or over.<ref name=cia-factbook/> The median age of the world's population is estimated to be 31 years in 2020,<ref name=":0" /> and is expected to rise to 37.9 years by 2050.<ref>{{cite web |url=https://www.un.org/esa/population/cpd/cpd2012/Agenda%20item%204/UN%20system%20statements/ECA_Item4.pdf |title=General debate on national experience in population matters: adolescents and youth |author=Janneh, Abdoulie |publisher=United Nations Economic Commission for Africa |date=April 2012|access-date=19 February 2014|archive-url=https://web.archive.org/web/20131110111359/http://www.un.org/esa/population/cpd/cpd2012/Agenda%20item%204/UN%20system%20statements/ECA_Item4.pdf|archive-date=10 November 2013|url-status=live}}</ref> |
|||
According to the [[World Health Organization]], the global average [[List of countries by life expectancy|life expectancy]] is 73.3 years as of 2020, with women living an average of 75.9 years and men approximately 70.8 years.<ref>{{Cite web |url=https://apps.who.int/gho/data/node.main.688 |title=WHO, 2020 Life Expectancy |publisher=World Health Organization|access-date=27 July 2022}}</ref> In 2010, the global [[fertility rate]] was estimated at 2.44 children per woman.<ref>{{Cite web |title=Children per woman |url=https://ourworldindata.org/grapher/children-per-woman-UN|access-date=1 November 2021 |website=Our World in Data}}</ref> In June 2012, British researchers calculated the total weight of Earth's human population as approximately {{convert|287|e6t|e9lb|abbr=off}}, with the average person weighing around {{convert|62|kg|lb}}.<ref>{{cite news |url=https://www.bbc.co.uk/news/health-18462985 |title=Global weight gain more damaging than rising numbers |publisher=BBC |date=18 June 2012|access-date=12 February 2013|archive-url=https://web.archive.org/web/20130204103058/http://www.bbc.co.uk/news/health-18462985|archive-date=4 February 2013|url-status=live}}</ref> |
|||
The [[International Monetary Fund|IMF]] estimated nominal 2021 [[gross world product]] at US$94.94 trillion, giving an annual global per capita figure of around US$12,290.<ref>{{Cite web |title=World Economic Outlook (October 2021) |url=https://www.imf.org/external/datamapper/datasets/WEO|access-date=1 November 2021 |website=Imf.org}}</ref> Around 9.3% of the world population live in [[extreme poverty]], subsisting on less than US$1.9 per day;<ref>{{Cite web |title=Poverty headcount ratio at $1.90 a day (2011 PPP) (% of population) {{!}} Data|url=https://data.worldbank.org/indicator/SI.POV.DDAY|access-date=1 November 2021|publisher=World Bank}}</ref> around 8.9% are [[Malnutrition|malnourished]].<ref>[http://www.fao.org/docrep/016/i3027e/i3027e02.pdf Food and Agriculture Organization of the United Nations, ''The State of Food Insecurity in the World''] {{Webarchive|url=https://web.archive.org/web/20140611064129/http://www.fao.org/docrep/016/i3027e/i3027e02.pdf |date=11 June 2014 }}. WorldHunger.org. 2012. Retrieved 26 April 2012.</ref> 87% of the world's over-15s are considered [[literacy rate|literate]].<ref>{{Cite web |date=September 2021 |title=Literacy Rate, Adult Total (% of people ages 15 and above) |url=https://data.worldbank.org/indicator/SE.ADT.LITR.ZS |website=The World Bank}}</ref> As of January 2024, there were about 5 billion global Internet users, constituting 66% of the world population.<ref>{{Cite web |date= 31 January 2024 |title= Number of internet and social media users worldwide as of January 2024 |url=https://www.statista.com/statistics/617136/digital-population-worldwide/ |website=Statista |url-status=live |archive-url=https://web.archive.org/web/20240212221806/https://www.statista.com/statistics/617136/digital-population-worldwide/ |archive-date= 12 February 2024 }}</ref> |
|||
The [[Han Chinese]] are the world's largest single ethnic group, constituting over 19% of the global population in 2011.<ref>{{cite web |url-status=live |url=https://blogs.wsj.com/chinarealtime/2011/03/04/worlds-most-typical-person-han-chinese-man/ |title=World's Most Typical Person: Han Chinese Man |archive-url=https://web.archive.org/web/20190606203315/https://blogs.wsj.com/chinarealtime/2011/03/04/worlds-most-typical-person-han-chinese-man/ |archive-date=6 June 2019 |website=Wall Street Journal |date=4 March 2011 |access-date=18 November 2011 |first1=Josh |last1=Chin }}</ref> The world's most-spoken languages{{Efn|This is by ''total speakers'', not first-language or [[languages by number of native speakers|native speakers]].}} are English (1.132B), [[Mandarin Chinese]] (1.117B), [[Hindi]] (615M), Spanish (534M) and French (280M). More than three billion people speak an Indo-European language, which is the largest language family by number of speakers. Standard Arabic is a language with no native speakers, but the total number of speakers is estimated at 274 million people.<ref>{{Cite web |last=Ghosh |first=Iman |date=15 February 2020 |title=Ranked: The 100 Most Spoken Languages Around the World |url=https://www.visualcapitalist.com/100-most-spoken-languages/|access-date=1 November 2021 |website=Visual Capitalist |language=en-US}}</ref> |
|||
The largest religious categories in the world as of 2020 are estimated as follows: Christianity (31%), [[Islam]] (25%), [[Irreligion|Unaffiliated]] (16%) and [[Hinduism]] (15%).<ref name="Pew">{{Cite web |date=2 April 2015 |title=Religious Composition by Country, 2010–2050 |url=https://www.pewforum.org/2015/04/02/religious-projection-table/2010/number/all/ |publisher=Pew Research Center}}</ref> |
|||
==Population by region== |
|||
{{further|Demographics of the world}} |
|||
Six of the Earth's seven [[continent]]s are permanently inhabited on a large scale. Asia is the most populous continent, with its 4.64 billion inhabitants accounting for 60% of the world population. The world's two most populated countries, India and China, together constitute about 36% of the world's population. |
|||
Africa is the second most populated continent, with around 1.34 billion people, or 17% of the world's population. |
|||
Europe's 747 million people make up 10% of the world's population as of 2020, |
|||
while the [[Latin American]] and [[Caribbean]] regions are home to around 653 million (8%). Northern America, primarily consisting of the United States and Canada, has a population of around 368 million (5%), |
|||
and Oceania, the least populated region, has about 42 million inhabitants (0.5%).<ref>{{cite web |url=https://www.worldometers.info/world-population/population-by-region/ |title=Regions in the world by population (2020) |access-date=5 October 2020}}</ref> [[Antarctica]] only has a very small, fluctuating population of about 1200 people based mainly in polar [[Research stations in Antarctica|science stations]].<ref name=AntarcticCIA/> |
|||
[[File:Population pyramid of the world in continental groupings 2023.svg|thumb|300x300px|[[Population pyramid]] of the world in continental groupings in 2023. The left and right sides of the vertical axis represent different sexes (male and female).]] |
|||
{| class="wikitable" |
|||
|- |
|||
|+Current world population and latest projection according the UN. Population in (millions) and percent of the global population in that year.<ref>{{cite book|url=https://www.un.org/development/desa/pd/sites/www.un.org.development.desa.pd/files/wpp2022_summary_of_results.pdf|title=World Population Prospects 2022. Summary of Results|location=New York|author=United Nations. Department of Economic and Social Affairs}}</ref> |
|||
! Region !! 2022 (percent)!!2030 (percent)!!2050 (percent) |
|||
|- |
|||
| [[Sub-Saharan Africa]] || '''1,152''' (14.51%)||'''1,401''' (16.46%)||'''2,094''' (21.62%) |
|||
|- |
|||
| Northern Africa and Western Asia || '''549''' (6.91%)|| '''617''' (7.25%)|| '''771''' (7.96%) |
|||
|- |
|||
| Central Asia and [[United Nations geoscheme for Asia#Southern Asia|Southern Asia]] || '''2,075''' (26.13%)||'''2,248''' (26.41%)||'''2,575''' (26.58%) |
|||
|- |
|||
| Eastern Asia and Southeastern Asia || '''2,342''' (29.49%)||'''2,372''' (27.87%)||'''2,317''' (23.92%) |
|||
|- |
|||
| Europe and [[North America|Northern America]] || '''1,120''' (14.10%)||'''1,129''' (13.26%)||'''1,125''' (11.61%) |
|||
|- |
|||
| Latin America and [[the Caribbean]] ||'''658''' (8.29%)||'''695''' (8.17%)||'''749''' (7.73%) |
|||
|- |
|||
| Australia and New Zealand || '''31''' (0.39%)||'''34''' (0.40%)||'''38''' (0.39%) |
|||
|- |
|||
| Oceania || '''14''' (0.18%)||'''15''' (0.18%)||'''20''' (0.21%) |
|||
|- |
|||
| World || '''7,942'''||'''8,512'''||'''9,687''' |
|||
|} |
|||
{{Graph:Chart |
|||
| innerRadius=27 |
|||
| legend=Population in millions |
|||
| showValues= fontsize:7, offset:7 |
|||
| type=pie |
|||
| height=55 |
|||
| width=55 |
|||
| x=Asia, Africa, Europe, Latin America, Northern America, Oceania |
|||
| y1=4641,1340,747,653,368,42 |
|||
}} |
|||
{| class="wikitable sortable" |
|||
|+ Population by region (2020 estimates) |
|||
|- |
|||
! scope="col" | Region |
|||
! scope="col" | Density<br /><small>(inhabitants/km<sup>2</sup>)</small> |
|||
! scope="col" | Population<br /><small>(millions)</small> |
|||
! scope="col" | Most populous country |
|||
! scope="col" | Most populous city (metropolitan area) |
|||
|- |
|||
| Asia |
|||
| style="text-align:right" | {{#expr:4641054775/44579000 round 1}} |
|||
| style="text-align:right" | 4,641 |
|||
| data-sort-value="14118e5" |1,439,090,595 {{ndash}} '''{{flag|India}}''' |
|||
| data-sort-value="135e5" |13,515,000 {{ndash}} {{flagicon|Japan}} [[Tokyo|Tokyo Metropolis]]<br/>(37,400,000 {{ndash}} {{flagicon|Japan}} [[Greater Tokyo Area]]) |
|||
|- |
|||
| Africa |
|||
| style="text-align:right" | {{#expr:1340598147/30221532 round 1}} |
|||
| style="text-align:right" | 1,340 |
|||
| data-sort-value="211e6" | {{0|0,}}211,401,000 {{ndash}} {{Flag|Nigeria}} |
|||
| data-sort-value="95e5" | {{0}}9,500,000 {{ndash}} {{flagicon|Egypt}} [[Cairo]]<br/>(20,076,000 {{ndash}} {{flagicon|Egypt}} [[Greater Cairo]]) |
|||
|- |
|||
| Europe |
|||
| style="text-align:right" | {{#expr:747636026/10180000 round 1}} |
|||
| style="text-align:right" | 747 |
|||
| data-sort-value="146e6" | {{0|0,}}146,171,000 {{ndash}} {{Flag|Russia}}, approx. [[European Russia|110 million in Europe]] |
|||
| data-sort-value="132e5" |13,200,000 {{ndash}} {{flagicon|Russia}} Moscow<br/>(20,004,000 {{ndash}} {{flagicon|Russia}} [[Moscow metropolitan area]]) |
|||
|- |
|||
| Latin America |
|||
| style="text-align:right" | {{#expr:430759766/17840000 round 1}} |
|||
| style="text-align:right" | 653 |
|||
| data-sort-value="214e6" | {{0|0,}}214,103,000 {{ndash}} {{Flag|Brazil}} |
|||
| data-sort-value="122e5" | 12,252,000 {{ndash}} {{flagicon|Brazil}} [[São Paulo|São Paulo City]]<br/>(21,650,000 {{ndash}} {{flagicon|Brazil}} [[Greater São Paulo|São Paulo Metro Area]]) |
|||
|- |
|||
| Northern America<ref group="note">Excludes Mexico, Central America and the [[Caribbean]], which are included here under Latin America.</ref> |
|||
| style="text-align:right" | {{#expr: 368869647/24709000 round 1}} |
|||
| style="text-align:right" | 368 |
|||
| data-sort-value="332e6" | {{0|0,}}332,909,000 {{ndash}} {{Flag|United States}} |
|||
| data-sort-value="88e5" | {{0}}8,804,000 {{ndash}} {{flagicon|United States}} New York City<br/>(23,582,649 {{ndash}} {{flagicon|United States}} [[New York metropolitan area]]<ref name=CityPopulation.de>{{cite web |url=http://citypopulation.de/en/usa/combmetro/ |title=USA: Combined Metropolitan Areas |publisher=CityPopulation.de |date=August 2021|access-date=19 November 2021}}</ref>) |
|||
|- |
|||
| Oceania |
|||
| style="text-align:right" | {{#expr:42677813/8525989 round 1}} |
|||
| style="text-align:right" | 42 |
|||
| data-sort-value="25e6" | {{0|0,0}}25,917,000 {{ndash}} {{Flag|Australia}} |
|||
| data-sort-value="54e5" | {{0}}5,367,000 {{ndash}} {{flagicon|Australia}} [[Sydney]] |
|||
|- |
|||
| [[Antarctica]] |
|||
| style="text-align:right" | ~0 |
|||
| style="text-align:right" | 0.004<ref name="AntarcticCIA">{{cite web |url=https://www.cia.gov/the-world-factbook/countries/antarctica/ |title=Antarctica |work=The World Factbook |date=19 June 2014|access-date=18 March 2015}}</ref> |
|||
| data-sort-value="0" | N/A<ref group="note">The [[Antarctic Treaty System]] limits the nature of national claims in Antarctica. Of the [[territorial claims in Antarctica]], the [[Ross Dependency]] has the largest population.</ref> |
|||
| data-sort-value="1258" | {{0|00,00}}1,258 {{ndash}} {{Flagicon|Antarctica|variant=Bartram}} [[McMurdo Station]] |
|||
|} |
|||
==Largest populations by country== |
|||
{{Further|List of countries and dependencies by population}} |
|||
[[File:Global population cartogram.png|thumb|300px|[[Cartogram]] showing the distribution of the world population, each square represents half a million people.]] |
|||
[[File:People's -Km² for all countries (and us states, uk kingdoms).png|thumb|upright=2.05|right|300px| [[w:Choropleth|choropleth]] showing [[w:Population density|Population density]] (people per square kilometre) by country or U.S. state in 2019]] |
|||
[[File:Top 5 Country Population Graph 1901 to 2021.svg|thumb|right|300px|1901 to 2021 population graph of the five countries with the highest current populations]] |
|||
===Ten most populous countries=== |
|||
{{sticky header}}{{table alignment}}{{static row numbers}}{{sort under}} |
|||
{| class="sortable wikitable sticky-header static-row-numbers sort-under col1left col5left" {{right}} |
|||
|- |
|||
! Country / [[Dependent territory|Dependency]] |
|||
! Population |
|||
! % of<br>world |
|||
! Date |
|||
! {{nowrap|Source (official or from}}<br>the United Nations) |
|||
|- |
|||
| {{flag+link|Demographics of|IND}} |
|||
| <section begin=IND/>{{n+p|1425775850|{{worldpop}}|sigfig=3|disp=table|nonscinote=y}} |
|||
| {{dts|14 April 2023|format=dmy|abbr=on}}<section end="IND"/> |
|||
| UN projection<ref name="20230414france24" /> |
|||
|- |
|||
| {{flag+link|Demographics of|CHN}} |
|||
| <section begin=CHN/>{{n+p|1409670000|{{worldpop}}|sigfig=3|disp=table|nonscinote=y}} |
|||
| {{dts|17 January 2024|format=dmy|abbr=on}}<section end="CHN"/> |
|||
| National annual estimate<ref>{{cite web |url=https://www.stats.gov.cn/sj/zxfb/202401/t20240117_1946624.html |title=2023年国民经济回升向好 高质量发展扎实推进 |trans-title=Economy continues to recover in 2023, high-quality development progress steadily |language=Chinese |website=[[National Bureau of Statistics of China]]|access-date=17 January 2024}}</ref> |
|||
|- |
|||
| {{flag+link|Demographics of the|USA}} |
|||
| <section begin=USA/>{{data United States|poptoday 1}}<section end=USA/><!-- Do not replace this with a manual calculation. Template:Data United States, like other data templates do for other countries, is used to automatically calculate today's population based on national sources. If this country's population is not accurate, please update the data template, not this article. Do not remove this template without providing justification in the edit summary. Failure to provide justification will result in the removal being reverted. --> |
|||
| National population clock<ref>{{cite web |url=https://www.census.gov/popclock/ |title=Population Clock |website=Census.gov|access-date=18 April 2020|archive-url=https://web.archive.org/web/20151117025617/http://www.census.gov/popclock/|archive-date=17 November 2015|url-status=live}}</ref> |
|||
|- |
|||
| {{flag+link|Demographics of|INA}} || <section begin=INA/>{{n+p|278696200| |
|||
{{worldpop}}|sigfig=3|disp=table|nonscinote=y}} |
|||
| {{dts|1 July 2023|format=dmy|abbr=on}}<section end="IDN"/> |
|||
| National annual estimate<ref>{{cite web |url=https://www.bps.go.id/indicator/12/1975/1/mid-year-population.html |publisher=[[Statistics Indonesia|Badan Pusat Statistik – Indonesia]] |title=Mid Year Population (Thousand People)|access-date=22 November 2023}}</ref> |
|||
|- |
|||
| {{flag+link|Demographics of|PAK}} |
|||
| <section begin=PAK/>{{n+p|229488994|{{worldpop}}|sigfig=3|disp=table|nonscinote=y}} |
|||
| {{dts|1 July 2022|format=dmy|abbr=on}}<section end="PAK"/> |
|||
| UN projection<ref name="unpop">{{cite web |url=https://population.un.org/wpp/Download/Files/1_Indicators%20(Standard)/EXCEL_FILES/1_Population/WPP2019_POP_F01_1_TOTAL_POPULATION_BOTH_SEXES.xlsx |title=World Population Prospects 2019 |publisher=United Nations}}</ref> |
|||
|- |
|||
| {{flag+link|Demographics of|NGA}} |
|||
| <section begin=NGA/>{{n+p|216746934|{{worldpop}}|sigfig=3|disp=table|nonscinote=y}} |
|||
| {{dts|1 July 2022|format=dmy|abbr=on}}<section end="NGA"/> |
|||
| UN projection<ref name="unpop"/> |
|||
|- |
|||
| {{flag+link|Demographics of|BRA}} |
|||
| <section begin=BRA/>{{data Brazil|poptoday 1}}<section end=BRA/><!-- Do not replace this with a manual calculation. Template:Data Brazil, like other data templates do for other countries, is used to automatically calculate today's population based on national sources. If this country's population is not accurate, please update the data template, not this article. Do not remove this template without providing justification in the edit summary. Failure to provide justification will result in the removal being reverted. --> |
|||
| National population clock<ref>{{cite web |url=https://www.ibge.gov.br/apps/populacao/projecao/index.html |title=IBGE | Projeção da população |website=Ibge.gov.br|access-date=22 November 2019|archive-url=https://web.archive.org/web/20200204104203/https://www.ibge.gov.br/apps/populacao/projecao/index.html|archive-date=4 February 2020|url-status=live}}</ref> |
|||
|- |
|||
| {{flag+link|Demographics of|BGD}} |
|||
| <section begin=BGD/>{{n+p|168220000|{{worldpop}}|sigfig=3|disp=table|nonscinote=y}} |
|||
| {{dts|1 July 2020|format=dmy|abbr=on}}<section end=BGD/> |
|||
| Annual Population Estimate<ref name="BangladeshPopulation">{{cite web |title=Monthly Statidtical Bulletin – Bangladesh |url=http://bbs.portal.gov.bd/sites/default/files/files/bbs.portal.gov.bd/page/c885f359_ef11_4abe_95f6_021865be3401/2022-05-12-10-42-55414488d843db66462b5410cb439c22.pdf |website=2022-05-12-10-42-55414488d843db66462b5410cb439c22.pdf |publisher=Bangladesh Bureau of Statistics |access-date=8 June 2022 |archive-url=https://web.archive.org/web/20220608195522/http://bbs.portal.gov.bd/sites/default/files/files/bbs.portal.gov.bd/page/c885f359_ef11_4abe_95f6_021865be3401/2022-05-12-10-42-55414488d843db66462b5410cb439c22.pdf |archive-date=8 June 2022 |date=February 2022 |url-status=live}}</ref> |
|||
|- |
|||
| {{flag+link|Demographics of|RUS}} |
|||
| <section begin=RUS/>{{n+p|147190000|{{worldpop}}|sigfig=3|disp=table|nonscinote=y}} |
|||
| {{dts|1 October 2021|format=dmy|abbr=on}}<section end="RUS"/> |
|||
| 2021 preliminary census results<ref>{{Cite web |last=Times |first=The Moscow |date=30 May 2022 |title=Russia Reports 147M Population in 2021 |url=https://www.themoscowtimes.com/2022/05/30/russia-reports-147m-population-in-2021-a77834 |access-date=2 June 2022 |website=Moscow Times |language=en}}</ref> |
|||
|- |
|||
| {{flag+link|Demographics of|MEX}} |
|||
| <section begin=MEX/>{{n+p|128,271,248|{{worldpop}}|sigfig=3|disp=table|nonscinote=y}} |
|||
| {{dts|31 March 2022|format=dmy|abbr=on}}<section end="MEX"/> |
|||
| |
|||
|} |
|||
Approximately 4.6 billion people live in these ten countries, representing around 57% of the world's population as of July 2023. |
|||
The UN estimates that by 2023 India will have overtaken China in having the largest population.<ref>{{Cite news |title=World Population Day: India will overtake China in 2023, says the UN |url=https://www.bbc.com/news/science-environment-62126413 |access-date=14 April 2023 |website=bbc.com|date=11 July 2022 }}</ref><ref name=20230414france24>{{Cite web |title=Spotlight on family planning as India surpasses China as world's most populous country |url=https://www.france24.com/en/asia-pacific/20230414-spotlight-on-family-planning-as-india-surpasses-china-as-world-s-most-populous-country |access-date=14 April 2023 |website=france24.com|date=14 April 2023 }}</ref> |
|||
{| class="wikitable" style="font-size:90%" |
|||
|+ World population {{nobold|(millions, UN estimates)<ref name=WPP2015total/>}} |
|||
|- |
|||
! scope="col" | # |
|||
! scope="col" | Most populous countries |
|||
! scope="col" | 2000 |
|||
! scope="col" | 2015 |
|||
! scope="col" | 2030{{efn-ua|name=note-2030|2030 {{=}} Medium variant.}} |
|||
! rowspan="12"| |
|||
{{Graph:Chart |
|||
| width=75 |
|||
| height=300 |
|||
| xGrid= |
|||
| yGrid= |
|||
| yAxisFormat=,d |
|||
| xType=string |
|||
| legend=Country |
|||
| type=line |
|||
| x=2000,2015,2030 |
|||
| y1Title=China |
|||
| y1=1270,1376,1416 |
|||
| y2Title=India |
|||
| y2=1053,1311,1528 |
|||
| y3Title=United States |
|||
| y3=283,322,356 |
|||
| y4Title=Indonesia |
|||
| y4=212,258,295 |
|||
| y5Title=Pakistan |
|||
| y5=136,208,245 |
|||
| y6Title=Brazil |
|||
| y6=176,206,228 |
|||
| y7Title=Nigeria |
|||
| y7=123,182,263 |
|||
| y8Title=Bangladesh |
|||
| y8=131,161,186 |
|||
| y9Title=Russia |
|||
| y9=146,145,149 |
|||
| y10Title=Mexico |
|||
| y10=103,127,148 |
|||
}} |
|||
|- |
|||
| style="text-align:right;"| 1 || style="text-align:left;"| {{flagicon|China}} [[Demographics of China|China]]{{efn-ua|name=china-note|China excludes Hong Kong and [[Macau]].}} || style="text-align:right;"| 1,270 || style="text-align:right;"| 1,376 || style="text-align:right;"| 1,416 |
|||
|- |
|||
| style="text-align:right;"| 2 || style="text-align:left;"| {{flagicon|India}} [[Demographics of India|India]] || style="text-align:right;"| 1,053 || style="text-align:right;"| 1,311 || style="text-align:right;"| 1,528 |
|||
|- |
|||
| style="text-align:right;"| 3 || style="text-align:left;"| {{flagicon|United States}} [[Demographics of the United States|United States]] || style="text-align:right;"| 283 || style="text-align:right;"| 322 || style="text-align:right;"| 356 |
|||
|- |
|||
| style="text-align:right;"| 4 || style="text-align:left;"| {{flagicon|Indonesia}} [[Demographics of Indonesia|Indonesia]] || style="text-align:right;"| 212 || style="text-align:right;"| 258 || style="text-align:right;"| 295 |
|||
|- |
|||
| style="text-align:right;"| 5 || style="text-align:left;"| {{flagicon|Pakistan}} [[Demographics of Pakistan|Pakistan]] || style="text-align:right;"| 136 || style="text-align:right;"| 208|| style="text-align:right;"| 245 |
|||
|- |
|||
| style="text-align:right;"| 6 || style="text-align:left;"| {{flagicon|Brazil}} [[Demographics of Brazil|Brazil]] || style="text-align:right;"| 176|| style="text-align:right;"| 206|| style="text-align:right;"| 228 |
|||
|- |
|||
| style="text-align:right;"| 7 || style="text-align:left;"| {{flagicon|Nigeria}} [[Demographics of Nigeria|Nigeria]] || style="text-align:right;"| 123 || style="text-align:right;"| 182 || style="text-align:right;"| 263 |
|||
|- |
|||
| style="text-align:right;"| 8 || style="text-align:left;"| {{flagicon|Bangladesh}} [[Demographics of Bangladesh|Bangladesh]] || style="text-align:right;"| 131 || style="text-align:right;"| 161 || style="text-align:right;"| 186 |
|||
|- |
|||
| style="text-align:right;"| 9 || style="text-align:left;"| {{flagicon|Russia}} [[Demographics of Russia|Russia]] || style="text-align:right;"| 146 || style="text-align:right;"| 146 || style="text-align:right;"| 149 |
|||
|- |
|||
| style="text-align:right;"| 10 || style="text-align:left;"| {{flagicon|Mexico}} [[Demographics of Mexico|Mexico]] || style="text-align:right;"| 103 || style="text-align:right;"| 127 || style="text-align:right;"| 148 |
|||
|- |
|||
| || style="text-align:left;"| '''World total''' || style="text-align:right;"| 6,127 || style="text-align:right;"| 7,349 || style="text-align:right;"| 8,501 |
|||
|- |
|||
| colspan="6" style="text-align:left;"| Notes: |
|||
{{notelist-ua}} |
|||
|} |
|||
{{clear}} |
|||
===Most densely populated countries=== |
|||
{{Further|List of countries and dependencies by population density}} |
|||
The tables below list the world's most densely populated countries, both in absolute terms and in comparison to their total populations, as of November 2022. All areas and populations are from ''[[The World Factbook]]'', unless otherwise noted. |
|||
[[File:Population Density, v4.11, 2020 (48009093621).jpg|thumb|upright=1.5|right|Population density (people per km<sup>2</sup>) map of the world in 2020. Red areas denote regions of highest population density]] |
|||
{| class="wikitable sortable" style="text-align:right" |
|||
|+ 10 most densely populated countries <small>(with population above 5 million)</small><ref name=":10">{{Cite web |title=Countries – The World Factbook |url=https://www.cia.gov/the-world-factbook/countries/ |access-date=15 November 2022 |website=cia.gov |language=en}}</ref> |
|||
|- |
|||
! scope="col" | Rank |
|||
! scope="col" | Country |
|||
! scope="col" | Population |
|||
! scope="col" | Area<br /><small>(km<sup>2</sup>)</small> |
|||
! scope="col" | Density<br /><small>(pop/km<sup>2</sup>)</small> |
|||
|- |
|||
| 1 || align=left|{{Flag|Singapore}} || 5,921,231 || 719 || 8,235 |
|||
|- |
|||
| 2 || align=left|{{Flag|Bangladesh}} || 165,650,475 || 148,460 || 1,116 |
|||
|- |
|||
| 3 || align=left| |
|||
{{Flag|Palestine}}<ref group="note">Has [[International recognition of the State of Palestine|limited international recognition]] as a country. Area for the purposes of these calculations is that claimed, not controlled, by the State of Palestine.</ref><ref>{{Cite web |title=UNData app |url=http://data.un.org/en/iso/ps.html |access-date=15 November 2022 |publisher=United Nations}}</ref> |
|||
| 5,223,000 ||6,025 || 867 |
|||
|- |
|||
| 4 || align="left" |{{Flag|Taiwan}}<ref group="note">Has [[Foreign relations of Taiwan|limited international recognition]] as a country. Area for the purposes of these calculations is that controlled, not claimed, by Taiwan.</ref> || 23,580,712 || 35,980 || 655 |
|||
|- |
|||
| 5 || align="left" |{{Flag|South Korea}} || 51,844,834 || 99,720 || 520 |
|||
|- |
|||
| 6 || align="left" |{{Flag|Lebanon}} || 5,296,814 || 10,400 || 509 |
|||
|- |
|||
| 7 || align="left" |{{Flag|Rwanda}} || 13,173,730 || 26,338 || 500 |
|||
|- |
|||
| 8 || align="left" |{{Flag|Burundi}} || 12,696,478 || 27,830 || 456 |
|||
|- |
|||
| 9 || align="left" |{{Flag|Israel}} || 9,402,617 || 21,937 || 429 |
|||
|- |
|||
| 10 || align="left" |{{Flag|India}} || 1,389,637,446 || 3,287,263 || 423 |
|||
|} |
|||
{| class="wikitable sortable" style="text-align:right" |
|||
|+ Countries ranking highly in both total population <small>(more than 20 million people)</small> and population density <small>(more than 250 people per square kilometer)</small><ref name=":10" /> |
|||
|- |
|||
! scope="col" | Rank |
|||
! scope="col" | Country |
|||
! scope="col" | Population |
|||
! scope="col" | Area<br /><small>(km<sup>2</sup>)</small> |
|||
! scope="col" | Density<br /><small>(pop/km<sup>2</sup>)</small> |
|||
! scope="col" | Population <br> trend{{Citation needed|date=November 2022}} |
|||
|- |
|||
| 1 || align=left|{{Flag|India}} |
|||
|1,389,637,446 |
|||
|3,287,263|| 423 |
|||
|Growing |
|||
|- |
|||
| 2 || align=left|{{Flag|Pakistan}} |
|||
|242,923,845 |
|||
|796,095|| 305 |
|||
|Rapidly growing |
|||
|- |
|||
| 3 || align=left|{{Flag|Bangladesh}} |
|||
|165,650,475 |
|||
|148,460|| 1,116 |
|||
|Growing |
|||
|- |
|||
| 4 || align=left|{{Flag|Japan}} || 124,214,766 || 377,915 || 329 || Declining<ref name=BigDecline/> |
|||
|- |
|||
| 5 || align=left|{{Flag|Philippines}} |
|||
|114,597,229 |
|||
|300,000|| 382 |
|||
|Growing |
|||
|- |
|||
| 6 || align=left|{{Flag|Vietnam}} || 103,808,319 || 331,210 || 313 || Growing |
|||
|- |
|||
| 7 || align=left|{{Flag|United Kingdom}} || 67,791,400 || 243,610 || 278 || Growing |
|||
|- |
|||
| 8 || align=left|{{Flag|South Korea}} || 51,844,834 || 99,720 || 520 || Steady |
|||
|- |
|||
| 9 || align=left|{{Flag|Taiwan}} || 23,580,712 ||35,980 || 655 || Steady |
|||
|- |
|||
| 10 || align=left|{{Flag|Sri Lanka}} || 23,187,516 || 65,610 || 353 || Growing |
|||
|} |
|||
==Fluctuation== |
|||
{{Main|Population growth|Projections of population growth|Population dynamics}} |
|||
[[File:World population (UN).svg|thumb|right|upright=1.35|Estimates of population evolution in different [[continent]]s between 1950 and 2050, according to the United Nations. The vertical axis is [[Logarithmic scale|logarithmic]] and is in millions of people.]] |
|||
Population size fluctuates at differing rates in differing regions. Nonetheless, population growth has been the long-standing trend on all inhabited continents, as well as in most individual states. During the 20th century, the global population saw its greatest increase in known history, rising from about 1.6 billion in 1900 to over 6 billion in 2000<ref>{{Cite web |year=2022 |title=World Population Clock (under World Pop Milestone section) |url=https://www.worldometers.info/world-population/ |website=Worldometer}}</ref> as the whole world entered the early phases of what has come to be called the "[[demographic transition]]". Some of the key factors contributing to this increase included the lessening of the [[mortality rate]] in many countries by improved sanitation and [[History of medicine#Modern medicine|medical advances]], and a massive increase in agricultural productivity attributed to the [[Green Revolution]].<ref>{{cite news |url=http://news.bbc.co.uk/2/hi/in_depth/6496585.stm |title=The limits of a Green Revolution? |work=BBC News |date=29 March 2007 |access-date=1 August 2010 |archive-url=https://web.archive.org/web/20110728055441/http://news.bbc.co.uk/2/hi/in_depth/6496585.stm |archive-date=28 July 2011 |url-status=live}}</ref><ref>{{cite web |url=http://www.energybulletin.net/19525.html|archive-url=https://web.archive.org/web/20080422210924/http://www.energybulletin.net/19525.html |archive-date=22 April 2008 |title=The Real Green Revolution |publisher=Energybulletin.net |access-date=1 August 2010}}</ref> By 2000, there were approximately [[#Past population|ten times as many people]] on Earth as there had been in 1700. |
|||
However, this rapid growth did not last. During the period 2000–2005, the United Nations estimates that the world's population was growing at an annual rate of 1.3% (equivalent to around 80 million people), down from a peak of 2.1% during the period 1965–1970.<ref name=":8"/> Globally, although the population [[population growth|growth rate]] has been steadily declining from its peak in 1968,<ref>{{Cite journal |last=Roser |first=Max |date=18 June 2019 |title=Two centuries of rapid global population growth will come to an end |url=https://ourworldindata.org/world-population-growth-past-future |journal=Our World in Data}}</ref> growth [[Projections of population growth#Growth regions|still remains high]] in [[Sub-Saharan Africa]].<ref>{{cite book |author=Ron Nielsen |date=2006 |title=The Little Green Handbook |publisher=Picador |place=New York |isbn=978-0-312-42581-4 |url=https://archive.org/details/littlegreenhandb00ronn}}</ref> |
|||
[[File:Total Fertility Rate Map by Country.svg|thumb|right|upright=1.35|Map of countries by fertility rate (2020), according to the [[Population Reference Bureau]] |
|||
]] |
|||
[[File:World population counter, Eureka, Halifax, West Yorkshire (27th August 2022) 001.jpg|thumb|right|A world population clock in August 2022 at [[Eureka! (museum)|Eureka!]] in [[Halifax, West Yorkshire|Halifax]], West Yorkshire]] |
|||
In fact, during the 2010s, Japan and some countries in Europe began to [[population decline|reduce in population]], due to [[sub-replacement fertility]] rates.<ref name=BigDecline>{{cite news |url=https://www.telegraph.co.uk/news/worldnews/asia/japan/9999591/Japans-population-suffers-biggest-fall-in-history.html |title=Japan's population suffers biggest fall in history |work=The Daily Telegraph |date=17 April 2013|access-date=22 July 2013 |location=London |first=Danielle |last=Demetriou|archive-url=https://web.archive.org/web/20130521221053/http://www.telegraph.co.uk/news/worldnews/asia/japan/9999591/Japans-population-suffers-biggest-fall-in-history.html|archive-date=21 May 2013|url-status=live}}</ref> |
|||
In 2019, the United Nations reported that the rate of population growth continues to decline due to the ongoing global demographic transition. If this trend continues, the rate of growth may diminish to zero by 2100, concurrent with a world population plateau of 10.9 billion.<ref name=":8" /><ref name=":7" /> However, this is only one of many estimates published by the UN; in 2009, UN population projections for 2050 ranged between around 8 billion and 10.5 billion.<ref>{{cite web |url=http://esa.un.org/unpp/ |title=UN population estimates and projections, database query, August 2009 |publisher=United Nations |date=11 March 2009 |access-date=1 August 2010 |archive-url=https://web.archive.org/web/20100819143228/http://esa.un.org/UNPP/ |archive-date=19 August 2010 |url-status=dead}}</ref> An alternative scenario is given by the statistician Jorgen Randers, who argues that traditional projections insufficiently take into account the downward impact of global urbanization on fertility. Randers' "most likely scenario" reveals a peak in the world population in the early 2040s at about 8.1 billion people, followed by decline.<ref>{{cite book |author=Randers, Jorgen |date=2012 |title=2052: A Global Forecast for the Next Forty Years |publisher=Vermont: Chelsea Green Publishing |page=62}}</ref> Adrian Raftery, a [[University of Washington]] professor of statistics and of sociology, states that "there's a 70 percent probability the world population will not stabilize this century. Population, which had sort of fallen off the world's agenda, remains a very important issue."<ref>[http://www.washington.edu/news/2014/09/18/world-population-to-keep-growing-this-century-hit-11-billion-by-2100/ World population to keep growing this century, hit 11 billion by 2100] {{Webarchive|url=https://web.archive.org/web/20161204155734/http://www.washington.edu/news/2014/09/18/world-population-to-keep-growing-this-century-hit-11-billion-by-2100/ |date=4 December 2016 }}. UWToday. 18 September 2014</ref> |
|||
<gallery> |
|||
File:Population curve.svg|Estimated world population figures, [[10th millennium BC|10,000 BC]] – AD 2000 |
|||
File:World population growth (lin-log scale).png|Estimated world population figures, 10,000 BC – AD 2000 (in [[logarithmic scale|log y scale]]) |
|||
File:World population history.svg|World population figures, 1950–2017 |
|||
</gallery> |
|||
=== Annual population growth === |
|||
{{GraphChart |
|||
| width = 250 |
|||
| height = 150 |
|||
| yAxisTitle=Population (billion) |
|||
| yAxisMin=0 |
|||
| yGrid= |
|||
| xGrid= |
|||
| type =line |
|||
| x = 1951,1952,1953,1954,1955,1956,1957,1958,1959,1960,1961,1962,1963,1964,1965,1966,1967,1968,1969,1970,1971,1972,1973,1974,1975,1976,1977,1978,1979,1980,1981,1982,1983,1984,1985,1986,1987,1988,1989,1990,1991,1992,1993,1994,1995,1996,1997,1998,1999,2000,2001,2002, 2003, 2004, 2005, 2006, 2007, 2008, 2009, 2010, 2011, 2012, 2013, 2014, 2015, 2016, 2017, 2018, 2019, 2020, 2021 |
|||
| y1= 2.58, 2.63, 2.68, 2.72, 2.77, 2.82, 2.87, 2.93, 2.98, 3.03, 3.09, 3.15, 3.21, 3.27, 3.34, 3.41, 3.48, 3.55, 3.63, 3.7, 3.78, 3.85, 3.93, 4, 4.08, 4.15, 4.23, 4.3, 4.38, 4.46, 4.54, 4.62, 4.7, 4.78, 4.87, 4.96, 5.05, 5.15, 5.24, 5.33, 5.41, 5.5, 5.58, 5.66, 5.74, 5.82, 5.91, 5.98, 6.06, 6.14, 6.22, 6.3, 6.38, 6.46, 6.54, 6.62, 6.71, 6.79, 6.87, 6.96, 7.04, 7.13, 7.21, 7.3, 7.38, 7.46, 7.55, 7.63, 7.71, 7.8 |
|||
}} |
|||
{{GraphChart |
|||
| width = 250 |
|||
| height = 150 |
|||
| yAxisFormat=% |
|||
| yAxisTitle=Annual growth |
|||
| yAxisMin=0 |
|||
| yGrid= 0,1 |
|||
| xGrid= 10 |
|||
| hAnnotatonsLine= |
|||
| hAnnotatonsLabel= |
|||
| type = line |
|||
| x = 1951,1952,1953,1954,1955,1956,1957,1958,1959,1960,1961,1962,1963,1964,1965,1966,1967,1968,1969,1970,1971,1972,1973,1974,1975,1976,1977,1978,1979,1980,1981,1982,1983,1984,1985,1986,1987,1988,1989,1990,1991,1992,1993,1994,1995,1996,1997,1998,1999,2000,2001,2002, 2003, 2004, 2005, 2006, 2007, 2008, 2009, 2010, 2011, 2012, 2013, 2014, 2015, 2016, 2017, 2018, 2019, 2020 |
|||
| y1= 0.0188,0.0181, 0.0178, 0.0176, 0.0177, 0.0178,0.0180, 0.0182, 0.0184, 0.0186, 0.0187, 0.0189, 0.0192, 0.0196, 0.0200, 0.0205, 0.0208, 0.0209, 0.0209, 0.0206, 0.0204, 0.0201, 0.0198, 0.0194, 0.0189, 0.0184, 0.0180, 0.0177, 0.0176, 0.0177, 0.0177, 0.0177, 0.0178, 0.0180, 0.0182, 0.0184, 0.0185, 0.0184, 0.0179, 0.0171, 0.0163, 0.0156, 0.0150, 0.0146, 0.0143, 0.0140, 0.0138, 0.0135, 0.0133, 0.0131, 0.0129, 0.0127, 0.0126, 0.0125, 0.0125, 0.0125, 0.0124, 0.0124, 0.0123, 0.0122, 0.0121, 0.0120, 0.0119, 0.0117, 0.0116, 0.0114, 0.0112, 0.0110, 0.0108, 0.0105, |
|||
}} |
|||
{| class="wikitable sortable" |
|||
|+Global annual population growth<ref>{{Cite web |title=World Population by Year|url=https://www.worldometers.info/world-population/world-population-by-year/ |website=Worldometers.info|access-date=18 July 2023}}</ref> |
|||
!rowspan=2|Year |
|||
!rowspan=2|Population |
|||
!colspan=2|Yearly growth |
|||
!rowspan=2|Density<br /><small>(pop/km<sup>2</sup>)</small> |
|||
|- |
|||
!% |
|||
!Number |
|||
|- |
|||
!style="text-align: right;" |1951 |
|||
|2,543,130,380 |
|||
|1.75% |
|||
|43,808,223 |
|||
|17 |
|||
|- |
|||
!style="text-align: right;" |1952 |
|||
|2,590,270,899 |
|||
|1.85% |
|||
|47,140,519 |
|||
|17 |
|||
|- |
|||
!style="text-align: right;" |1953 |
|||
|2,640,278,797 |
|||
|1.93% |
|||
|50,007,898 |
|||
|18 |
|||
|- |
|||
!style="text-align: right;" |1954 |
|||
|2,691,979,339 |
|||
|1.96% |
|||
|51,700,542 |
|||
|18 |
|||
|- |
|||
!style="text-align: right;" |1955 |
|||
|2,746,072,141 |
|||
|2.01% |
|||
|54,092,802 |
|||
|18 |
|||
|- |
|||
!style="text-align: right;" |1956 |
|||
|2,801,002,631 |
|||
|2.00% |
|||
|54,930,490 |
|||
|19 |
|||
|- |
|||
!style="text-align: right;" |1957 |
|||
|2,857,866,857 |
|||
|2.03% |
|||
|56,864,226 |
|||
|19 |
|||
|- |
|||
!style="text-align: right;" |1958 |
|||
|2,916,108,097 |
|||
|2.04% |
|||
|58,241,240 |
|||
|20 |
|||
|- |
|||
!style="text-align: right;" |1959 |
|||
|2,970,292,188 |
|||
|1.86% |
|||
|54,184,091 |
|||
|20 |
|||
|- |
|||
!style="text-align: right;" |1960 |
|||
|3,019,233,434 |
|||
|1.65% |
|||
|48,941,246 |
|||
|20 |
|||
|- |
|||
!style="text-align: right;" |1961 |
|||
|3,068,370,609 |
|||
|1.63% |
|||
|49,137,175 |
|||
|21 |
|||
|- |
|||
!style="text-align: right;" |1962 |
|||
|3,126,686,743 |
|||
|1.90% |
|||
|58,316,134 |
|||
|21 |
|||
|- |
|||
!style="text-align: right;" |1963 |
|||
|3,195,779,247 |
|||
|2.21% |
|||
|69,092,504 |
|||
|21 |
|||
|- |
|||
!style="text-align: right;" |1964 |
|||
|3,267,212,338 |
|||
|2.24% |
|||
|71,433,091 |
|||
|22 |
|||
|- |
|||
!style="text-align: right;" |1965 |
|||
|3,337,111,983 |
|||
|2.14% |
|||
|69,899,645 |
|||
|22 |
|||
|- |
|||
!style="text-align: right;" |1966 |
|||
|3,406,417,036 |
|||
|2.08% |
|||
|69,305,053 |
|||
|23 |
|||
|- |
|||
!style="text-align: right;" |1967 |
|||
|3,475,448,166 |
|||
|2.03% |
|||
|69,031,130 |
|||
|23 |
|||
|- |
|||
!style="text-align: right;" |1968 |
|||
|3,546,810,808 |
|||
|2.05% |
|||
|71,362,642 |
|||
|24 |
|||
|- |
|||
!style="text-align: right;" |1969 |
|||
|3,620,655,275 |
|||
|2.08% |
|||
|73,844,467 |
|||
|24 |
|||
|- |
|||
!style="text-align: right;" |1970 |
|||
|3,695,390,336 |
|||
|2.06% |
|||
|74,735,061 |
|||
|25 |
|||
|- |
|||
!style="text-align: right;" |1971 |
|||
|3,770,163,092 |
|||
|2.02% |
|||
|74,772,756 |
|||
|25 |
|||
|- |
|||
!style="text-align: right;" |1972 |
|||
|3,844,800,885 |
|||
|1.98% |
|||
|74,637,793 |
|||
|26 |
|||
|- |
|||
!style="text-align: right;" |1973 |
|||
|3,920,251,504 |
|||
|1.96% |
|||
|75,450,619 |
|||
|26 |
|||
|- |
|||
!style="text-align: right;" |1974 |
|||
|3,995,517,077 |
|||
|1.92% |
|||
|75,265,573 |
|||
|27 |
|||
|- |
|||
!style="text-align: right;" |1975 |
|||
|4,069,437,231 |
|||
|1.85% |
|||
|73,920,154 |
|||
|27 |
|||
|- |
|||
!style="text-align: right;" |1976 |
|||
|4,142,505,882 |
|||
|1.80% |
|||
|73,068,651 |
|||
|28 |
|||
|- |
|||
!style="text-align: right;" |1977 |
|||
|4,215,772,490 |
|||
|1.77% |
|||
|73,266,608 |
|||
|28 |
|||
|- |
|||
!style="text-align: right;" |1978 |
|||
|4,289,657,708 |
|||
|1.75% |
|||
|73,885,218 |
|||
|29 |
|||
|- |
|||
!style="text-align: right;" |1979 |
|||
|4,365,582,871 |
|||
|1.77% |
|||
|75,925,163 |
|||
|29 |
|||
|- |
|||
!style="text-align: right;" |1980 |
|||
|4,444,007,706 |
|||
|1.80% |
|||
|78,424,835 |
|||
|30 |
|||
|- |
|||
!style="text-align: right;" |1981 |
|||
|4,524,627,658 |
|||
|1.81% |
|||
|80,619,952 |
|||
|30 |
|||
|- |
|||
!style="text-align: right;" |1982 |
|||
|4,607,984,871 |
|||
|1.84% |
|||
|83,357,213 |
|||
|31 |
|||
|- |
|||
!style="text-align: right;" |1983 |
|||
|4,691,884,238 |
|||
|1.82% |
|||
|83,899,367 |
|||
|32 |
|||
|- |
|||
!style="text-align: right;" |1984 |
|||
|4,775,836,074 |
|||
|1.79% |
|||
|83,951,836 |
|||
|32 |
|||
|- |
|||
!style="text-align: right;" |1985 |
|||
|4,861,730,613 |
|||
|1.80% |
|||
|85,894,539 |
|||
|33 |
|||
|- |
|||
!style="text-align: right;" |1986 |
|||
|4,950,063,339 |
|||
|1.82% |
|||
|88,332,726 |
|||
|33 |
|||
|- |
|||
!style="text-align: right;" |1987 |
|||
|5,040,984,495 |
|||
|1.84% |
|||
|90,921,156 |
|||
|34 |
|||
|- |
|||
!style="text-align: right;" |1988 |
|||
|5,132,293,974 |
|||
|1.81% |
|||
|91,309,479 |
|||
|34 |
|||
|- |
|||
!style="text-align: right;" |1989 |
|||
|5,223,704,308 |
|||
|1.78% |
|||
|91,410,334 |
|||
|35 |
|||
|- |
|||
!style="text-align: right;" |1990 |
|||
|5,316,175,862 |
|||
|1.77% |
|||
|92,471,554 |
|||
|36 |
|||
|- |
|||
!style="text-align: right;" |1991 |
|||
|5,406,245,867 |
|||
|1.69% |
|||
|90,070,005 |
|||
|36 |
|||
|- |
|||
!style="text-align: right;" |1992 |
|||
|5,492,686,093 |
|||
|1.60% |
|||
|86,440,226 |
|||
|37 |
|||
|- |
|||
!style="text-align: right;" |1993 |
|||
|5,577,433,523 |
|||
|1.54% |
|||
|84,747,430 |
|||
|37 |
|||
|- |
|||
!style="text-align: right;" |1994 |
|||
|5,660,727,993 |
|||
|1.49% |
|||
|83,294,470 |
|||
|38 |
|||
|- |
|||
!style="text-align: right;" |1995 |
|||
|5,743,219,454 |
|||
|1.46% |
|||
|82,491,461 |
|||
|39 |
|||
|- |
|||
!style="text-align: right;" |1996 |
|||
|5,825,145,298 |
|||
|1.43% |
|||
|81,925,844 |
|||
|39 |
|||
|- |
|||
!style="text-align: right;" |1997 |
|||
|5,906,481,261 |
|||
|1.40% |
|||
|81,335,963 |
|||
|40 |
|||
|- |
|||
!style="text-align: right;" |1998 |
|||
|5,987,312,480 |
|||
|1.37% |
|||
|80,831,219 |
|||
|40 |
|||
|- |
|||
!style="text-align: right;" |1999 |
|||
|6,067,758,458 |
|||
|1.34% |
|||
|80,445,978 |
|||
|41 |
|||
|- |
|||
!style="text-align: right;" |2000 |
|||
|6,148,898,975 |
|||
|1.34% |
|||
|81,140,517 |
|||
|41 |
|||
|- |
|||
!style="text-align: right;" |2001 |
|||
|6,230,746,982 |
|||
|1.33% |
|||
|81,848,007 |
|||
|42 |
|||
|- |
|||
!style="text-align: right;" |2002 |
|||
|6,312,407,360 |
|||
|1.31% |
|||
|81,660,378 |
|||
|42 |
|||
|- |
|||
!style="text-align: right;" |2003 |
|||
|6,393,898,365 |
|||
|1.29% |
|||
|81,491,005 |
|||
|43 |
|||
|- |
|||
!style="text-align: right;" |2004 |
|||
|6,475,751,478 |
|||
|1.28% |
|||
|81,853,113 |
|||
|43 |
|||
|- |
|||
!style="text-align: right;" |2005 |
|||
|6,558,176,119 |
|||
|1.27% |
|||
|82,424,641 |
|||
|44 |
|||
|- |
|||
!style="text-align: right;" |2006 |
|||
|6,641,416,218 |
|||
|1.27% |
|||
|83,240,099 |
|||
|45 |
|||
|- |
|||
!style="text-align: right;" |2007 |
|||
|6,725,948,544 |
|||
|1.27% |
|||
|84,532,326 |
|||
|45 |
|||
|- |
|||
!style="text-align: right;" |2008 |
|||
|6,811,597,272 |
|||
|1.27% |
|||
|85,648,728 |
|||
|46 |
|||
|- |
|||
!style="text-align: right;" |2009 |
|||
|6,898,305,908 |
|||
|1.27% |
|||
|86,708,636 |
|||
|46 |
|||
|- |
|||
!style="text-align: right;" |2010 |
|||
|6,985,603,105 |
|||
|1.27% |
|||
|87,297,197 |
|||
|47 |
|||
|- |
|||
!style="text-align: right;" |2011 |
|||
|7,073,125,425 |
|||
|1.25% |
|||
|87,522,320 |
|||
|47 |
|||
|- |
|||
!style="text-align: right;" |2012 |
|||
|7,161,697,921 |
|||
|1.25% |
|||
|88,572,496 |
|||
|48 |
|||
|- |
|||
!style="text-align: right;" |2013 |
|||
|7,250,593,370 |
|||
|1.24% |
|||
|88,895,449 |
|||
|49 |
|||
|- |
|||
!style="text-align: right;" |2014 |
|||
|7,339,013,419 |
|||
|1.22% |
|||
|88,420,049 |
|||
|49 |
|||
|- |
|||
!style="text-align: right;" |2015 |
|||
|7,426,597,537 |
|||
|1.19% |
|||
|87,584,118 |
|||
|50 |
|||
|- |
|||
!style="text-align: right;" |2016 |
|||
|7,513,474,238 |
|||
|1.17% |
|||
|86,876,701 |
|||
|50 |
|||
|- |
|||
!style="text-align: right;" |2017 |
|||
|7,599,822,404 |
|||
|1.15% |
|||
|86,348,166 |
|||
|51 |
|||
|- |
|||
!style="text-align: right;" |2018 |
|||
|7,683,789,828 |
|||
|1.10% |
|||
|83,967,424 |
|||
|52 |
|||
|- |
|||
!style="text-align: right;" |2019 |
|||
|7,764,951,032 |
|||
|1.06% |
|||
|81,161,204 |
|||
|52 |
|||
|- |
|||
!style="text-align: right;" |2020 |
|||
|7,840,952,880 |
|||
|0.98% |
|||
|76,001,848 |
|||
|53 |
|||
|- |
|||
!style="text-align: right;" |2021 |
|||
|7,909,295,151 |
|||
|0.87% |
|||
|68,342,271 |
|||
|53 |
|||
|- |
|||
!style="text-align: right;" |2022 |
|||
|7,975,105,156 |
|||
|0.83% |
|||
|65,810,005 |
|||
|54 |
|||
|- |
|||
!style="text-align: right;" |2023 |
|||
|8,045,311,447 |
|||
|0.88% |
|||
|70,206,291 |
|||
|54 |
|||
|} |
|||
===Population growth by region=== |
|||
{{main|Population growth}} |
|||
{{Further|Total fertility rate|Birth rate}} |
|||
The table below shows historical and predicted regional population figures in millions.<ref name=UN/><ref>{{cite web |url=https://www.un.org/esa/population/publications/sixbillion/sixbillion.htm |title=The World at Six Billion |publisher=United Nations |date=12 October 1999 |access-date=1 August 2010 |archive-url=https://web.archive.org/web/20130709223435/http://www.un.org/esa/population/publications/sixbillion/sixbillion.htm |archive-date=9 July 2013 |url-status=live}}</ref><ref name=autogenerated1>{{cite web |url=http://www.globalchange.umich.edu/globalchange2/current/lectures/human_pop/human_pop.html |title=Population Growth over Human History |publisher=[[University of Michigan]] |date=4 January 2006 |access-date=9 March 2013 |url-status=dead |archive-url=https://web.archive.org/web/20110724101452/http://www.globalchange.umich.edu/globalchange2/current/lectures/human_pop/human_pop.html |archive-date=24 July 2011}}</ref> The availability of historical population figures varies by region. |
|||
{| class="wikitable sortable" style="font-size:97%; text-align:right;" |
{| class="wikitable sortable" style="font-size:97%; text-align:right;" |
||
|+World historical and predicted populations (in millions)<ref name="Vallin">Figures include the former Soviet countries in Europe. {{Cite book |publisher=Academic Press |isbn=978-0-12-765660-1 |last=Caselli |first=Graziella |author2=Gillaume Wunsch |author3=Jacques Vallin |title=Demography: Analysis and Synthesis, Four Volume Set: A Treatise in Population |date=20 December 2005 |page=42}}</ref><ref name="un2004">{{cite web |url=https://www.un.org/esa/population/publications/sixbillion/sixbilpart1.pdf |title=UN report – 2004 data |access-date=1 August 2010 |url-status=dead |archive-url=https://web.archive.org/web/20160205063346/http://www.un.org/esa/population/publications/sixbillion/sixbilpart1.pdf |archive-date=5 February 2016}}</ref><ref>{{Cite news |url=http://esa.un.org/unpd/wpp/Publications/Files/Key_Findings_WPP_2015.pdf |title=World Population Prospects The 2015 Revision|archive-url = https://web.archive.org/web/20140320035709/http://esa.un.org/unpd/wpp/unpp/panel_population.htm|archive-date = 20 March 2014|url-status = dead}}</ref> |
|||
|+World historical and predicted populations (in millions)<ref>[http://www.un.org/esa/population/publications/sixbillion/sixbilpart1.pdf UN report 2004 data]</ref> |
|||
|- |
|- |
||
!Region||1750||1800||1850||1900||1950||1999||2050||2150 |
!Region||1500||1600||1700||1750||1800||1850||1900||1950||1999||2008||2010||2012||2050||2150 |
||
|- |
|- |
||
!World |
!World |
||
|791||978||1,262||1,650||2,521|| |
|585||660||710||791||978||1,262||1,650||2,521||6,008||6,707||6,896||7,052||9,725||9,746 |
||
|- |
|- |
||
!Africa |
!Africa |
||
|106||107||111||133||221|| |
|86||114||106||106||107||111||133||221||783||973||1,022||1,052||2,478||2,308 |
||
|- |
|- |
||
!Asia |
!Asia |
||
|502||635||809||947||1,402||3, |
|282||350||411||502||635||809||947||1,402||3,700||4,054||4,164||4,250||5,267||5,561 |
||
|- |
|- |
||
!Europe |
!Europe |
||
| |
|168||170||178||190||203||276||408||547||675||732||738||740||734||517 |
||
|- |
|- |
||
! |
!Latin America{{r|group=Note|Americas}} |
||
|16||24||38||74||167|| |
|40||20||10||16||24||38||74||167||508||577||590||603||784||912 |
||
|- |
|- |
||
!Northern America |
!Northern America{{r|group=Note|Americas}} |
||
|2||7||26||82||172|| |
|6||3||2||2||7||26||82||172||312||337||345||351||433||398 |
||
|- |
|- |
||
!Oceania |
!Oceania |
||
|2||2||2||6||13||30|| |
|3||3||3||2||2||2||6||13||30||34||37||38||57||51 |
||
|} |
|} |
||
{| class="wikitable sortable" style="font-size:97%; text-align:right;" |
{| class="wikitable sortable" style="font-size:97%; text-align:right;" |
||
|+World historical and predicted populations by percentage distribution |
|+World historical and predicted populations by percentage distribution<ref name="Vallin" /><ref name="un2004"/> |
||
|- |
|- |
||
!Region||1750||1800||1850||1900||1950||1999||2050||2150 |
!Region||1500||1600||1700||1750||1800||1850||1900||1950||1999||2008||2010||2012||2050||2150 |
||
|- |
|||
!World |
|||
|100||100||100||100||100||100||100||100 |
|||
|- |
|- |
||
!Africa |
!Africa |
||
|13.4||10.9||8.8||8.1||8.8|| |
|14.7||17.3||14.9||13.4||10.9||8.8||8.1||8.8||13.0||14.5||14.8||15.2||25.5||23.7 |
||
|- |
|- |
||
!Asia |
!Asia |
||
|63.5||64.9||64.1||57.4||55.6||60. |
|48.2||53.0||57.9||63.5||64.9||64.1||57.4||55.6||61.6||60.4||60.4||60.3||54.2||57.1 |
||
|- |
|- |
||
!Europe |
!Europe |
||
|20.6||20.8||21.9||24.7||21.7|| |
|28.7||25.8||25.1||20.6||20.8||21.9||24.7||21.7||11.2||10.9||10.7||10.5||7.6||5.3 |
||
|- |
|- |
||
! |
!Latin America{{r|group=Note|Americas}} |
||
|2.0||2.5||3.0||4.5||6.6||8.5|| |
|6.8||3.0||1.4||2.0||2.5||3.0||4.5||6.6||8.5||8.6||8.6||8.6||8.1||9.4 |
||
|- |
|- |
||
!Northern America |
!Northern America{{r|group=Note|Americas}} |
||
|0.3||0.7||2.1||5.0||6.8||5. |
|1.0||0.5||0.3||0.3||0.7||2.1||5.0||6.8||5.2||5.0||5.0||5.0||4.5||4.1 |
||
|- |
|- |
||
!Oceania |
!Oceania |
||
|0.3||0.2||0.2||0.4||0.5||0.5||0.5||0.5 |
|0.5||0.5||0.4||0.3||0.2||0.2||0.4||0.5||0.5||0.5||0.5||0.5||0.6||0.5 |
||
|} |
|} |
||
===Past population=== |
|||
{| class="wikitable" style="font-size:97%; text-align:right;" |
|||
| |
{{main|Estimates of historical world population}} |
||
The following table gives estimates, in millions, of population in the past. The data for 1750 to 1900 are from the UN report "The World at Six Billion"<ref>{{cite web |title=The World at Six Billion |url=https://www.un.org/esa/population/publications/sixbillion/sixbillion.htm |publisher=UN Population Division|archive-url=https://web.archive.org/web/20160305042434/http://www.un.org/esa/population/publications/sixbillion/sixbillion.htm |archive-date=5 March 2016 |url-status=live}}, [https://web.archive.org/web/20160101220025/http://www.un.org/esa/population/publications/sixbillion/sixbilpart1.pdf Table 2]</ref> whereas the data from 1950 to 2015 are from a UN data sheet.<ref name=WPP2015total>{{cite web |title=World Population Prospects: The 2015 Revision |url=http://esa.un.org/unpd/wpp/DVD/Files/1_Indicators%20(Standard)/EXCEL_FILES/1_Population/WPP2015_POP_F01_1_TOTAL_POPULATION_BOTH_SEXES.XLS |publisher=UN Population Division|archive-url=https://web.archive.org/web/20151222125602/http://esa.un.org/unpd/wpp/DVD/Files/1_Indicators%20(Standard)/EXCEL_FILES/1_Population/WPP2015_POP_F01_1_TOTAL_POPULATION_BOTH_SEXES.XLS|archive-date=22 December 2015|url-status=dead|access-date=19 January 2016}}. Linked to at [https://web.archive.org/web/20151225073428/http://esa.un.org/unpd/wpp/Download/Standard/Population/ Download Files], where it states that the figures are for 1 July of the given year.</ref> |
|||
{| class="wikitable" style="text-align:right;" |
|||
|- |
|||
! Year |
! Year |
||
! |
! style="width:70px;"| World |
||
! |
! style="width:70px;"| Africa |
||
! |
! style="width:70px;"| Asia |
||
! |
! style="width:70px;"| Europe |
||
! style="width:70px;"| {{Nowrap|Latin America<br />& Carib.{{r|group=Note|Americas}}}} |
|||
! width="70"| [[South America]] * |
|||
! style="width:70px;"| {{Nowrap|North America}}<br />{{r|group=Note|Americas}} |
|||
! width="70"| [[Northern America]]* |
|||
! |
! style="width:70px;"| Oceania |
||
! Notes |
! Notes |
||
|- |
|||
|- style="text-align:right;" |
|||
!style="text-align: right;" |70,000 BC |
!style="text-align: right;" |70,000 BC |
||
| |
| < 0.015 |
||
| |
| |
||
| |
| |
||
| |
| |
||
| |
|||
| |
|||
| |
| |
||
|<ref>Fewer than 15,000 individuals, according to the [[Toba catastrophe theory]], though this theory has been criticized by some scientists. See: {{cite web |url=https://www.bbc.co.uk/news/science-environment-22355515 |title=Toba super-volcano catastrophe idea "dismissed" |work=BBC News |date=30 April 2013|access-date=21 March 2015|archive-url=https://web.archive.org/web/20150107140627/http://www.bbc.co.uk/news/science-environment-22355515|archive-date=7 January 2015|url-status=live}}</ref> |
|||
| |
|||
| |
|- |
||
|<ref>[http://www.breitbart.com/article.php?id=080425101050.cni2ks3u&show_article=1 Humans lived in tiny, separate bands for 100,000 years<!-- Bot generated title -->]</ref> |
|||
|- style="text-align:right;" |
|||
!style="text-align: right;" |10,000 BC |
!style="text-align: right;" |10,000 BC |
||
| |
| 4 |
||
| |
| |
||
| |
| |
||
| Line 93: | Line 998: | ||
| |
| |
||
| |
| |
||
|<ref name="HistoricalEstimates">An approximation based on figures from different sources as listed at the US Census Bureau's [https://www.census.gov/data/tables/time-series/demo/international-programs/historical-est-worldpop.html Historical Estimates of World Population] {{Webarchive|url=https://web.archive.org/web/20190502001420/https://www.census.gov/data/tables/time-series/demo/international-programs/historical-est-worldpop.html |date=2 May 2019 }}; see also *{{cite journal |last1=Kremer |first1=Michael | author-link = Michael Kremer |year=1993 |title=Population Growth and Technological Change: One Million B.C. to 1990 |journal=The Quarterly Journal of Economics |volume=108 |issue=3 |pages=681–716 |doi=10.2307/2118405 |jstor=2118405}}</ref> |
|||
| |
|||
|- |
|||
|- style="text-align:right;" |
|||
!style="text-align: right;" | 9000 BC |
|||
| 3,000 |
|||
| |
|||
| |
|||
| |
|||
| |
|||
| |
|||
| |
|||
|- style="text-align:right;" |
|||
!style="text-align: right;" | 8000 BC |
!style="text-align: right;" | 8000 BC |
||
| 5 |
| 5 |
||
| |
| |
||
| |
| |
||
| |
|||
| |
|||
| |
|||
| |
|||
|<ref name="HistoricalEstimates">an average of figures from different sources as listed at the US Census Bureau's [http://www.census.gov/ipc/www/worldhis.html Historical Estimates of World Population]; see also *[[Michael Kremer|Kremer, Michael]]. 1993. "Population Growth and Technological Change: One Million B.C. to 1990," The Quarterly Journal of Economics 108(3): 681-716. </ref> |
|||
|- style="text-align:right;" |
|||
!style="text-align: right;" | 7000 BC |
|||
| 7,000 |
|||
| |
| |
||
| |
| |
||
| Line 121: | Line 1,009: | ||
| |
| |
||
| |
| |
||
|- |
|||
!style="text-align: right;" | 6500 BC |
|||
| 5 |
|||
| |
| |
||
| |
| |
||
|- style="text-align:right;" |
|||
!style="text-align: right;" | 6000 BC |
|||
| 10,000 |
|||
| |
| |
||
| |
| |
||
| Line 131: | Line 1,019: | ||
| |
| |
||
| |
| |
||
| |
|- |
||
| |
|||
|- style="text-align:right;" |
|||
!style="text-align: right;" | 5000 BC |
!style="text-align: right;" | 5000 BC |
||
| |
| 5 |
||
| |
| |
||
| |
| |
||
| Line 143: | Line 1,029: | ||
| |
| |
||
| |
| |
||
|- |
|||
|- style="text-align:right;" |
|||
!style="text-align: right;" | 4000 BC |
!style="text-align: right;" | 4000 BC |
||
| |
| 7 |
||
| |
| |
||
| |
| |
||
| Line 152: | Line 1,038: | ||
| |
| |
||
| |
| |
||
| |
|||
|<ref>Bishop Ussher places creation of [http://en.wikipedia.org/wiki/Adam_and_eve Adam and Eve;] world population two.</ref> |
|||
|- |
|||
|- style="text-align:right;" |
|||
!style="text-align: right;" | 3000 BC |
!style="text-align: right;" | 3000 BC |
||
| |
| 14 |
||
| |
| |
||
| |
| |
||
| Line 163: | Line 1,049: | ||
| |
| |
||
| |
| |
||
|- |
|||
|- style="text-align:right;" |
|||
!style="text-align: right;" | 2000 BC |
!style="text-align: right;" | 2000 BC |
||
| |
| 27 |
||
| |
| |
||
| |
| |
||
| Line 173: | Line 1,059: | ||
| |
| |
||
| |
| |
||
|- |
|||
|- style="text-align:right;" |
|||
!style="text-align: right;" | 1000 BC |
!style="text-align: right;" | 1000 BC |
||
| 50 |
| 50 |
||
| |
| 7 |
||
| 33 |
|||
| 9 |
|||
| |
| |
||
| |
| |
||
| |
| |
||
|{{Citation needed|date=September 2014}} |
|||
| |
|||
| |
|- |
||
|<ref name="HistoricalEstimates"/> |
|||
|- style="text-align:right;" |
|||
!style="text-align: right;" | 500 BC |
!style="text-align: right;" | 500 BC |
||
| 100 |
| 100 |
||
| 14 |
|||
| 66 |
|||
| 16 |
|||
| |
| |
||
| |
| |
||
| |
| |
||
| |
| |
||
|- |
|||
!style="text-align: right;" | AD 1 |
|||
| 200 |
|||
| 23 |
|||
| 141 |
|||
| 28 |
|||
| |
| |
||
| |
| |
||
|<ref name="HistoricalEstimates"/> |
|||
|- style="text-align:right;" |
|||
!style="text-align: right;" | 1 |
|||
| 200,000 |
|||
| |
| |
||
| |
| |
||
| |
|||
| |
|||
| |
|||
| |
|||
|<ref>The range of figures from different sources as listed at the US Census Bureau's [http://www.census.gov/ipc/www/worldhis.html Historical Estimates of World Population] put the population at 1 AD between 170 million to 400 million.</ref> |
|||
|- |
|- |
||
!style="text-align: right;" | 1000 |
!style="text-align: right;" | 1000 |
||
| |
| 400 |
||
| |
| 70 |
||
| 269 |
|||
| |
|||
| |
| 50 |
||
| 8 |
|||
| 1 |
|||
| 2 |
|||
| |
| |
||
|- |
|||
!style="text-align: right;" | 1500 |
|||
|458 |
|||
|86 |
|||
|243 |
|||
|84 |
|||
|39 |
|||
|3 |
|||
|3 |
|||
| |
| |
||
|- |
|||
!style="text-align:right;" | 1600 |
|||
|580 |
|||
|114 |
|||
|339 |
|||
|111 |
|||
|10 |
|||
|3 |
|||
|3 |
|||
| |
| |
||
|- |
|||
!style="text-align: right;" | 1700 |
|||
|682 |
|||
|106 |
|||
|436 |
|||
|125 |
|||
|10 |
|||
|2 |
|||
|3 |
|||
| |
| |
||
|- |
|- |
||
!style="text-align: right;" | 1750 |
!style="text-align: right;" | 1750 |
||
| 791 |
| 791 |
||
| 106 |
| 106 |
||
| 502 |
| 502 |
||
| 163 |
| 163 |
||
| 16 |
| 16 |
||
| 2 |
| 2 |
||
| 2 |
| 2 |
||
| |
| |
||
|- |
|- |
||
!style="text-align: right;" | 1800 |
!style="text-align: right;" | 1800 |
||
| |
| 1,000 |
||
| 107 |
| 107 |
||
| 656 |
|||
| 635,000 |
|||
| 203 |
| 203 |
||
| 24 |
| 24 |
||
| 7 |
| 7 |
||
| |
| 3 |
||
| |
| |
||
|- |
|- |
||
!style="text-align: right;" | 1850 |
!style="text-align: right;" | 1850 |
||
| 1,262 |
| 1,262 |
||
| 111 |
| 111 |
||
| 809 |
| 809 |
||
| 276 |
| 276 |
||
| 38 |
| 38 |
||
| 26 |
| 26 |
||
| 2 |
| 2 |
||
| |
| |
||
|- |
|- |
||
!style="text-align: right;" |1900 |
!style="text-align: right;" | 1900 |
||
| 1,650 |
| 1,650 |
||
| 133 |
| 133 |
||
| 947 |
| 947 |
||
| 408 |
| 408 |
||
| 74 |
| 74 |
||
| 82 |
| 82 |
||
| 6 |
| 6 |
||
| |
| |
||
|- |
|- |
||
!style="text-align: right;" |1950 |
!style="text-align: right;" | 1950 |
||
| 2, |
| 2,525 |
||
| |
| 229 |
||
| 1, |
| 1,394 |
||
| |
| 549 |
||
| 169 |
|||
| 167,097 |
|||
| |
| 172 |
||
| 12 |
| 12.7 |
||
|<ref name="CensusPopulation">An approximation based on figures from different sources as listed at the US Census Bureau's [https://www.census.gov/population/international/data/worldpop/table_population.php Total Midyear Population for the World: 1950–2050] {{Webarchive|url=https://web.archive.org/web/20170521041303/https://www.census.gov/population/international/data/worldpop/table_population.php |date=21 May 2017 }}</ref> |
|||
|- |
|||
!style="text-align: right;" | 1955 |
|||
| 2,758 |
|||
| 254 |
|||
| 1,534 |
|||
| 577 |
|||
| 193 |
|||
| 187 |
|||
| 14.2 |
|||
| |
| |
||
|- |
|- |
||
!style="text-align: right;" | |
!style="text-align: right;" | 1960 |
||
| |
| 3,018 |
||
| |
| 285 |
||
| 1, |
| 1,687 |
||
| |
| 606 |
||
| |
| 221 |
||
| |
| 204 |
||
| |
| 15.8 |
||
| |
| |
||
|- |
|- |
||
!style="text-align: right;" | |
!style="text-align: right;" | 1965 |
||
| |
| 3,322 |
||
| |
| 322 |
||
| 1, |
| 1,875 |
||
| |
| 635 |
||
| |
| 254 |
||
| |
| 219 |
||
| |
| 17.5 |
||
| |
| |
||
|- |
|- |
||
!style="text-align: right;" | |
!style="text-align: right;" | 1970 |
||
| 3, |
| 3,682 |
||
| |
| 366 |
||
| |
| 2,120 |
||
| |
| 657 |
||
| |
| 288 |
||
| 231 |
|||
| 219,570 |
|||
| |
| 19.7 |
||
| |
| |
||
|- |
|- |
||
!style="text-align: right;" | |
!style="text-align: right;" | 1975 |
||
| |
| 4,061 |
||
| |
| 416 |
||
| 2, |
| 2,378 |
||
| |
| 677 |
||
| |
| 326 |
||
| |
| 242 |
||
| |
| 21.5 |
||
| |
|||
|- |
|- |
||
!style="text-align: right;" | |
!style="text-align: right;" | 1980 |
||
| 4, |
| 4,440 |
||
| |
| 478 |
||
| 2, |
| 2,626 |
||
| |
| 694 |
||
| |
| 365 |
||
| |
| 254 |
||
| |
| 23.0 |
||
| |
| |
||
|- |
|- |
||
!style="text-align: right;" | |
!style="text-align: right;" | 1985 |
||
| 4, |
| 4,853 |
||
| |
| 550 |
||
| 2, |
| 2,897 |
||
| |
| 708 |
||
| |
| 406 |
||
| |
| 267 |
||
| |
| 24.9 |
||
| |
| |
||
|- |
|- |
||
!style="text-align: right;" | |
!style="text-align: right;" | 1990 |
||
| |
| 5,310 |
||
| |
| 632 |
||
| |
| 3,202 |
||
| |
| 721 |
||
| |
| 447 |
||
| |
| 281 |
||
| |
| 27.0 |
||
| |
| |
||
|- |
|- |
||
!style="text-align: right;" | |
!style="text-align: right;" | 1995 |
||
| 5, |
| 5,735 |
||
| |
| 720 |
||
| 3, |
| 3,475 |
||
| |
| 728 |
||
| |
| 487 |
||
| |
| 296 |
||
| |
| 29.1 |
||
| |
| |
||
|- |
|- |
||
!style="text-align: right;" | |
!style="text-align: right;" | 2000 |
||
| |
| 6,127 |
||
| |
| 814 |
||
| 3, |
| 3,714 |
||
| |
| 726 |
||
| |
| 527 |
||
| |
| 314 |
||
| |
| 31.1 |
||
| |
| |
||
|- |
|- |
||
!style="text-align: right;" | |
!style="text-align: right;" | 2005 |
||
| 6, |
| 6,520 |
||
| |
| 920 |
||
| 3, |
| 3,945 |
||
| |
| 729 |
||
| |
| 564 |
||
| |
| 329 |
||
| |
| 33.4 |
||
| |
| |
||
|- |
|- |
||
!style="text-align: right;" | |
!style="text-align: right;" | 2010 |
||
| 6, |
| 6,930 |
||
| |
| 1,044 |
||
| |
| 4,170 |
||
| |
| 735 |
||
| |
| 600 |
||
| |
| 344 |
||
| 36.4 |
|||
| 32,998** |
|||
| |
| |
||
|- |
|- |
||
!style="text-align: right;" | 2015 |
|||
! Year |
|||
|7,349 |
|||
! width="70"| World |
|||
|1,186 |
|||
! width="70"| [[Africa]] |
|||
|4,393 |
|||
! width="70"| [[Asia]] |
|||
|738 |
|||
! width="70"| [[Europe]] |
|||
|634 |
|||
! width="70"| [[South America]] * |
|||
|358 |
|||
! width="70"| [[Northern America]]* |
|||
|39.3 |
|||
! width="70"| [[Oceania]] |
|||
| |
|||
! Notes |
|||
|- |
|||
|} |
|} |
||
Using the above figures, the change in population from 2010 to 2015 was: |
|||
<nowiki>*</nowiki> ''[[Northern America]] indicates the northern countries and territories of North America: Canada, the United States, [[Greenland]], [[Bermuda]], and [[St. Pierre and Miquelon]]. This should not be confused with the term "North America" which typically includes Mexico. The United Nations data includes Mexico as part of Latin America. |
|||
* World: +420 million |
|||
* Africa: +142 million |
|||
* Asia: +223 million |
|||
* Europe: +3 million |
|||
* Latin America and Caribbean: +35 million |
|||
* Northern America: +14 million |
|||
* Oceania: +2.9 million |
|||
{{Reflist|group=Note|refs= |
|||
<nowiki>**</nowiki> ''This figure is disputed.'' |
|||
<ref name=Americas>'''North America''' is here defined to include the northernmost countries and territories of North America: Canada, the United States, [[Greenland]], [[Bermuda]], and [[Saint Pierre and Miquelon]]. '''Latin America & Carib.''' comprises Mexico, Central America, the [[Caribbean]], and South America.</ref> |
|||
}} |
|||
===Projections=== |
|||
==Rate of increase== |
|||
{{Main|Projections of population growth|Future generations}} |
|||
{{main|Population growth}} |
|||
{{More citations needed section|date=April 2020}} |
|||
Long-term global population growth is difficult to predict. The United Nations and the US Census Bureau both give different estimates – according to the UN, the world population reached seven billion in late 2011,<ref name=UN>{{cite web |url=https://www.un.org/esa/population/publications/wpp2008/wpp2008_highlights.pdf |title=World Population Prospects: The 2008 Revision |publisher=[[Population Division of the Department of Economic and Social Affairs of the United Nations Secretariat]] |date=June 2009|access-date=20 June 2013|archive-url=https://web.archive.org/web/20130319095657/http://www.un.org/esa/population/publications/wpp2008/wpp2008_highlights.pdf|archive-date=19 March 2013|url-status=live}}</ref> while the USCB asserted that this occurred in March 2012.<ref>{{cite web |url=https://www.census.gov/ipc/www/popwnote.html |publisher=US Census Bureau |title=Notes on the World POPClock and World Vital Events | access-date = 12 February 2013 | archive-url = https://web.archive.org/web/20131002103104/http://www.census.gov/ipc/www/popwnote.html | archive-date = 2 October 2013 | url-status = live}}</ref> Since 1951 the UN has issued multiple projections of future world population, based on different assumptions. From 2000 to 2005, the UN consistently revised these projections downward, until the 2006 revision, issued on 14 March 2007, revised the 2050 mid-range estimate upwards by 273 million.{{Citation needed|date=May 2022}} |
|||
[[Image:World population (UN).svg|thumb|right|300px|right|Population evolution in different [[continent]]s. The vertical axis is logarithmic and is millions of people.]] |
|||
Complicating the UN's and others' attempts to project future populations is the fact that average global [[birth rate]]s, as well as [[mortality rate]]s, are declining rapidly, as the nations of the world progress through the stages of the demographic transition, but both vary greatly between developed countries (where birth rates and mortality rates are often low) and developing countries (where birth and mortality rates typically remain high). Different ethnicities also display varying birth rates.{{Citation needed|date=May 2022}} Both of these can change rapidly due to [[Infectious disease#Mortality from infectious diseases|disease epidemics]], [[List of wars|wars]] and other mass catastrophes, or [[Life extension|advances in medicine]] and [[public health]]. |
|||
Different regions have different rates of [[population growth]]. According to the above table, the growth in population of the different regions from 2000 to 2005 was: |
|||
: 237.771 million in Asia |
|||
: 92.293 million in Africa |
|||
: 38.052 million in Latin America |
|||
: 16.241 million in Northern America |
|||
: 1.955 million in Oceania |
|||
: -3.264 million in Europe |
|||
: 383.047 million in the whole world |
|||
In the unusual case of the 20th century, the world saw the biggest increase in its population in human history due to lessening of the [[mortality rate]] in many countries due to [[History of medicine#Modern medicine|medical advances]] and massive increase in agricultural productivity made by the [[Green Revolution]].{{Fact|date=September 2008}} |
|||
The UN's first report in 1951 showed that during the period 1950–55 the [[Birth rate|crude birth rate]] was 36.9/1,000 population and the [[Mortality rate|crude death rate]] was 19.1/1,000. By the period 2015–20 both numbers had dropped significantly to 18.5/1,000 for the crude birth rate and 7.5/1,000 for the crude death rate. UN projections for 2100 show a further decline in the crude birth rate to 11.6/1,000 and an increase in the crude death rate to 11.2/1,000.<ref>{{Cite web |year=2019 |title=World Population Prospects 2019, Crude Birth Rate file |url=https://population.un.org/wpp/Download/Standard/Population/ |website=United Nations Department of Economic and Social Affairs}}</ref><sup>,</sup><ref>{{Cite web |year=2019 |title=World Population Prospects 2019, Crude Death Rate file |url=https://population.un.org/wpp/Download/Standard/Mortality/ |website=United Nations Department of Economic and Social Affairs}}</ref> |
|||
In 2000, the [[United Nations]] estimated that the world's population was growing at the rate of 1.14% (or about 75 million people) per year,<ref>[http://www.census.gov/ipc/www/worldpop.html census.gov]</ref> down from a peak of 86 million per year in 1987. In the last few centuries, the number of people living on Earth has increased many times over. By the year 2000, there were 10 times as many people on Earth as there were 300 years ago. According to data from the CIA's 2005–2006 [[The World Factbook|World Factbook]]s, the world human population increased by 203,800 every day.<ref>[http://www.xist.org/earth/population1.aspx Current world population (ranked)]</ref> |
|||
The 2007 CIA factbook increased this to 211,090 people every day. |
|||
The total number of births globally is currently (2015–20) 140 million/year, is projected to peak during the period 2040–45 at 141 million/year and thereafter decline slowly to 126 million/year by 2100.<ref name=":2">{{Cite web |year=2019 |title=World Population Prospects 2019, Births file |url=https://population.un.org/wpp/Download/Standard/Fertility/ |website=United Nations Department of Economic and Social Affairs}}</ref> The total number of deaths is currently 57 million/year and is projected to grow steadily to 121 million/year by 2100.<ref name=":3">{{Cite web |year=2019 |title=World Population Prospects 2019, Deaths file |url=https://population.un.org/wpp/Download/Standard/Mortality/ |website=United Nations Department of Economic and Social Affairs}}</ref> |
|||
Globally, the population [[population growth|growth rate]] has been steadily declining from its peak of 2.19% in 1963, but growth remains high in the [[Middle East]] and [[Sub-Saharan Africa]].<ref>Ron Nielsen, ''The little green handbook'', Picador, New York (2006) ISBN 0-312-42581-3</ref> |
|||
2012 United Nations projections show a continued increase in population in the near future with a steady decline in population growth rate; the global population is expected to reach between 8.3 and 10.9 billion by 2050.<ref>{{cite web |url=http://esa.un.org/wpp/unpp/panel_population.htm |title=World Population Prospects, the 2012 Revision – "Low variant" and "High variant" values |publisher=UN |year=2012|access-date=15 June 2013|archive-url=https://web.archive.org/web/20140701185837/http://esa.un.org/wpp/unpp/panel_population.htm|archive-date=1 July 2014|url-status=dead}}</ref><ref>{{cite web |url=https://www.un.org/apps/news/story.asp?NewsID=45165 |title=World population projected to reach 9.6 billion by 2050 – UN report |publisher=UN News Centre |date=14 June 2013|access-date=16 June 2013|archive-url=https://web.archive.org/web/20130823185917/http://www.un.org/apps/news/story.asp?NewsID=45165|archive-date=23 August 2013|url-status=live}}</ref> 2003 [[United Nations Population Division|UN Population Division]] population projections for the year 2150 range between 3.2 and 24.8 billion.<ref name="LongRangeProjections2003KeyFindings">{{Cite book |title=Long-Range Population Projections |date=2003 |work=Proceedings of the United Nations Technical Working Group on Long-Range Population Projections |publisher=United Nations: Department of Economic and Social Affairs |place=New York |chapter=Key Findings |access-date=3 July 2010 |chapter-url=https://www.un.org/esa/population/publications/longrange/longrangeKeyFind.pdf}}</ref> One of many independent mathematical models supports the lower estimate,<ref>{{cite web |url=https://www.sciencedaily.com/releases/2013/04/130404072923.htm |title=A model predicts that the world's populations will stop growing in 2050 |publisher=ScienceDaily.com |date=4 April 2013 |access-date=3 June 2013 |archive-url=https://web.archive.org/web/20200102113023/https://www.sciencedaily.com/releases/2013/04/130404072923.htm |archive-date=2 January 2020 |url-status=live}}</ref> while a 2014 estimate forecasts between 9.3 and 12.6 billion in 2100, and continued growth thereafter.<ref>{{cite web |url=https://www.theguardian.com/environment/2014/sep/18/world-population-new-study-11bn-2100 |title=World population to hit 12bn in 2100 – with 70% chance of continuous rise |author=Carrington, Damien |date=18 September 2014 |work=The Guardian|access-date=21 September 2014|archive-url=https://web.archive.org/web/20140920203432/http://www.theguardian.com/environment/2014/sep/18/world-population-new-study-11bn-2100|archive-date=20 September 2014|url-status=live}}</ref><ref>{{Cite journal |doi=10.1126/science.1257469 |pmid=25301627 |title=World population stabilization unlikely this century |journal=Science |volume=346 |issue=6206 |pages=234–7 |publisher=AAAS |date=14 September 2014 |issn=1095-9203 |last1=Gerland |first1=P. |last2=Raftery |first2=A. E. |last3=Ev Ikova |first3=H. |last4=Li |first4=N. |last5=Gu |first5=D. |last6=Spoorenberg |first6=T. |last7=Alkema |first7=L. |last8=Fosdick |first8=B. K. |last9=Chunn |first9=J.| last10 = Lalic | first10 = N. |last11=Bay |first11=G. |last12=Buettner |first12=T. |last13=Heilig |first13=G. K. |last14=Wilmoth |first14=J. |pmc=4230924 |bibcode=2014Sci...346..234G}}</ref> The 2019 Revision of the UN estimates gives the "medium variant" population as; nearly 8.6 billion in 2030, about 9.7 billion in 2050 and about 10.9 billion in 2100.<ref>{{Cite web |url=https://population.un.org/wpp/Publications/Files/WPP2019_10KeyFindings.pdf |title=World Population Prospects 2019: Highlights |access-date=8 July 2019 |archive-url=https://web.archive.org/web/20190703142439/https://population.un.org/wpp/Publications/Files/WPP2019_10KeyFindings.pdf |archive-date=3 July 2019 |url-status=live}}</ref> In December 2019, the [[German Foundation for World Population]] projected that the global population will reach 8 billion by 2023 as it increases by 156 every minute.<ref>{{cite news |last=Silk |first=John |date=21 December 2019 |title=World's population to hit 7.75 billion in 2019 |url=https://www.dw.com/en/worlds-population-to-hit-775-billion-in-2019/a-51758905 |publisher=[[Deutsche Welle]] |access-date=17 July 2020}}</ref> In a modeled future projection by the [[Institute for Health Metrics and Evaluation]] the global population was projected to peak in 2064 at 9.73 billion people and decline to 8.79 billion in 2100.<ref>{{Cite web |date=15 July 2020 |title=World population in 2100 could be 2 billion below UN forecasts, study suggests |url=http://www.theguardian.com/world/2020/jul/15/world-population-in-2100-could-be-2-billion-below-un-forecasts-study-suggests|access-date=15 July 2020 |website=The Guardian |language=en}}</ref> Some analysts have questioned the sustainability of further world population growth, highlighting the [[Human impact on the environment|growing pressures on the environment]],<ref name="StokstadAAAS">{{Cite web |url=https://www.science.org/content/article/landmark-analysis-documents-alarming-global-decline-nature |title=Landmark analysis documents the alarming global decline of nature |last=Stokstad |first=Erik |date=5 May 2019 |website=[[Science (journal)|Science]] |publisher=[[American Association for the Advancement of Science|AAAS]] |language=en|access-date=19 July 2020 |quote="Driving these threats are the growing human population, which has doubled since 1970 to 7.6 billion, and consumption. (Per capita of use of materials is up 15% over the past 5 decades.)"}}</ref><ref>{{cite journal |last1=Crist |first1=Eileen |last2=Ripple |first2=William J.|author-link2=William J. Ripple |last3=Ehrlich |first3=Paul R.|author-link3=Paul R. Ehrlich |last4=Rees |first4=William E. |last5=Wolf |first5=Christopher |year=2022 |title=Scientists' warning on population |url=https://scientistswarning.forestry.oregonstate.edu/sites/default/files/Crist2022.pdf |journal=[[Science of the Total Environment]] |volume=845 |page=157166 |doi=10.1016/j.scitotenv.2022.157166 |pmid=35803428 |bibcode=2022ScTEn.845o7166C |s2cid=250387801}}</ref> global food supplies, and energy resources.<ref>{{cite book |author=Peter P. Rogers |author2=Kazi F. Jalal |author3=John A. Boyd|name-list-style=amp |date=2008 |url=https://books.google.com/books?id=GZ4Pvk0LVQMC |title=An Introduction To Sustainable Development |page=53 |publisher=Earthscan |isbn=978-1849770477}}</ref><ref name="TIMEenvir">{{cite news |url=http://www.time.com/time/specials/packages/article/0,28804,2097720_2097782_2097814,00.html |title=Overpopulation's Real Victim Will Be the Environment |magazine=Time |date=26 October 2011|access-date=18 February 2013|archive-url=https://web.archive.org/web/20130218180534/http://www.time.com/time/specials/packages/article/0,28804,2097720_2097782_2097814,00.html|archive-date=18 February 2013|url-status=dead}}</ref><ref name="Zehner">{{cite book |last=Zehner |first=Ozzie |title=Green Illusions |date=2012 |publisher=University of Nebraska Press |location=Lincoln and London |pages=187–331 |url=http://greenillusions.org|access-date=10 April 2020|archive-url=https://web.archive.org/web/20191129202344/http://www.greenillusions.org/|archive-date=29 November 2019|url-status=live}}</ref> |
|||
In some countries there is negative population growth (i.e. net decrease in population over time), especially in [[Central Europe|Central]] and [[Eastern Europe]] (mainly due to low [[fertility rate]]s) and [[Southern Africa]] (due to the high number of [[HIV]]-related deaths). Within the next decade, [[Japan]] and some countries in [[Western Europe]] are also expected to encounter negative population growth due to [[sub-replacement fertility]] rates. |
|||
{| class="wikitable" style="text-align:center; margin-top:0.5em; margin-right:1em; float:left; font-size:96%;" |
|||
Population growth which exceeds the [[carrying capacity]] of an area or environment results in [[overpopulation]]. Conversely, such areas may be considered "underpopulated" if the population is not large enough to maintain an [[economic system]]; however, many who do not view overpopulation as a serious problem fail to consider the [[sustainability]] of economic systems, the [[environmental degradation]] caused, and the [[ecological footprint]] of the existing population. |
|||
|+ UN (medium variant – 2019 revision) and US Census Bureau (June 2015) estimates<ref name=UN19>{{cite web |url=https://population.un.org/wpp/Download/Files/1_Indicators%20(Standard)/EXCEL_FILES/1_Population/WPP2019_POP_F01_1_TOTAL_POPULATION_BOTH_SEXES.xlsx |title=World Population Prospects: The 2019 Revision |publisher=[[Population Division of the Department of Economic and Social Affairs of the United Nations Secretariat]] |format=XLS |date=June 2019|access-date=8 July 2019}}</ref><ref>{{cite web |url=https://www.census.gov/population/international/data/worldpop/table_population.php |title=World Population – Total Midyear Population for the World: 1950–2050 |publisher=Census.gov |date=July 2015 |access-date=7 March 2016 |archive-url=https://web.archive.org/web/20170521041303/https://www.census.gov/population/international/data/worldpop/table_population.php |archive-date=21 May 2017 |url-status=live}}</ref> |
|||
The [[United Nation]]s states that population growth is rapidly declining due to the [[demographic transition]]. The world population is expected to peak at 9.22 billion in 2075. [http://www.un.org/esa/population/publications/longrange2/WorldPop2300final.pdf] |
|||
<gallery> |
|||
Image:Population curve.svg|Population (est.) [[10th millennium BC|10,000 BC]] – 2000 AD. |
|||
Image:World population curve - log y scale.png|Population (est.) in log y scale |
|||
Image:World population history.svg|World population 1950–2000 |
|||
Image:World population increase history.svg|Increase rate 1950–2000 |
|||
</gallery> |
|||
===Milestones=== |
|||
{| class="wikitable" style="text-align:center;" |
|||
|+[[World population estimates]] milestones . |
|||
|- |
|||
! Population<br /><small>(in billions)</small> |
|||
! 1 !! 2 !! 3 !! 4 !! 5 !! 6 !! ''7'' !! ''8'' !! ''9'' |
|||
|- |
|- |
||
! Year |
! Year |
||
! UN est.<br /><small>(millions)</small> |
|||
| 1804 || 1927 || 1961 || 1974 || 1987 || 1999 || ''2011'' || ''2024'' || ''2042'' |
|||
! <small>Difference</small> |
|||
! USCB est.<br /><small>(millions)</small> |
|||
! <small>Difference</small> |
|||
|- |
|- |
||
!{{anchor|2005}}2005 |
|||
! Years elapsed |
|||
|6,542 |
|||
| || 123 || 34 || 13 || 13 || 12 || ''12'' || ''13'' || ''18'' |
|||
| – |
|||
|} |
|||
|6,473 |
|||
| – |
|||
These numbers show that the world's population has tripled in 72 years, and doubled in 38 years up to the year 1999. Including some [[World population estimates|more estimates]], the world population has been doubled or will double in the following years (with two different starting points). Note how, during the [[2nd millennium]], each doubling has taken roughly half as long as the previous doubling. |
|||
{| class="wikitable" style="text-align:center;" |
|||
|- |
|- |
||
!2010 |
|||
! |
|||
|6,957 |
|||
! |
|||
|415 |
|||
! colspan=6 | Starting at 250 million |
|||
|6,866 |
|||
! |
|||
|393 |
|||
! colspan=5 | Starting at 375 million |
|||
|- |
|- |
||
!2015 |
|||
! Population<br /><small>(in billions)</small> |
|||
|7,380 |
|||
! !! 0.25 !! 0.5 !! 1 !! 2 !! 4 !! ''8'' !! !! 0.375 !! 0.75 !! 1.5 !! 3 !! 6 |
|||
|423 |
|||
|7,256 |
|||
|390 |
|||
|- |
|- |
||
!2020 |
|||
! Year |
|||
|7,795 |
|||
| || 950 || 1600 || 1804 || 1927 || 1974 || ''2024'' || || 1420 || 1720 || 1875 || 1961 || 1999 |
|||
| |
|415 |
||
|7,643 |
|||
! Years elapsed |
|||
|380 |
|||
| || || 650 || 204 || 123 || 47 || ''50'' || || || 300 || 155 || 86 || 38 |
|||
|} |
|||
==Distribution== |
|||
[[Image:Population density.png|thumb|right|560px|Population density map of the world in 1994, when the world's population was at 5600 million; Observe the high densities in the [[Indo-Gangetic Plain|Indo-Gangetic]] and [[North China Plain]]s, the [[Sichuan Basin]], the [[Nile river delta]], Southern [[Japan]], [[Western Europe]], the [[Indonesia]]n island of [[Java]], [[Central America]] (especially [[El Salvador]], the Americas' most densely populated nation), and the [[United States]]' [[BosWash]] [[megalopolis]].]] |
|||
{{main|Population density}} |
|||
[[Asia]] accounts for over 60% of the world population with almost 3800 million people. The [[People's Republic of China]] and [[India]] alone comprise 20% and 17% respectively. [[Africa]] follows with 840 million people, 12% of the world population. Europe's 710 million people make up 11% of the world's population. North America is home to 514 million (8%), [[South America]] to 371 million (5.3%), and [[Australia]] 21 million. <!-- Country of Australia as of June 2007 http://www.news.com.au/heraldsun/story/0,21985,21991413-662,00.html -- Note that definitions of "the Australian continent" vary. (New Guinea? New Zealand?) --> |
|||
== The 15 most populous nations == |
|||
[[Image:Die 15 bevölkerungsreichsten Staaten.png|thumb|300px|The 15 most populous nations]] |
|||
Approximately 4300 million people live in these 15 countries, representing roughly two-thirds of the world's population. If added together, all nations in the [[European Union]], with 494 million people – about 7.3% of world's population in 2006 – would be third in the list below. |
|||
{|class="wikitable" style="font-size:97%; text-align:right;" |
|||
!Country<ref>From DSW-Datareport 2006 ("Deutsche Stiftung Weltbevölkerung")</ref> |
|||
!Population<br /><small>(millions)</small> |
|||
!Percentage<br /><small>(of world)</small> |
|||
|- |
|- |
||
!2025 |
|||
| align="left"| [[People's Republic of China|China]] || 1,321 || 19.84% |
|||
|8,184 |
|||
|390 |
|||
|8,007 |
|||
|363 |
|||
|- |
|- |
||
!2030 |
|||
| align="left"| [[India]] || 1,132 || 16.96% |
|||
|8,549 |
|||
|364 |
|||
|8,341 |
|||
|334 |
|||
|- |
|- |
||
!2035 |
|||
| align="left"| [[United States]] || 304 || 4.56% <!-- http://www.census.gov/main/www/popclock.html --> |
|||
|8,888 |
|||
|339 |
|||
|8,646 |
|||
|306 |
|||
|- |
|- |
||
!2040 |
|||
| align="left"| [[Indonesia]] || 232 || 3.47% |
|||
|9,199 |
|||
|311 |
|||
|8,926 |
|||
|280 |
|||
|- |
|- |
||
!2045 |
|||
| align="left"| [[Brazil]] || 187 || 2.80% |
|||
|9,482 |
|||
|283 |
|||
|9,180 |
|||
|254 |
|||
|- |
|- |
||
!2050 |
|||
| align="left"| [[Pakistan]] || 163 || 2.44% |
|||
|9,735 |
|||
|253 |
|||
|9,408 |
|||
|228 |
|||
|} |
|||
{| class="wikitable" style="text-align:right; margin-top:2.6em; font-size:96%;" |
|||
|+UN 2019 estimates and medium variant projections (in millions)<ref name=UN19 /> |
|||
! Year |
|||
! World |
|||
! Asia |
|||
! Africa |
|||
! Europe |
|||
! Latin America/Caribbean |
|||
! Northern America |
|||
! Oceania |
|||
|- |
|- |
||
!style="text-align: right;" |{{anchor|2000}}2000 |
|||
| align="left"| [[Bangladesh]] || 159 || 2.38% |
|||
| 6,144 |
|||
| 3,741 (60.9%) |
|||
| 811 (13.2%) |
|||
| 726 (11.8%) |
|||
| 522 (8.5%) |
|||
| 312 (5.1%) |
|||
| 31 (0.5%) |
|||
|- |
|- |
||
!style="text-align: right;" |{{anchor|2005}}2005 |
|||
| align="left"| [[Nigeria]] || 148 || 2.22% |
|||
| 6,542 |
|||
| 3,978 (60.8%) |
|||
| 916 (14.0%) |
|||
| 729 (11.2%) |
|||
| 558 (8.5%) |
|||
| 327 (5.0%) |
|||
| 34 (0.5%) |
|||
|- |
|- |
||
!style="text-align: right;" |{{anchor|2010}}2010 |
|||
| align="left"| [[Russia]] || 142 || 2.13% |
|||
| 6,957 |
|||
| 4,210 (60.5%) |
|||
| 1,039 (14.9%) |
|||
| 736 (10.6%) |
|||
| 591 (8.5%) |
|||
| 343 (4.9%) |
|||
| 37 (0.5%) |
|||
|- |
|- |
||
!style="text-align: right;" |{{anchor|2015}}2015 |
|||
| align="left"| [[Japan]] || 128 || 1.92% |
|||
| 7,380 |
|||
| 4,434 (60.1%) |
|||
| 1,182 (16.0%) |
|||
| 743 (10.1%) |
|||
| 624 (8.5%) |
|||
| 357 (4.8%) |
|||
| 40 (0.5%) |
|||
|- |
|- |
||
!style="text-align: right;" |{{anchor|2020}}2020 |
|||
| align="left"| [[Mexico]] || 107 || 1.60% |
|||
| 7,795 |
|||
| 4,641 (59.5%) |
|||
| 1,341 (17.2%) |
|||
| 748 (9.6%) |
|||
| 654 (8.4%) |
|||
| 369 (4.7%) |
|||
| 43 (0.6%) |
|||
|- |
|- |
||
!style="text-align: right;" |{{anchor|2025}}2025 |
|||
| align="left"| [[Philippines]] || 89 || 1.33% |
|||
| 8,184 |
|||
| 4,823 (58.9%) |
|||
| 1,509 (18.4%) |
|||
| 746 (9.1%) |
|||
| 682 (8.3%) |
|||
| 380 (4.6%) |
|||
| 45 (0.6%) |
|||
|- |
|- |
||
!style="text-align: right;" |{{anchor|2030}}2030 |
|||
| align="left"| [[Vietnam]] || 84 || 1.31% |
|||
| 8,549 |
|||
| 4,974 (58.2%) |
|||
| 1,688 (19.8%) |
|||
| 741 (8.7%) |
|||
| 706 (8.3%) |
|||
| 391 (4.6%) |
|||
| 48 (0.6%) |
|||
|- |
|- |
||
!style="text-align: right;" |{{anchor|2035}}2035 |
|||
| align="left"| [[Germany]] || 82 || 1.23% |
|||
| 8,888 |
|||
| 5,096 (57.3%) |
|||
| 1,878 (21.1%) |
|||
| 735 (8.3%) |
|||
| 726 (8.2%) |
|||
| 401 (4.5%) |
|||
| 50 (0.6%) |
|||
|- |
|- |
||
!style="text-align: right;" |{{anchor|2040}}2040 |
|||
| align="left"| [[Egypt]] || 81 || 1.13% |
|||
| 9,199 |
|||
| 5,189 (56.4%) |
|||
| 2,077 (22.6%) |
|||
| 728 (7.9%) |
|||
| 742 (8.1%) |
|||
| 410 (4.5%) |
|||
| 53 (0.6%) |
|||
|- |
|- |
||
!style="text-align: right;" |{{anchor|2045}}2045 |
|||
!Total |
|||
| 9,482 |
|||
!4,356 |
|||
| 5,253 (55.4%) |
|||
!65.32% |
|||
| 2,282 (24.1%) |
|||
| 720 (7.6%) |
|||
| 754 (8.0%) |
|||
| 418 (4.4%) |
|||
| 55 (0.6%) |
|||
|- |
|- |
||
!style="text-align: right;" |{{anchor|2050}}2050 |
|||
|} |
|||
| 9,735 |
|||
[[Image:World population pie chart.PNG|thumb|left|500px|Population by region, 2007]] |
|||
| 5,290 (54.3%) |
|||
| 2,489 (25.6%) |
|||
==Ethnicity== |
|||
| 711 (7.3%) |
|||
{{main|List of ethnic groups}} |
|||
| 762 (7.8%) |
|||
The world is made up of hundreds of thousands of [[ethnic groups]], and due to mass [[Human migration|migration]] across the planet over millennia, it is impossible to tell how many people belonging to a certain ethnic group inhabit the earth. The single largest ethnic group on the planet by far is [[Han Chinese]], which represents 19.73% of the global population. For comparison 6.06% of the planet's population is of full or partial [[Spanish people|Spanish ancestry]], and on a wider scale 14.2% of earth's population is of [[Sub-Saharan]] descent (those identifying as 'Black'){{Fact|date=August 2008}}. |
|||
| 425 (4.4%) |
|||
| 57 (0.6%) |
|||
==Demographics of youth== |
|||
According to the 2006 [[The World Factbook|CIA World Factbook]], around 27% of the world's population is below 15 years of age.<ref>[https://www.cia.gov/library/publications/the-world-factbook/geos/xx.html#People Age structure of the world] – 2006 [[The World Factbook|CIA World Factbook]]</ref> |
|||
Before adding mortality rates, the 1990s saw the greatest number of raw births worldwide, especially in the years after 1995, despite the fact that the birth rate was not as high as in the 1960s. In fact, because of the 160 million-per-year raw births after 1995, the time it took to reach the next 10<sup>9</sup> reached its fastest pace (only 12 years), as world population reached 6000 million people in 1999, when at the beginning of the decade, the reaching was designated for the year 2000, by most demographers. People aged 7 through 17 make up these births, today. |
|||
1985–1990 marked the period with the fastest yearly population change in world history. Even though the early 1960s had a greater growth rate than in the mid and late 1980s, the population change hovered around 83 million people in the five-year period, with an all-time growth change of nearly 88 million in 1990. The reason is because the world's population was greater in the mid and late 1980s (around 5 billion) than in the early 1960s (around 3 billion), which meant that the growth rate in the 1980s was no factor on the dramatic population change. People aged 17 to 22 make up these births, today. |
|||
==Forecast== |
|||
{{main|World population estimates}} |
|||
{{seealso|Overpopulation}} |
|||
{| class="wikitable" style="text-align:center;" align="right" |
|||
|+ U.S. Census Bureau estimates<ref>[http://www.census.gov/ipc/www/idb/worldpopinfo.html U.S. Census Bureau - International Data Base (IDB)]</ref> |
|||
|- |
|- |
||
!style="text-align: right;" |{{anchor|2055}}2055 |
|||
! Year |
|||
| 9,958 |
|||
! abbr="Population" | Population<br>(in billions) |
|||
| 5,302 (53.2%) |
|||
| 2,698 (27.1%) |
|||
| 700 (7.0%) |
|||
| 767 (7.7%) |
|||
| 432 (4.3%) |
|||
| 60 (0.6%) |
|||
|- |
|- |
||
!style="text-align: right;" |{{anchor|2060}}2060 |
|||
!2010 |
|||
| 10,152 |
|||
|6.9 |
|||
| 5,289 (52.1%) |
|||
| 2,905 (28.6%) |
|||
| 689 (6.8%) |
|||
| 768 (7.6%) |
|||
| 439 (4.3%) |
|||
| 62 (0.6%) |
|||
|- |
|- |
||
!style="text-align: right;" |{{anchor|2065}}2065 |
|||
!2020 |
|||
| 10,318 |
|||
|7.7 |
|||
| 5,256 (51.0%) |
|||
| 3,109 (30.1%) |
|||
| 677 (6.6%) |
|||
| 765 (7.4%) |
|||
| 447 (4.3%) |
|||
| 64 (0.6%) |
|||
|- |
|- |
||
!style="text-align: right;" |{{anchor|2070}}2070 |
|||
!2030 |
|||
| 10,459 |
|||
|8.4 |
|||
| 5,207 (49.8%) |
|||
| 3,308 (31.6%) |
|||
| 667 (6.4%) |
|||
| 759 (7.3%) |
|||
| 454 (4.3%) |
|||
| 66 (0.6%) |
|||
|- |
|- |
||
!style="text-align: right;" |{{anchor|2075}}2075 |
|||
!2040 |
|||
| 10,577 |
|||
|9.0 |
|||
| 5,143 (48.6%) |
|||
| 3,499 (33.1%) |
|||
| 657 (6.2%) |
|||
| 750 (7.1%) |
|||
| 461 (4.4%) |
|||
| 67 (0.6%) |
|||
|- |
|||
!style="text-align: right;" |{{anchor|2080}}2080 |
|||
| 10,674 |
|||
| 5,068 (47.5%) |
|||
| 3,681 (34.5%) |
|||
| 650 (6.1%) |
|||
| 739 (6.9%) |
|||
| 468 (4.4%) |
|||
| 69 (0.7%) |
|||
|- |
|- |
||
!style="text-align: right;" |{{anchor|2085}}2085 |
|||
!2050 |
|||
| 10,750 |
|||
|9.5 |
|||
| 4,987 (46.4%) |
|||
| 3,851 (35.8%) |
|||
| 643 (6.0%) |
|||
| 726 (6.8%) |
|||
| 474 (4.4%) |
|||
| 71 (0.7%) |
|||
|- |
|||
!style="text-align: right;" |{{anchor|2090}}2090 |
|||
| 10,810 |
|||
| 4,901 (45.3%) |
|||
| 4,008 (37.1%) |
|||
| 638 (5.9%) |
|||
| 711 (6.6%) |
|||
| 479 (4.4%) |
|||
| 72 (0.7%) |
|||
|- |
|||
!style="text-align: right;" |{{anchor|2095}}2095 |
|||
| 10,852 |
|||
| 4,812 (44.3%) |
|||
| 4,152 (38.3%) |
|||
| 634 (5.8%) |
|||
| 696 (6.4%) |
|||
| 485 (4.5%) |
|||
| 74 (0.7%) |
|||
|- |
|||
!style="text-align: right;" |{{anchor|2100}}2100 |
|||
| 10,875 |
|||
| 4,719 (43.4%) |
|||
| 4,280 (39.4%) |
|||
| 630 (5.8%) |
|||
| 680 (6.3%) |
|||
| 491 (4.5%) |
|||
| 75 (0.7%) |
|||
|} |
|} |
||
In the long run, the future population growth of the world is difficult to predict. [[List of countries and territories by fertility rate|Birth rates]] are declining slightly on average, but vary greatly between developed countries (where birth rates are often at or below replacement levels), developing countries, and different ethnicities. [[Death rate]]s can change unexpectedly due to [[Infectious disease#Mortality from infectious diseases|disease]], [[List of wars|wars]] and catastrophes, or [[History of medicine#Modern medicine|advances in medicine]]. The UN itself has issued multiple projections of future world population, based on different assumptions. Over the last 10 years, the UN had consistently revised these projections downward, until the 2006 revision issued March 14, 2007 revised the 2050 mid range estimate upwards by 273 million. |
|||
==Mathematical approximations== |
|||
The United States Census Bureau issued a revised forecast for world population that increased its projection for the year 2050 to above 9.4 billion people (which was the UN's 1996 projection for 2050), up from 9.1 billion people. A new US Census Bureau revision from June 18, 2008 has increased its projections further, to beyond 9.5 billion in 2050. |
|||
In 1975, [[Sebastian von Hoerner]] proposed a formula for population growth which represented [[hyperbolic growth]] with an infinite population in 2025.<ref>{{cite journal |author=Sebastien von Hoerner |title=Population Explosion and Interstellar Expansion |journal=Journal of the British Interplanetary Society |issue=28 |year=1975 |volume=28 |pages=691–712 |bibcode=1975JBIS...28..691V}}</ref> The hyperbolic growth of the world population observed until the 1970s was later correlated to a non-linear second-order positive feedback between demographic growth and technological development. This feedback can be described as follows: technological advance → increase in the [[carrying capacity]] of land for people → demographic growth → more people → more potential inventors → acceleration of technological advance → accelerating growth of the carrying capacity → faster population growth → accelerating growth of the number of potential inventors → faster technological advance → hence, the faster growth of the Earth's carrying capacity for people, and so on.<ref>[http://urss.ru/cgi-bin/db.pl?cp=&page=Book&id=37484&lang=en&blang=en&list=14 ''Introduction to Social Macrodynamics'']. {{Webarchive|url=https://web.archive.org/web/20120210055935/http://urss.ru/cgi-bin/db.pl?cp=&lang=en&blang=en&list=14&page=Book&id=37484 |date=10 February 2012 }}. [[Andrey Korotayev]] et al. For a rigorous mathematical analysis of this issue, see [https://arxiv.org/abs/1206.0496 "A Compact Mathematical Model of the World System Economic and Demographic Growth, 1 CE – 1973 CE"]. {{Webarchive|url=https://web.archive.org/web/20190217142233/https://arxiv.org/abs/1206.0496 |date=17 February 2019 }}.</ref> The transition from hyperbolic growth to slower rates of growth is related to the demographic transition. |
|||
According to the Russian demographer [[Sergey Kapitsa]],<ref name=Kapitza>{{cite journal |first=Sergei P. |last=Kapitsa |url=http://srs.dl.ac.uk/SPEAKERS/KAPITZA/Uspekhi_96.html |title=The phenomenological theory of world population growth |journal=Physics-Uspekhi |volume=39 |number=1 |pages=57–71 |year=1996 |access-date=26 July 2013 |url-status=dead |archive-url=https://web.archive.org/web/20090511041230/http://srs.dl.ac.uk/SPEAKERS/KAPITZA/Uspekhi_96.html |archive-date=11 May 2009 |doi=10.1070/pu1996v039n01abeh000127 |bibcode=1996PhyU...39...57K |s2cid=250877833}}</ref> the world population grew between 67,000 BC and 1965 according to the following formula: |
|||
Other projections are that the world's population will eventually crest, though it is uncertain when or how. In some scenarios, it will crest as early as around 2050 at under 9 billion, or 10 to 11 billion, due to gradually decreasing birth rates.<ref name="unpp" />). |
|||
: <math>N = \frac{C}{\tau} \arccot \frac{T_0 - T}{\tau},</math> |
|||
where |
|||
: ''N'' is current population, |
|||
: ''T'' is the current year, |
|||
: ''C'' = (1.86 ± 0.01)·10<sup>11</sup>, |
|||
: ''T''<sub>0</sub> = 2007 ± 1, |
|||
: <math>\tau</math> = 42 ± 1. |
|||
===Years for world population to double=== |
|||
In other scenarios, disasters triggered by the growing population's demand for scarce resources will eventually lead to a sudden population crash, or even a |
|||
According to linear interpolation and extrapolation of [[Estimates of historical world population|UNDESA population estimates]], the world population has doubled, or will double, in the years listed in the tables below (with two different starting points). During the [[2nd millennium]], each doubling took roughly half as long as the previous doubling, fitting the hyperbolic growth model mentioned above. However, after 2024, it is unlikely that there will be another doubling of the global population in the 21st century.<ref>{{cite journal |first1=Wolfgang |last1=Lutz |first2=Warren |last2=Sanderson |first3=Sergei |last3=Scherbov |title=Doubling of world population unlikely |journal=Nature |volume=387 |pages=803–805 |date=19 June 1997 |issue=6635 |doi=10.1038/42935 |pmid=9194559 |url=http://pure.iiasa.ac.at/5299/1/RR-97-10.pdf |bibcode=1997Natur.387..803L |s2cid=4306159}}</ref> |
|||
[[Malthusian catastrophe]] (also see [[overpopulation]] and [[food security]]). |
|||
[[File:Population-doubling.svg|thumb|upright=1.35|Historic chart showing the periods of time the world population has taken to double, from 1700 to 2000]] |
|||
{| class="wikitable" style="text-align: |
{| class="wikitable" style="text-align:center; display:inline-table;" |
||
|+ Starting at 500 million |
|||
|+UN estimates (in thousands).<ref name="unpp" /><ref>[http://www.un.org/esa/population/publications/sixbillion/sixbillion.htm The World at Six Billion]</ref><ref name=autogenerated1 /> |
|||
! Population<br /><small>(in billions)</small> |
|||
! colspan=2 | 0.5 !! colspan=2 | 1 !! colspan=2 | 2 !! colspan=2 | 4 !! colspan=2 | 8 !! colspan=2 | 16 |
|||
|- |
|||
! Year |
! Year |
||
| colspan=2 | 1500 || colspan=2 | 1804 || colspan=2 | 1927 || colspan=2 | 1974 || colspan=2 | 2022 || colspan=2 | {{tooltip|n/a|World population is not expected to ever reach 16 billion according to current models.}} |
|||
! World |
|||
! Africa |
|||
! Asia |
|||
! Europe |
|||
! Latin America |
|||
! US and Canada |
|||
! Oceania |
|||
|- |
|- |
||
! Years elapsed |
|||
!style="text-align: right;" |2010 |
|||
| {{n/a}}|| colspan=2 | 304 || colspan=2 | 123 || colspan=2 | 47 || colspan=3 | 48 || {{n/a}} |
|||
|6,830,283 |
|||
|} |
|||
|984,225 (14.4%) |
|||
|4,148,948 (60.7%) |
|||
{| class="wikitable" style="text-align:center; display:inline-table;" |
|||
|719,714 (10.5%) |
|||
|+ Starting at 375 million |
|||
|594,436 (8.7%) |
|||
! Population<br /><small>(in billions)</small> |
|||
| 348,139 (5.1%) |
|||
! colspan=2 | 0.375 !! colspan=2 | 0.75 !! colspan=2 | 1.5 !! colspan=2 | 3 !! colspan=2 | 6 !! colspan=2 | 12 |
|||
| 34,821 (0.5%) |
|||
|- |
|- |
||
! Year |
|||
!style="text-align: right;" |2015 |
|||
| colspan=2 | 1171 || colspan=2 | 1715 || colspan=2 | 1881 || colspan=2 | 1960 || colspan=2 | 1999|| colspan=2 | {{circa|2100}}<ref>{{Cite web|url=https://www.science.org/content/article/no-way-stop-human-population-growth|title=No way to stop human population growth?|website=www.science.org}}</ref> |
|||
| 7,197,247 |
|||
| 1,084,540 (15.1%) |
|||
| 4,370,522 (60.7%) |
|||
| 713,402 (9.9%) |
|||
| 628,260 (8.7%) |
|||
| 363,953 (5.1%) |
|||
| 36,569 (0.5%) |
|||
|- |
|- |
||
! Years elapsed |
|||
!style="text-align: right;" |2020 |
|||
| {{n/a}}|| colspan=2 | 544 || colspan=2 | 166 || colspan=2 | 79 || colspan=3 | 39 || colspan=2 | {{circa|100+}} |
|||
| 7,540,237 |
|||
| 1,187,584 (15.7%) |
|||
| 4,570,131 (60.6%) |
|||
| 705,410 (9.4%) |
|||
| 659,248 (8.7%) |
|||
| 379,589 (5.0%) |
|||
| 38,275 (0.5%) |
|||
|- |
|||
!style="text-align: right;" |2025 |
|||
| 7,851,455 |
|||
| 1,292,085 (16.5%) |
|||
| 4,742,232 (60.4%) |
|||
| 696,036 (8.9%) |
|||
| 686,857 (8.7%) |
|||
| 394,312 (5.0%) |
|||
| 39,933 (0.5%) |
|||
|- |
|||
!style="text-align: right;" |2030 |
|||
| 8,130,149 |
|||
| 1,398,004 (17.2%) |
|||
| 4,886,647 (60.1%) |
|||
| 685,440 (8.4%) |
|||
| 711,058 (8.7%) |
|||
| 407,532 (5.0%) |
|||
| 41,468 (0.5%) |
|||
|- |
|||
!style="text-align: right;" |2035 |
|||
| 8,378,184 |
|||
| 1,504,179 (18.0%) |
|||
| 5,006,700 (59.8%) |
|||
| 673,638 (8.0%) |
|||
| 731,591 (8.7%) |
|||
| 419,273 (5.0%) |
|||
| 42,803 (0.5%) |
|||
|- |
|||
!style="text-align: right;" |2040 |
|||
| 8,593,591 |
|||
| 1,608,329 (18.7%) |
|||
| 5,103,021 (59.4%) |
|||
| 660,645 (8.0%) |
|||
| 747,953 (8.7%) |
|||
| 429,706 (5.0%) |
|||
| 43,938 (0.5%) |
|||
|- |
|||
!style="text-align: right;" |2045 |
|||
| 8,774,394 |
|||
| 1,708,407 (19.5%) |
|||
| 5,175,311 (59.0%) |
|||
| 646,630 (7.4%) |
|||
| 759,955 (8.7%) |
|||
| 439,163 (5.0%) |
|||
| 44,929 (0.5%) |
|||
|- |
|||
!style="text-align: right;" |2050 |
|||
| 8,918,724 |
|||
| 1,803,298 (20.2%) |
|||
| 5,217,202 (58.5%) |
|||
| 653,323 (7.3%) |
|||
| 767,685 (8.6%) |
|||
| 447,931 (5.0%) |
|||
| 45,815 (0.5%) |
|||
|} |
|} |
||
==Number of humans who have ever lived== |
|||
==Predictions based on population growth== |
|||
{{Further|Prehistoric demography}} |
|||
The total number of humans who have ever lived is estimated to be approximately [[1E11|100 billion]]. Such estimates can only be rough approximations, as even modern population estimates are subject to uncertainty of around 3% to 5%.<ref name=Kapitza2>"[E]ven recent demographic data is accurate only from 3 to 5%, although in demography traditionally more digits are indicated than those having a meaning. This is partially due to the ethical difficulty in rounding off numbers that supposedly represent real people, officially counted during a census". Sergei P. Kapitza, "The phenomenological theory of world population growth", ''Physics-Uspekhi'' 39(1) 57–71 (1996).</ref> Kapitsa (1996) cites estimates ranging between 80 and 150 billion.<ref>Sergei P. Kapitza, "The phenomenological theory of world population growth", ''Physics-Uspekhi'' 39(1) 57–71 (1996), citing K. M. Weiss, ''Human Biology'' 56637 (1984) and N. Keyfitz, ''Applied Mathematical Demography'' (New York: Wiley, 1977).</ref> The [[Population Reference Bureau|PRB]] puts the figure at 117 billion as of 2020, estimating that the current world population is 6.7% of all the humans who have ever lived.<ref>{{Cite web |title=How Many People Have Ever Lived on Earth? |url=https://www.prb.org/articles/how-many-people-have-ever-lived-on-earth/ |access-date=1 November 2021 |website=PRB |language=en-US}}</ref> Haub (1995) prepared another figure, updated in 2002 and 2011; the 2011 figure was approximately 107 billion.<ref name=Curtin2007>{{cite journal |last=Curtin |first=Ciara |publication-date=September 2007 |date=1 March 2007 |access-date=4 August 2008 |title=Fact or Fiction?: Living People Outnumber the Dead |periodical=Scientific American |publisher=Scientific American, Inc. |volume=297 |issue=3 |page=126 |url=http://www.sciam.com/article.cfm?id=fact-or-fiction-living-outnumber-dead |doi=10.1038/scientificamerican0907-126 |pmid=17784634 |bibcode=2007SciAm.297c.126C}} ''Note: text of paper publication slightly different from text of on-line publication''.</ref><ref name=Haub1995>{{Cite journal |last=Haub |first=Carl |date=November–December 2002 |title=How Many People Have Ever Lived on Earth? |journal=Population Today |publisher=[[Population Reference Bureau]] |volume=30 |issue=8 |pages=3–4 |url=http://www.prb.org/pdf/PT_novdec02.pdf |access-date=4 August 2008 |archive-url=https://web.archive.org/web/20110812104745/http://www.prb.org/pdf/PT_novdec02.pdf |archive-date=12 August 2011 |url-status=live}}</ref><ref name=Haub2011>{{Cite web |last=Haub |first=Carl |date=October 2011 |title=How Many People Have Ever Lived on Earth? |publisher=[[Population Reference Bureau]] |url=http://www.prb.org/Articles/2002/HowManyPeopleHaveEverLivedonEarth.aspx |access-date=29 April 2013 |archive-url=https://web.archive.org/web/20130424014209/http://www.prb.org/Articles/2002/HowManyPeopleHaveEverLivedonEarth.aspx |archive-date=24 April 2013 |url-status=dead}}</ref> Haub characterized this figure as an estimate that required "selecting population sizes for different points from antiquity to the present and applying assumed birth rates to each period".<ref name=Haub1995/> |
|||
Robust population data only exist for the last two or three centuries. Until the late 18th century, few governments had ever performed an accurate census. In many early attempts, such as in [[Census in Egypt|Ancient Egypt]] and the [[Achaemenid Empire|Persian Empire]], the focus was on counting merely a subset of the population for purposes of taxation or military service.<ref>Kuhrt, A. (1995). ''The Ancient Near East, c. 3000–330 BCE''. Vol. 2. London: Routledge. p. 695.</ref> Thus, there is a significant margin of error when estimating ancient global populations. |
|||
In 1798 [[Thomas Malthus]] incorrectly predicted that population growth would outrun food supply by the mid 19th century. In 1968, [[Paul R. Ehrlich]] reprised this argument in ''[[The Population Bomb]]'', predicting [[famine]] in the 1970s and 1980s. The dire predictions of Ehrlich and other [[Neo-malthusianism|neo-Malthusian]]s were vigorously challenged by a number of [[economist]]s, notably [[Julian Lincoln Simon]]. [[Agricultural research]], already under way such as the [[green revolution]], led to dramatic improvements in crop yields. Food production has kept pace with population growth, but Malthusians point out the green revolution relies heavily on [[petroleum]]-based [[fertilizer]]s, and that many crops have become so genetically uniform that a crop failure would be very widespread. Food prices in the early 21st century are rising sharply on a global scale, and causing serious malnutrition to spread widely.<ref>[http://news.bbc.co.uk/1/hi/in_depth/7361945.stm BBC NEWS | World | Assessing the global food crisis<!-- Bot generated title -->]</ref> |
|||
Pre-modern [[infant mortality]] rates are another critical factor for such an estimate; these rates are very difficult to estimate for ancient times due to a lack of accurate records. Haub (1995) estimates that around 40% of those who have ever lived did not survive beyond their first birthday. Haub also stated that "[[life expectancy at birth]] probably averaged only about ten years for most of human history",<ref name=Haub1995/> which is not to be mistaken for the life expectancy after reaching adulthood. The latter equally depended on period, location and social standing, but [[Life expectancy#Variation over time|calculations]] identify averages from roughly 30 years upward. |
|||
From 1950 to 1984, as the [[Green Revolution]] transformed [[agriculture]] around the world; grain production increased by 250%. The energy for the Green Revolution was provided by [[fossil fuels]] in the form of [[fertilizers]] (natural gas), [[pesticides]] (oil), and [[hydrocarbon]]-fueled [[irrigation]].<ref>[http://www.energybulletin.net/281.html Eating Fossil Fuels |EnergyBulletin.net]</ref> The peaking of world hydrocarbon production ([[Peak oil#Population|Peak oil]]) may test Malthus and Ehrlich critics.<ref>[http://www.soilassociation.org/peakoil Peak Oil: the threat to our food security]</ref><ref>[http://www.countercurrents.org/goodchild291007.htm Peak Oil And Famine:Four Billion Deaths]</ref> As of May 2008, the price of [[grain]] has been pushed up by increased farming for use in [[biofuel]]s,<ref>[http://www.sundayherald.com/news/heraldnews/display.var.2104849.0.2008_the_year_of_global_food_crisis.php 2008: The year of global food crisis]</ref> world [[oil prices]] at over $140 per barrel,<ref>[http://www.csmonitor.com/2008/0118/p08s01-comv.html The global grain bubble]</ref> global [[population growth]],<ref>[http://www.guardian.co.uk/science/2008/mar/07/scienceofclimatechange.food Food crisis will take hold before climate change, warns chief scientist]</ref> [[climate change]],<ref>[http://www.guardian.co.uk/environment/2007/nov/03/food.climatechange Global food crisis looms as climate change and fuel shortages bite]</ref> loss of [[agricultural]] land to residential and industrial development,<ref>[http://www.marketoracle.co.uk/Article3782.html Experts: Global Food Shortages Could ‘Continue for Decades']</ref><ref>[http://www.moyak.com/researcher/resume/papers/var13mkm.html Has Urbanization Caused a Loss to Agricultural Land?]</ref> and growing consumer demand in [[China]] and [[India]]<ref>[http://www.time.com/time/world/article/0,8599,1717572,00.html The World's Growing Food-Price Crisis]</ref><ref>[http://news.bbc.co.uk/1/hi/world/7284196.stm The cost of food: Facts and figures]</ref> [[2007–2008 world food price crisis|Food riot]]s have recently occurred in many countries across the world.<ref>[http://www.guardian.co.uk/world/2007/dec/04/china.business Riots and hunger feared as demand for grain sends food costs soaring]</ref><ref>[http://www.timesonline.co.uk/tol/news/environment/article3500975.ece Already we have riots, hoarding, panic: the sign of things to come?]</ref><ref>[http://www.guardian.co.uk/environment/2008/feb/26/food.unitednations Feed the world? We are fighting a losing battle, UN admits]</ref> |
|||
The [[National Institute of Corrections]] estimates that that the number of people who have ever lived will rise to 121 billion by 2050, 4 billion more than their 2021 estimate.<ref>{{Cite web |title=How Many People Have Ever Lived on Earth? |url=https://info.nicic.gov/ces/global/population-demographics/how-many-people-have-ever-lived-earth |access-date=4 March 2024 |website=National Institute of Corrections}}</ref> |
|||
The world population has grown by about four billion since the beginning of the Green Revolution and most believe that, without the Revolution, there would be greater [[famine]] and [[malnutrition]] than the UN presently documents (approximately 850 million people suffering from chronic malnutrition in 2005).<ref>[http://news.bbc.co.uk/2/hi/in_depth/6496585.stm The limits of a Green Revolution?]</ref> |
|||
==Human population as a function of food availability== |
|||
On the opposite end of the spectrum, a number of people argue that today's low [[fertility rate]]s in [[Europe]], [[North America]], [[Japan]] and [[Australia]], combined with mass [[immigration]], will have severe negative consequences for these countries.<ref>''The Death of the West: How Dying Populations and Immigrant Invasions Imperil Our Country and Civilization'' (ISBN 0-312-30259-3), by [[Patrick Buchanan]], ''The Empty Cradle: How Falling Birthrates Threaten World Prosperity'' (ISBN 0-465-05050-6), by Longman, and ''Fewer: How the New Demography of Depopulation Will Shape Our Future'' (ISBN 1-56663-606-X), by Wattenberg</ref> |
|||
Individuals from a wide range of academic fields and political backgrounds have proposed that, like all other animal populations, any [[human population]] (and, by extension, the world population) predictably grows and shrinks according to available food supply, growing during an abundance of food and shrinking in times of scarcity.<ref>Bystroff, Chistopher (2021). "Footprints to singularity: A global population model explains late 20th century slow-down and predicts peak within ten years". PLoS ONE 16(5): e0247214. {{doi|10.1371/journal.pone.0247214}}</ref> This idea may run counter to the popular thinking that, as population grows, food supply must also be increased to support the growing population; instead, the claim here is that growing population is the ''result'' of a growing food supply. Notable proponents of this notion include: [[agronomist]] and insect ecologist [[David Pimentel (scientist)|David Pimentel]],<ref name="Hopfenberg and Pimentel">Hopfenberg, Russell and Pimentel, David, "[http://www.bioinfo.rpi.edu/bystrc/pub/pimentel.pdf Human Population Numbers as a Function of Food Supply]", ''Environment, Development and Sustainability'', vol. 3, no. 1, March 2001, pp. 1–15</ref> behavioral scientist Russell Hopfenberg (the former two publishing a study on the topic in 2001),<ref>{{cite web|url=http://www.populationmedia.org/wp-content/uploads/2010/03/Human-Carrying-Capacity-is-Determined-by-Food-Availability.pdf|title=Human Carrying Capacity is Determined by Food Availability|work=Russel Hopfenberg, [[Duke University]]|access-date=2023-01-10|archive-date=2020-09-21|archive-url=https://web.archive.org/web/20200921005240/http://www.populationmedia.org/wp-content/uploads/2010/03/Human-Carrying-Capacity-is-Determined-by-Food-Availability.pdf|url-status=dead}}</ref> anthropologist and activist [[Virginia Abernethy]],<ref>Abernathy, Virginia, ''Population Politics'' {{ISBN|0-7658-0603-7}}</ref> ecologist [[Garrett Hardin]],<ref>{{cite journal | last1 = Hardin | first1 = Garrett | year = 1974 | title = Lifeboat Ethics: the Case Against Helping the Poor | journal = Psychology Today | volume = 8 | pages = 38–43| title-link = Lifeboat ethics }}</ref> science writer and anthropologist [[Peter Farb]], journalist [[Richard Manning]],<ref>{{cite interview |last=Manning |first=Richard |subject-link=Richard Manning |interviewer=Sally Erickson and Timothy Scott Bennett |title= Richard Manning on the Green Revolution and the End of Cheap Oil |date= 7 September 2011 |via= YouTube|accessdate=15 October 2013|url=https://www.youtube.com/watch?v=SbUnGIxbvTM}}</ref> environmental biologist Alan D. Thornhill,<ref>''Food Production & Population Growth'', video with Daniel Quinn and Alan Thornhill</ref> cultural critic and writer [[Daniel Quinn]],<ref>Quinn, Daniel, ''[[Ishmael (Quinn novel)|Ishmael]]'' Bantam/Turner, 1995, {{ISBN|0613080939}}</ref> and [[anarcho-primitivist]] [[John Zerzan]].<ref>{{cite speech|title=On Modernity and the Technosphere|first=John|last=Zerzan|location=Binghamton University|date=2 April 2008|url=https://www.youtube.com/watch?v=3I9QJVNas5k|at=See 38:35 to 39:00.}}</ref> |
|||
Scientists generally acknowledge that at least one significant factor contributing to population growth (or overpopulation) is that as agriculture advances in creating more food, the population consequently increases—the [[Neolithic Revolution]] and [[Green Revolution]] often specifically provided as examples of such agricultural breakthroughs.<ref name="Gilland">Gilland, Bernard (2006). "Population, nutrition and agriculture". ''Population and Environment'', 28(1), 1.</ref><ref>Bocquet-Appel, Jean-Pierre (2011). "When the world's population took off: the springboard of the Neolithic Demographic Transition". Science, 333(6042), 560–561.</ref><ref name="Li">{{Cite journal |last1=Li |first1=Xiaoqiang |last2=Dodson |first2=John |last3=Zhou |first3=Jie |last4=Zhou |first4=Xinying |date=1 June 2009 |title=Increases of population and expansion of rice agriculture in Asia, and anthropogenic methane emissions since 5000BP |url=https://www.sciencedirect.com/science/article/pii/S1040618208000360 |journal=Quaternary International |series=Great Arc of Human Dispersal |volume=202 |issue=1 |pages=41–50 |doi=10.1016/j.quaint.2008.02.009 |bibcode=2009QuInt.202...41L }}</ref><ref>{{cite journal | url=https://www.tandfonline.com/doi/abs/10.1080/10042857.2016.1149296 | doi=10.1080/10042857.2016.1149296 | title=Discussing why population growth is still ignored or denied | date=2016 | last1=Kopnina | first1=Helen | last2=Washington | first2=Haydn | journal=Chinese Journal of Population Resources and Environment | volume=14 | issue=2 | pages=133–143 | bibcode=2016CJPSE..14..133K | hdl=1887/44662 | hdl-access=free |url-status=live |archive-url=https://web.archive.org/web/20230104051415/https://www.tandfonline.com/doi/full/10.1080/10042857.2016.1149296 |archive-date= 4 January 2023 }}</ref><ref>"[https://www.euroscientist.com/what-causes-overpopulation/ What Causes Overpopulation?]" ''Euroscientist''. Euroscience: "When agriculture advances, and it becomes easier to feed the population, it continues to grow."</ref><ref name="NatGeo">"[https://education.nationalgeographic.org/resource/development-agriculture/ The Development of Agriculture]". ''National Geographic''. 2022.</ref> Furthermore, certain scientific studies do lend evidence to food availability in particular being the dominant factor within a more recent timeframe.<ref>Cohen, Joel E. (1995). Population growth and earth's human carrying capacity. Science, 269(5222), 341–346.</ref><ref>Fanta, V., Šálek, M., Zouhar, J., Sklenicka, P., & Storch, D. (2018). Equilibrium dynamics of European pre-industrial populations: the evidence of carrying capacity in human agricultural societies. Proceedings of the Royal Society B: Biological Sciences, 285(1871), 20172500.</ref><ref name="Hopfenberg and Pimentel"/> Other studies take it as a basic model from which to make broad population conjectures.<ref name="Gilland"/> The idea became [[taboo]] following the United Nations' 1994 [[International Conference on Population and Development]], where framing human population growth as negatively impacting the natural environment became regarded as "anti-human".<ref>Henderson, Kirsten, & Loreau, Michel (2019). "An ecological theory of changing human population dynamics". ''People and Nature'', 1(1), 32.</ref> |
|||
[[Child poverty]] has been linked to people having children before they have the means to care for them.<ref>[http://www.nzherald.co.nz/section/466/story.cfm?c_id=466&objectid=10429656 Population bomb still ticking away - 20 Mar 2007 - NZ Herald]</ref> More recently, some scholars have put forward the [[Doomsday argument]] applying [[Bayesian probability]] to world population to argue that the end of humanity will come sooner than we usually think.<ref>[http://dieoff.org/ DIE OFF - a population crash resource page]</ref> |
|||
Most human populations throughout history validate this theory, as does the overall current global population. Populations of [[hunter-gatherer]]s fluctuate in accordance with the amount of available food. The world human population began consistently and sharply to rise, and continues to do so, after sedentary agricultural lifestyles became common due to the Neolithic Revolution and its increased food supply.<ref>GJ Armelagos, AH Goodman, KH Jacobs Population and environment – 1991 link.springer.com</ref><ref name="Li"/><ref name="NatGeo"/> This was, subsequent to the Green Revolution starting in the 1940s, followed by even more severely accelerated population growth. Often, wealthier countries send their surplus food resources to the aid of starving communities; however, some proponents of this theory argue that this seemingly beneficial strategy only results in further harm to those communities in the long run. Anthropologist Peter Farb, for example, has commented on the paradox that "intensification of production to feed an increased population leads to a still greater increase in population."<ref>Farb, Peter: 1978, ''Humankind''. Boston, Houghton Mifflin.</ref> Environmental writer Daniel Quinn has also focused on this phenomenon, which he calls the "food race", coining a term he felt was comparable, in terms of both escalation and potential catastrophe, to the [[nuclear arms race]]. |
|||
==Number of humans who have ever lived== |
|||
During the 1970s it was popular to believe that 75% of all the people who had ever lived were alive in the 1970s, which would have put the total number of people to ever live as of the 1970s, as less than the current number of people alive today. This view was eventually debunked as a myth<ref>[http://www.prb.org/Articles/2002/HowManyPeopleHaveEverLivedonEarth.aspx Population Reference Bureau]</ref>. A more recent estimate of the total number of people who have ever lived was prepared by [[Carl Haub]] of the [[Population Reference Bureau]] in 1995 and subsequently updated in 2002; the updated figure was approximately 106 billion.<ref name=Curtin2007>{{Citation |
|||
|last=Curtin |first=Ciara |publication-date=September 2007 |date=2007-03-01 |accessdate=2008-08-04 |
|||
|title=Fact or Fiction?: Living People Outnumber the Dead |periodical=Scientific American |publisher=Scientific American, Inc. |
|||
|volume=297 |issue=3 |pages=126 |url=http://www.sciam.com/article.cfm?id=fact-or-fiction-living-outnumber-dead |
|||
}} ''Note: text of paper publication slightly different than text of on-line publication''</ref><ref name=Haub1995>{{Citation |
|||
|last=Haub |first=Carl |author-link=Carl Haub |date=November/December 2002 |title=How Many People Have Ever Lived on Earth? |
|||
|periodical=[[Population Today]] |publisher=[[Population Reference Bureau]] |volume=30 |issue=8 |pages=3–4 |
|||
|url=http://www.prb.org/pdf/PT_novdec02.pdf |accessdate=2008-08-04 |
|||
}}</ref> Haub characterized this figure as an estimate which required "selecting population sizes for different points from antiquity to the present and applying assumed birth rates to each period".<ref name=Haub1995/> Given an estimated global population of 6.2 billion in 2002, it could be inferred that about 6% of all people who had ever existed were alive in 2002.<ref name=Curtin2007/> |
|||
Criticism of this theory can come from multiple angles, for example by demonstrating that human population is not solely an effect of food availability, but that the situation is more complex. For instance, other relevant factors that can increase or limit human population include fresh water availability, arable land availability, energy consumed per person, heat removal, forest products, and various nonrenewable resources like fertilizers.<ref>Van Den Bergh, Jeroen, & Rietveld, Piet (2004). "Reconsidering the limits to world population: meta-analysis and meta-prediction". ''BioScience'', 54(3), 195–204.</ref> Another criticism is that, in the modern era, birth rates are lowest in the [[developed nation]]s, which also have the highest access to food. In fact, some developed countries have both a diminishing population and an abundant food supply. The United Nations projects that the population of 51 countries or areas, including Germany, Italy, Japan, and most of the states of the former Soviet Union, is expected to be lower in 2050 than in 2005.<ref>Rosa, Daniele (2019). "[http://www.affaritaliani.it/nel-2050-gli-italiani-saranno-20-milioni-meno-secondo-l-onu-612218.html Nel 2050 gli italiani saranno 20 milioni meno secondo l'Onu [Translation: ''In 2050 the Italians will be 20 million less, according to the UN'']]". ''Affaritaliani''. Uomini & Affari Srl.</ref> This shows that, limited to the scope of the population living within a single given political boundary, particular human populations do not always grow to match the available food supply. However, the global population as a whole still grows in accordance with the total food supply and many of these wealthier countries are major ''exporters'' of food to poorer populations, so that, according to Hopfenberg and Pimentel's 2001 research, "it is through exports from food-rich to food-poor areas... that the population growth in these food-poor areas is further fueled.<ref name="Hopfenberg and Pimentel"/> Their study thus suggests that human population growth is an [[positive feedback|exacerbating feedback loop]] in which food availability creates a growing population, which then causes the misimpression that food production must be consequently expanded even further.<ref>Salmony, Steven E. (2006). "The Human Population: Accepting Species Limits". Environmental Health Perspectives, 114(1), A 17. {{doi|10.1289/ehp.114-a17}}.</ref> |
|||
Other estimates of the total number of people who have ever lived range approximately from 45 billion to 125 billion, with the more robust of these falling in the 90–110 billion range.{{Fact|date=April 2008}}. It is difficult to estimate for the following reasons:{{Fact|date=August 2008}} |
|||
Regardless of criticisms against the theory that population is a function of food availability, the human population is, on the global scale, undeniably increasing,<ref>[[Daniel Quinn]] (1996). ''[[The Story of B]]'', pp. 304–305, Random House Publishing Group, {{ISBN|0553379011}}.</ref> as is the net quantity of human food produced—a pattern that has been true for roughly 10,000 years, since the human development of agriculture. The fact that some affluent countries demonstrate negative population growth fails to discredit the theory as a whole, since the world has become a [[globalization|globalized system]] with food moving across national borders from areas of abundance to areas of scarcity. Hopfenberg and Pimentel's 2001 findings support both this<ref name = "Hopfenberg and Pimentel"/> and Daniel Quinn's direct accusation, in the early 2010s, that "First World farmers are fueling the Third World population explosion".<ref>Quinn, Daniel: "The Question (ID Number 122)". Retrieved October 2014 from {{cite web|url=http://www.ishmael.org/Interaction/QandA/Detail.CFM?Record%3D122 |title=Archived copy |access-date=18 October 2014 |url-status=live |archive-url=https://web.archive.org/web/20160304064622/http://ishmael.org/interaction/qanda/detail.cfm?record=122 |archive-date=4 March 2016 }}.</ref> |
|||
*The set of specific characteristics which define a human being and distinguish early ''Homo sapiens'' from earlier or related species continues to be a subject of intense research and debate. It is thus not possible to know when to begin the count, nor which hominids to include. |
|||
==See also== |
|||
*Even if the scientific community reached wide consensus regarding which characteristics distinguished human beings, it would be nearly impossible to pinpoint the time of their first appearance to even the nearest millennium because the fossil record is simply too sparse. Only a few thousand fossils of early humans have been found, most no bigger than a tooth or a knucklebone. These bone fragments are used to extrapolate the population distribution of millions of early human beings spread across the continents. |
|||
{{Portal|World}} |
|||
{{Columns-list|colwidth=30em| |
|||
* [[Demographics of the world]] |
|||
* [[Anthropocene]] |
|||
* [[Birth control]] |
|||
* [[Coastal development hazards#Coastal population growth and development on coasts|Coastal population growth]] |
|||
* [[Demographic transition]] |
|||
* [[Doomsday argument]] |
|||
* [[Family planning]] |
|||
* [[Food security]] |
|||
* [[Human overpopulation]] |
|||
* [[Megacity]] |
|||
* [[Natalism]] |
|||
* [[One-child policy]] |
|||
* [[Population decline]] |
|||
* [[Population dynamics]] |
|||
* [[Population growth]] |
|||
* [[Two-child policy]] |
|||
'''Lists:''' |
|||
*Robust statistical data only exist for the last two or three centuries. Until the late 18th century, few nations, kingdoms, or [[Global Empire|empires]] had ever performed an accurate census. In many early attempts, the focus was on counting merely a subset of the people for purposes of taxation or military service {{Fact|date=April 2008}}. All estimates of population sizes preceding the 18th century are estimates, and thus the margin of error for the total number of humans who have ever lived should be in the billions, or even tens of billions of people. |
|||
* [[List of countries and dependencies by population]] |
|||
* [[List of countries by past and projected future population]] |
|||
* [[List of countries by population growth rate]] |
|||
* [[List of countries by population in 1900]] |
|||
* [[List of countries and dependencies by population density]] |
|||
* [[List of largest cities]] |
|||
* [[Lists of organisms by population]] – for non-human global populations |
|||
* [[List of population concern organizations]] |
|||
* [[List of religious populations]] |
|||
* [[List of sovereign states and dependencies by total fertility rate]] |
|||
'''Historical:''' |
|||
* [[Census#History of censuses|Historical censuses]] |
|||
* [[Historical demography]] |
|||
}} |
|||
== Explanatory notes == |
|||
==Further resources== |
|||
{{notelist}} |
|||
* There is a map that is rescaled in order to display every country according to its population size. It is available at the University of Sheffield 'Worldmapper'[http://www.worldmapper.org/imagemaps/imagemap2.html] site.<ref>[http://www.sasi.group.shef.ac.uk/worldmapper/display.php?selected=2], University of Sheffield 'Worldmapper' site</ref> |
|||
<references group="note" /> |
|||
* Population patterns and trends can be explored on the GeoHive interactive world atlas.<ref>[http://www.geohive.com/showcase/atlas.html Global Statistics interactive atlas], www.GeoHive.com</ref> |
|||
==References== |
==References== |
||
=== Citations === |
|||
<!-- ---------------------------------------------------------- |
|||
{{Reflist}} |
|||
See http://en.wikipedia.org/wiki/Wikipedia:Footnotes for a |
|||
discussion of different citation methods and how to generate |
|||
footnotes using the <ref>, </ref> and <reference /> tags |
|||
----------------------------------------------------------- --> |
|||
{{reflist|2}} |
|||
=== General and cited sources === |
|||
==See also== |
|||
{{ |
{{refbegin}} |
||
* {{CIA World Factbook}} |
|||
{{col-2}} |
|||
{{refend}} |
|||
*[[Birth control]] |
|||
*[[Depopulation]] |
|||
== Further reading == |
|||
*[[Doomsday argument]] |
|||
* {{cite book |last=Cohen |first=Joel E. |title=How Many People Can the Earth Support? |location=New York |publisher=W. W. Norton |date=1995 |isbn=978-0-393-31495-3}} |
|||
*[[End of civilization]] |
|||
* Guinnane, Timothy W. (2023). "[[doi:10.1017/S0022050723000293|We Do Not Know the Population of Every Country in the World for the Past Two Thousand Years]]". ''The Journal of Economic History'' 83(3): 912–938. {{issn|0022-0507}}. |
|||
*[[Family planning]] |
|||
* [https://web.archive.org/web/20150816232627/http://esa.un.org/unpd/wpp/index.htm "World Population Prospects, the 2010 Revision"]. [[United Nations Population Division]]. Retrieved 25 June 2013. |
|||
*[[Food security]] |
|||
* [https://web.archive.org/web/20150816232627/http://esa.un.org/unpd/wpp/index.htm "World Population Prospects, the 2012 Revision"]. [[United Nations Population Division]]. Retrieved 19 May 2014. |
|||
*[[Green Revolution]] |
|||
* [https://web.archive.org/web/20150816232627/http://esa.un.org/unpd/wpp/index.htm "World Population History Graph"] World population graph 10,000 BC – AD 1950. |
|||
*[[Life expectancy]] |
|||
* "[https://www.cia.gov/the-world-factbook/countries/world/ World]". ''[[The World Factbook]]''. US [[Central Intelligence Agency]] (CIA). Retrieved 6 November 2012. |
|||
*[[List of religious populations]] |
|||
* [https://www.pbs.org/wgbh/nova/transcripts/3108_worldbal.html "The World in Balance"] (transcript). Two-part PBS ''Nova'' episode on world population. 20 April 2004. Retrieved 19 July 2013. |
|||
*[[List of countries by population]] |
|||
* [https://www.economist.com/news/international/21579817-lot-more-people-faces-future "Global population: Faces of the future"]. ''The Economist''. 22 June 2013. Retrieved 25 June 2013. |
|||
*[[List of countries by population density]] |
|||
*Hopfenberg, Russell, and David Pimentel. "[https://dn790008.ca.archive.org/0/items/human-population-numbers-as-a-function-o/Human_population_numbers_as_a_function_o.pdf Human population numbers as a function of food supply]." Environment, development and sustainability 3 (2001): 1–15. |
|||
*[[List of countries by population growth rate]] |
|||
*[[List of countries by fertility rate]] |
|||
{{col-2}} |
|||
*[[Literacy]] (correlated with population growth) |
|||
*[[List of famines]] |
|||
*[[Medieval demography]] |
|||
*[[Megacity]] |
|||
*[[One child policy]] |
|||
*[[Overpopulation]] |
|||
*[[Per capita]] |
|||
*[[Population control]] |
|||
*[[Population growth]] |
|||
*[[Population Reference Bureau]] |
|||
*[[The Day of Six Billion]] |
|||
*[[World largest cities]] |
|||
*[[World population estimates]] |
|||
*[[2007–2008 world food price crisis]] |
|||
{{col-end}} |
|||
==External links== |
==External links== |
||
{{Commons category|World population statistics}} |
|||
* [http://esa.un.org/unpp/ World Population Prospects] ([[United Nations Population Division]]). |
|||
{{externalvideo|video1=[https://www.youtube.com/watch?v=mcqq8eAufXk Why Most Humans Live Inside This Small Circle -RealLifeLore]}} |
|||
* [http://www.digitalsurvivors.com/archives/worldpopulation.php Year-by-Year World Population Estimates: 10,000 B.C. to 2007 A.D.] |
|||
'''Organizations''' |
|||
* [http://www.ibiblio.org/lunarbin/worldpop World Population] |
|||
* [http://www.unfpa.org/press/six-billion-growing-population-and-sustainable-development-will-population-issues-undermine The Day of 6 Billion]{{cbignore|bot=medic}} and [https://web.archive.org/web/20130718121104/http://7billionactions.org/ 7 Billion] – Official homepages maintained by UNFPA |
|||
* [http://www.thepopulationproject.com The Population Project] |
|||
* [http://www. |
* [http://www.prb.org/ Population Reference Bureau] – News and issues related to population |
||
* [ |
* [https://www.berlin-institut.org/en/ Berlin Institute for Population and Development] |
||
* [http://www.unfpa.org/wpd/ World Population Day] United Nations: 11 July |
|||
* [http://www.unfpa.org/6billion/ The Day of 6 Billion] official homepage |
|||
* [http://esa.un.org/unpp/ World Population Prospects]. URL accessed on April 7, 2005. |
|||
* [http://www.counttheworld.com/?counter=pop_world World Population Counter] |
|||
* [http://base.google.com/base/a/1121639/D3593813974111928662 Trend of growth rate with total global population] |
|||
* [http://www.pbs.org/wgbh/nova/transcripts/3108_worldbal.html The World in Balance] Transcript of two-part PBS' Nova on World Population |
|||
* [[BBC]] (1999). ''[http://news.bbc.co.uk/2/hi/in_depth/472704.stm UN chief welcomes six billionth baby]''. URL accessed on March 7, 2005. |
|||
* [[Central Intelligence Agency]] (2004). ''[https://www.cia.gov/library/publications/the-world-factbook/geos/xx.html CIA The World Factbook 2004]''. URL accessed on February 13, 2005. |
|||
* [[United Nations]] (2001). ''[http://www.un.org/popin/ United Nations Population Information Network]''. URL accessed on February 13, 2005. |
|||
* [[United States Census Bureau]] (2004). ''[http://www.census.gov/ipc/www/worldhis.html Historical Estimates of World Population].'' URL accessed on February 13, 2005. |
|||
*PopulationData.net (2005). ''[http://www.populationdata.net PopulationData.net - Information and maps about populations around the world].'' |
|||
*GeoHive ''[http://www.geohive.com GeoHive.com - World Statistics including population and future predictions].'' |
|||
*Population Reference Bureau ''[http://www.prb.org www.prb.org - News and issues related to population].'' |
|||
*{{fr icon}} World Population Clock (2005). ''[http://www.populationmondiale.com/ WorldPopClock.com - World population clock].'' |
|||
*Population Counter. ''[http://rumkin.com/tools/population/ Real time counter.].'' |
|||
*[http://members.aol.com/bowermanb/population.html Population] Information on population, population growth, population problems, population statistics, and population figures. |
|||
*[http://www.sasi.group.shef.ac.uk/worldmapper/ World maps, including maps of population from Year 1 to Year 2300] |
|||
*[http://opr.princeton.edu/popclock/ Live World Population] |
|||
*[http://charts.jorgecamoes.com/how-to-create-an-excel-dashboard/ World Population from the US Census Bureau in an interactive Excel dashboard] |
|||
'''Statistics and maps''' |
|||
{{Population}} |
|||
* [http://www.hivegroup.com/gallery/worldpop/ HiveGroup.com – World population statistics presented in a treemap interface] |
|||
* [http://www.win.tue.nl/~speckman/Cartograms/WorldCarto.html Win.tue.nl – World countries mapped by population size] |
|||
'''Population clocks''' |
|||
* [https://www.census.gov/popclock/ U.S. and World Population Clock (US Census Bureau)] |
|||
[[Category:Demography]] |
|||
* [https://www.worldometers.info/world-population/ World Population Clock – Worldometer] |
|||
[[Category:Environmental science]] |
|||
{{Population}} |
|||
{{Navboxes |
|||
|title=Articles related to the world's population |
|||
|list= |
|||
{{Human impact on the environment}} |
|||
{{Population country lists}} |
|||
{{biological organisation}} |
|||
{{Globalization|state=autocollapse}} |
|||
}} |
|||
{{Authority control}} |
|||
{{DEFAULTSORT:World Population}} |
|||
[[ca:Població mundial]] |
|||
[[Category:World population| ]] |
|||
[[de:Weltbevölkerung]] |
|||
[[Category:Cultural globalization]] |
|||
[[es:Población humana]] |
|||
[[Category:Human overpopulation]] |
|||
[[fa:جمعیت جهان]] |
|||
[[fr:Population mondiale]] |
|||
[[ko:세계 인구]] |
|||
[[id:Populasi dunia]] |
|||
[[lt:Pasaulio gyventojai]] |
|||
[[mr:जागतिक लोकसंख्या]] |
|||
[[mn:Дэлхийн хүн ам]] |
|||
[[nl:Wereldbevolking]] |
|||
[[no:Verdens befolkning]] |
|||
[[ja:世界人口]] |
|||
[[pl:Ludność świata]] |
|||
[[pt:População mundial]] |
|||
[[ru:История населения Земли]] |
|||
[[sh:Svjetsko stanovništvo]] |
|||
[[fi:Maailman väkiluku]] |
|||
[[tr:Dünya nüfusu]] |
|||
[[zh:世界人口]] |
|||
Latest revision as of 05:08, 1 June 2024

In world demographics, the world population is the total number of humans currently living. It was estimated by the United Nations to have exceeded eight billion in mid-November 2022. It took around 300,000 years of human prehistory and history for the human population to reach a billion and only 218 years more to reach 8 billion.
The human population has experienced continuous growth following the Great Famine of 1315–1317 and the end of the Black Death in 1350, when it was nearly 370,000,000.[2] The highest global population growth rates, with increases of over 1.8% per year, occurred between 1955 and 1975, peaking at 2.1% between 1965 and 1970.[3] The growth rate declined to 1.1% between 2015 and 2020 and is projected to decline further in the 21st century.[4] The global population is still increasing, but there is significant uncertainty about its long-term trajectory due to changing fertility and mortality rates.[5] The UN Department of Economics and Social Affairs projects between 9 and 10 billion people by 2050 and gives an 80% confidence interval of 10–12 billion by the end of the 21st century,[1] with a growth rate by then of zero. Other demographers predict that the human population will begin to decline in the second half of the 21st century.[6]
The total number of births globally is currently (2015–2020) 140 million/year, which is projected to peak during the period 2040–2045 at 141 million/year and then decline slowly to 126 million/year by 2100.[7] The total number of deaths is currently 57 million/year and is projected to grow steadily to 121 million/year by 2100.[8]
The median age of human beings as of 2020[update] is 31 years.[9]
History

Estimates of world population by their nature are an aspect of modernity, possible only since the Age of Discovery. Early estimates for the population of the world[10] date to the 17th century: William Petty, in 1682, estimated the world population at 320 million (current estimates ranging close to twice this number); by the late 18th century, estimates ranged close to one billion (consistent with current estimates).[11] More refined estimates, broken down by continents, were published in the first half of the 19th century, at 600 million to 1 billion in the early 1800s and 800 million to 1 billion in the 1840s.[12]
It is difficult for estimates to be better than rough approximations, as even current population estimates are fraught with uncertainties from 3% to 5%.[13]
Ancient and post-classical history
Estimates of the population of the world at the time agriculture emerged in around 10,000 BC have ranged between 1 million and 15 million.[14][15] Even earlier, genetic evidence suggests humans may have gone through a population bottleneck of between 1,000 and 10,000 people about 70,000 BC, according to the now largely discredited Toba catastrophe theory. By contrast, it is estimated that around 50–60 million people lived in the combined eastern and western Roman Empire in the 4th century AD.[16]
The Plague of Justinian caused Europe's population to drop by around 50% between the 6th and 8th centuries AD.[17] The population of Europe was more than 70 million in 1340.[18] From 1340 to 1400, the world's population fell from an estimated 443 million to 350–375 million,[19] with the Indian subcontinent suffering the most tremendous loss and Europe suffering the Black Death pandemic;[20] it took 200 years for European population figures to recover.[21] The population of China decreased from 123 million in 1200 to 65 million in 1393,[22] presumably from a combination of Mongol invasions, famine, and plague.[23]
Starting in AD 2, the Han dynasty of ancient China kept consistent family registers to properly assess the poll taxes and labor service duties of each household.[24] In that year, the population of Western Han was recorded as 57,671,400 individuals in 12,366,470 households, decreasing to 47,566,772 individuals in 9,348,227 households by AD 146, towards the end of the Han dynasty.[24] From 200 to 400, the world population fell from an estimated 257 million to 206 million, with China suffering the greatest loss.[20] At the founding of the Ming dynasty in 1368, China's population was reported to be close to 60 million; toward the end of the dynasty in 1644, it may have approached 150 million.[25] England's population reached an estimated 5.6 million in 1650, up from an estimated 2.6 million in 1500.[26] New crops that were brought to Asia and Europe from the Americas by Portuguese and Spanish colonists in the 16th century are believed to have contributed to population growth.[27][28][29] Since their introduction to Africa by Portuguese traders in the 16th century,[30] maize and cassava have similarly replaced traditional African crops as the most important staple food crops grown on the continent.[31]
The pre-Columbian population of the Americas is uncertain; historian David Henige called it "the most unanswerable question in the world."[32] By the end of the 20th century, scholarly consensus favored an estimate of roughly 55 million people, but numbers from various sources have ranged from 10 million to 100 million.[33] Encounters between European explorers and populations in the rest of the world often introduced local epidemics of extraordinary virulence.[34] According to the most extreme scholarly claims, as many as 90% of the Native American population of the New World died of Old World diseases such as smallpox, measles, and influenza.[35] Over the centuries, the Europeans had developed high degrees of immunity to these diseases, while the indigenous peoples had no such immunity.[36]
Modern history

During the European Agricultural and Industrial Revolutions, the life expectancy of children increased dramatically.[39] The percentage of the children born in London who died before the age of five decreased from 74.5% in 1730–1749 to 31.8% in 1810–1829.[40][41] Between 1700 and 1900, Europe's population increased from about 100 million to over 400 million.[42] Altogether, the areas populated by people of European descent comprised 36% of the world's population in 1900.[43]
Population growth in the Western world became more rapid after the introduction of vaccination and other improvements in medicine and sanitation.[44] Improved material conditions led to the population of Britain increasing from 10 million to 40 million in the 19th century.[45] The population of the United Kingdom reached 60 million in 2006.[46] The United States saw its population grow from around 5.3 million in 1800 to 106 million in 1920, exceeding 307 million in 2010.[47]
The first half of the 20th century in Imperial Russia and the Soviet Union was marked by a succession of major wars, famines and other disasters which caused large-scale population losses (approximately 60 million excess deaths).[48][49] After the collapse of the Soviet Union, Russia's population declined significantly – from 150 million in 1991 to 143 million in 2012[50] – but by 2013 this decline appeared to have halted.[51]
Many countries in the developing world have experienced extremely rapid population growth since the early 20th century, due to economic development and improvements in public health. China's population rose from approximately 430 million in 1850 to 580 million in 1953,[52] and now stands at over 1.3 billion. The population of the Indian subcontinent, which was about 125 million in 1750, increased to 389 million in 1941;[53] today, India, Pakistan and Bangladesh are collectively home to about 1.63 billion people.[54] Java, an island in Indonesia, had about 5 million inhabitants in 1815; it had a population of over 139 million in 2020.[55] In just one hundred years, the population of Brazil decupled (x10), from about 17 million in 1900, or about 1% of the world population in that year, to about 176 million in 2000, or almost 3% of the global population in the very early 21st century. Mexico's population grew from 13.6 million in 1900 to about 112 million in 2010.[56][57] Between the 1920s and 2000s, Kenya's population grew from 2.9 million to 37 million.[58]
Milestones by the billions
| Population | 1 | 2 | 3 | 4 | 5 | 6 | 7 | 8 | 9 | 10 |
|---|---|---|---|---|---|---|---|---|---|---|
| Year | 1804 | 1927 | 1960 | 1974 | 1987 | 1999 | 2011 | 2022 | 2037 | 2057 |
| Years elapsed | 200,000+ | 123 | 33 | 14 | 13 | 12 | 12 | 11 | 15 | 20 |
The UN estimated that the world population reached one billion for the first time in 1804. It was another 123 years before it reached two billion in 1927, but it took only 33 years to reach three billion in 1960.[60] Thereafter, it took 14 years for the global population to reach four billion in 1974, 13 years to reach five billion in 1987, 12 years to reach six billion in 1999 and, according to the United States Census Bureau, 13 years to reach seven billion in March 2012.[61] The United Nations, however, estimated that the world population reached seven billion in October 2011.[62][63][64]
According to the UN, the global population reached eight billion in November 2022,[65] but because the growth rate is slowing, it will take another 15 years to reach around 9 billion by 2037 and 20 years to reach 10 billion by 2057.[66] Alternative scenarios for 2050 range from a low of 7.4 billion to a high of more than 10.6 billion.[67] Projected figures vary depending on underlying statistical assumptions and the variables used in projection calculations, especially the fertility and mortality variables. Long-range predictions to 2150 range from a population decline to 3.2 billion in the "low scenario", to "high scenarios" of 24.8 billion.[67] One extreme scenario predicted a massive increase to 256 billion by 2150, assuming the global fertility rate remained at its 1995 level of 3.04 children per woman; however, by 2010 the global fertility rate had declined to 2.52.[68][69]
There is no estimation for the exact day or month the world's population surpassed one or two billion. The points at which it reached three and four billion were not officially noted, but the International Database of the United States Census Bureau placed them in July 1959 and April 1974 respectively. The United Nations did determine, and commemorate, the "Day of 5 Billion" on 11 July 1987, and the "Day of 6 Billion" on 12 October 1999. The Population Division of the United Nations declared the "Day of Seven Billion" to be 31 October 2011.[70] The United Nations marked the birth of the eight billionth person on 15 November 2022.[71][65]
Global demographics

- >80
- 77.5–80
- 75–77.5
- 72.5–75
- 70–72.5
- 67.5–70
- 65–67.5
- 60–65
- 55–60
- 50–55
As of 2020, the global sex ratio is approximately 1.01 males to 1 female.[73] Approximately 24.7% of the global population is aged under 15, while 65.2% is aged 15–64 and 10.1% is aged 65 or over.[73] The median age of the world's population is estimated to be 31 years in 2020,[9] and is expected to rise to 37.9 years by 2050.[74]
According to the World Health Organization, the global average life expectancy is 73.3 years as of 2020, with women living an average of 75.9 years and men approximately 70.8 years.[75] In 2010, the global fertility rate was estimated at 2.44 children per woman.[76] In June 2012, British researchers calculated the total weight of Earth's human population as approximately 287 million tonnes (630 billion pounds), with the average person weighing around 62 kilograms (137 lb).[77]
The IMF estimated nominal 2021 gross world product at US$94.94 trillion, giving an annual global per capita figure of around US$12,290.[78] Around 9.3% of the world population live in extreme poverty, subsisting on less than US$1.9 per day;[79] around 8.9% are malnourished.[80] 87% of the world's over-15s are considered literate.[81] As of January 2024, there were about 5 billion global Internet users, constituting 66% of the world population.[82]
The Han Chinese are the world's largest single ethnic group, constituting over 19% of the global population in 2011.[83] The world's most-spoken languages[a] are English (1.132B), Mandarin Chinese (1.117B), Hindi (615M), Spanish (534M) and French (280M). More than three billion people speak an Indo-European language, which is the largest language family by number of speakers. Standard Arabic is a language with no native speakers, but the total number of speakers is estimated at 274 million people.[84]
The largest religious categories in the world as of 2020 are estimated as follows: Christianity (31%), Islam (25%), Unaffiliated (16%) and Hinduism (15%).[85]
Population by region
Six of the Earth's seven continents are permanently inhabited on a large scale. Asia is the most populous continent, with its 4.64 billion inhabitants accounting for 60% of the world population. The world's two most populated countries, India and China, together constitute about 36% of the world's population. Africa is the second most populated continent, with around 1.34 billion people, or 17% of the world's population. Europe's 747 million people make up 10% of the world's population as of 2020, while the Latin American and Caribbean regions are home to around 653 million (8%). Northern America, primarily consisting of the United States and Canada, has a population of around 368 million (5%), and Oceania, the least populated region, has about 42 million inhabitants (0.5%).[86] Antarctica only has a very small, fluctuating population of about 1200 people based mainly in polar science stations.[87]

| Region | 2022 (percent) | 2030 (percent) | 2050 (percent) |
|---|---|---|---|
| Sub-Saharan Africa | 1,152 (14.51%) | 1,401 (16.46%) | 2,094 (21.62%) |
| Northern Africa and Western Asia | 549 (6.91%) | 617 (7.25%) | 771 (7.96%) |
| Central Asia and Southern Asia | 2,075 (26.13%) | 2,248 (26.41%) | 2,575 (26.58%) |
| Eastern Asia and Southeastern Asia | 2,342 (29.49%) | 2,372 (27.87%) | 2,317 (23.92%) |
| Europe and Northern America | 1,120 (14.10%) | 1,129 (13.26%) | 1,125 (11.61%) |
| Latin America and the Caribbean | 658 (8.29%) | 695 (8.17%) | 749 (7.73%) |
| Australia and New Zealand | 31 (0.39%) | 34 (0.40%) | 38 (0.39%) |
| Oceania | 14 (0.18%) | 15 (0.18%) | 20 (0.21%) |
| World | 7,942 | 8,512 | 9,687 |
Graphs are unavailable due to technical issues. There is more info on Phabricator and on MediaWiki.org. |
| Region | Density (inhabitants/km2) |
Population (millions) |
Most populous country | Most populous city (metropolitan area) |
|---|---|---|---|---|
| Asia | 104.1 | 4,641 | 1,439,090,595 – |
13,515,000 – (37,400,000 – |
| Africa | 44.4 | 1,340 | 211,401,000 – |
9,500,000 – (20,076,000 – |
| Europe | 73.4 | 747 | 146,171,000 – |
13,200,000 – (20,004,000 – |
| Latin America | 24.1 | 653 | 214,103,000 – |
12,252,000 – (21,650,000 – |
| Northern America[note 1] | 14.9 | 368 | 332,909,000 – |
8,804,000 – (23,582,649 – |
| Oceania | 5 | 42 | 25,917,000 – |
5,367,000 – |
| Antarctica | ~0 | 0.004[87] | N/A[note 2] | 1,258 – |
Largest populations by country

.png)

Ten most populous countries
| Country / Dependency | Population | % of world |
Date | Source (official or from the United Nations) |
|---|---|---|---|---|
| 1,425,775,850 | 17.6% | 14 Apr 2023 | UN projection[90] | |
| 1,409,670,000 | 17.4% | 17 Jan 2024 | National annual estimate[91] | |
| 336,522,244 | 4.15% | 5 Jun 2024 | National population clock[92] | |
| 278,696,200 | 3.44% | 1 Jul 2023 | National annual estimate[93] | |
| 229,488,994 | 2.83% | 1 Jul 2022 | UN projection[94] | |
| 216,746,934 | 2.67% | 1 Jul 2022 | UN projection[94] | |
| 217,746,369 | 2.68% | 5 Jun 2024 | National population clock[95] | |
| 168,220,000 | 2.07% | 1 Jul 2020 | Annual Population Estimate[96] | |
| 147,190,000 | 1.81% | 1 Oct 2021 | 2021 preliminary census results[97] | |
| 128,271,248 | 1.58% | 31 Mar 2022 |
Approximately 4.6 billion people live in these ten countries, representing around 57% of the world's population as of July 2023.
The UN estimates that by 2023 India will have overtaken China in having the largest population.[98][90]
| # | Most populous countries | 2000 | 2015 | 2030[A] |
| ||
|---|---|---|---|---|---|---|---|
| 1 | 1,270 | 1,376 | 1,416 | ||||
| 2 | 1,053 | 1,311 | 1,528 | ||||
| 3 | 283 | 322 | 356 | ||||
| 4 | 212 | 258 | 295 | ||||
| 5 | 136 | 208 | 245 | ||||
| 6 | 176 | 206 | 228 | ||||
| 7 | 123 | 182 | 263 | ||||
| 8 | 131 | 161 | 186 | ||||
| 9 | 146 | 146 | 149 | ||||
| 10 | 103 | 127 | 148 | ||||
| World total | 6,127 | 7,349 | 8,501 | ||||
| Notes: | |||||||
Most densely populated countries
The tables below list the world's most densely populated countries, both in absolute terms and in comparison to their total populations, as of November 2022. All areas and populations are from The World Factbook, unless otherwise noted.
.jpg)
| Rank | Country | Population | Area (km2) |
Density (pop/km2) |
|---|---|---|---|---|
| 1 | 5,921,231 | 719 | 8,235 | |
| 2 | 165,650,475 | 148,460 | 1,116 | |
| 3 | 5,223,000 | 6,025 | 867 | |
| 4 | 23,580,712 | 35,980 | 655 | |
| 5 | 51,844,834 | 99,720 | 520 | |
| 6 | 5,296,814 | 10,400 | 509 | |
| 7 | 13,173,730 | 26,338 | 500 | |
| 8 | 12,696,478 | 27,830 | 456 | |
| 9 | 9,402,617 | 21,937 | 429 | |
| 10 | 1,389,637,446 | 3,287,263 | 423 |
| Rank | Country | Population | Area (km2) |
Density (pop/km2) |
Population trend[citation needed] |
|---|---|---|---|---|---|
| 1 | 1,389,637,446 | 3,287,263 | 423 | Growing | |
| 2 | 242,923,845 | 796,095 | 305 | Rapidly growing | |
| 3 | 165,650,475 | 148,460 | 1,116 | Growing | |
| 4 | 124,214,766 | 377,915 | 329 | Declining[102] | |
| 5 | 114,597,229 | 300,000 | 382 | Growing | |
| 6 | 103,808,319 | 331,210 | 313 | Growing | |
| 7 | 67,791,400 | 243,610 | 278 | Growing | |
| 8 | 51,844,834 | 99,720 | 520 | Steady | |
| 9 | 23,580,712 | 35,980 | 655 | Steady | |
| 10 | 23,187,516 | 65,610 | 353 | Growing |
Fluctuation
.svg)
Population size fluctuates at differing rates in differing regions. Nonetheless, population growth has been the long-standing trend on all inhabited continents, as well as in most individual states. During the 20th century, the global population saw its greatest increase in known history, rising from about 1.6 billion in 1900 to over 6 billion in 2000[103] as the whole world entered the early phases of what has come to be called the "demographic transition". Some of the key factors contributing to this increase included the lessening of the mortality rate in many countries by improved sanitation and medical advances, and a massive increase in agricultural productivity attributed to the Green Revolution.[104][105] By 2000, there were approximately ten times as many people on Earth as there had been in 1700.
However, this rapid growth did not last. During the period 2000–2005, the United Nations estimates that the world's population was growing at an annual rate of 1.3% (equivalent to around 80 million people), down from a peak of 2.1% during the period 1965–1970.[4] Globally, although the population growth rate has been steadily declining from its peak in 1968,[106] growth still remains high in Sub-Saharan Africa.[107]

_001.jpg)
In fact, during the 2010s, Japan and some countries in Europe began to reduce in population, due to sub-replacement fertility rates.[102]
In 2019, the United Nations reported that the rate of population growth continues to decline due to the ongoing global demographic transition. If this trend continues, the rate of growth may diminish to zero by 2100, concurrent with a world population plateau of 10.9 billion.[4][66] However, this is only one of many estimates published by the UN; in 2009, UN population projections for 2050 ranged between around 8 billion and 10.5 billion.[108] An alternative scenario is given by the statistician Jorgen Randers, who argues that traditional projections insufficiently take into account the downward impact of global urbanization on fertility. Randers' "most likely scenario" reveals a peak in the world population in the early 2040s at about 8.1 billion people, followed by decline.[109] Adrian Raftery, a University of Washington professor of statistics and of sociology, states that "there's a 70 percent probability the world population will not stabilize this century. Population, which had sort of fallen off the world's agenda, remains a very important issue."[110]
-
 Estimated world population figures, 10,000 BC – AD 2000
 -
 Estimated world population figures, 10,000 BC – AD 2000 (in log y scale)
 -
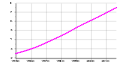 World population figures, 1950–2017

.png)

Annual population growth
Graphs are unavailable due to technical issues. There is more info on Phabricator and on MediaWiki.org. |
Graphs are unavailable due to technical issues. There is more info on Phabricator and on MediaWiki.org. |
| Year | Population | Yearly growth | Density (pop/km2) | |
|---|---|---|---|---|
| % | Number | |||
| 1951 | 2,543,130,380 | 1.75% | 43,808,223 | 17 |
| 1952 | 2,590,270,899 | 1.85% | 47,140,519 | 17 |
| 1953 | 2,640,278,797 | 1.93% | 50,007,898 | 18 |
| 1954 | 2,691,979,339 | 1.96% | 51,700,542 | 18 |
| 1955 | 2,746,072,141 | 2.01% | 54,092,802 | 18 |
| 1956 | 2,801,002,631 | 2.00% | 54,930,490 | 19 |
| 1957 | 2,857,866,857 | 2.03% | 56,864,226 | 19 |
| 1958 | 2,916,108,097 | 2.04% | 58,241,240 | 20 |
| 1959 | 2,970,292,188 | 1.86% | 54,184,091 | 20 |
| 1960 | 3,019,233,434 | 1.65% | 48,941,246 | 20 |
| 1961 | 3,068,370,609 | 1.63% | 49,137,175 | 21 |
| 1962 | 3,126,686,743 | 1.90% | 58,316,134 | 21 |
| 1963 | 3,195,779,247 | 2.21% | 69,092,504 | 21 |
| 1964 | 3,267,212,338 | 2.24% | 71,433,091 | 22 |
| 1965 | 3,337,111,983 | 2.14% | 69,899,645 | 22 |
| 1966 | 3,406,417,036 | 2.08% | 69,305,053 | 23 |
| 1967 | 3,475,448,166 | 2.03% | 69,031,130 | 23 |
| 1968 | 3,546,810,808 | 2.05% | 71,362,642 | 24 |
| 1969 | 3,620,655,275 | 2.08% | 73,844,467 | 24 |
| 1970 | 3,695,390,336 | 2.06% | 74,735,061 | 25 |
| 1971 | 3,770,163,092 | 2.02% | 74,772,756 | 25 |
| 1972 | 3,844,800,885 | 1.98% | 74,637,793 | 26 |
| 1973 | 3,920,251,504 | 1.96% | 75,450,619 | 26 |
| 1974 | 3,995,517,077 | 1.92% | 75,265,573 | 27 |
| 1975 | 4,069,437,231 | 1.85% | 73,920,154 | 27 |
| 1976 | 4,142,505,882 | 1.80% | 73,068,651 | 28 |
| 1977 | 4,215,772,490 | 1.77% | 73,266,608 | 28 |
| 1978 | 4,289,657,708 | 1.75% | 73,885,218 | 29 |
| 1979 | 4,365,582,871 | 1.77% | 75,925,163 | 29 |
| 1980 | 4,444,007,706 | 1.80% | 78,424,835 | 30 |
| 1981 | 4,524,627,658 | 1.81% | 80,619,952 | 30 |
| 1982 | 4,607,984,871 | 1.84% | 83,357,213 | 31 |
| 1983 | 4,691,884,238 | 1.82% | 83,899,367 | 32 |
| 1984 | 4,775,836,074 | 1.79% | 83,951,836 | 32 |
| 1985 | 4,861,730,613 | 1.80% | 85,894,539 | 33 |
| 1986 | 4,950,063,339 | 1.82% | 88,332,726 | 33 |
| 1987 | 5,040,984,495 | 1.84% | 90,921,156 | 34 |
| 1988 | 5,132,293,974 | 1.81% | 91,309,479 | 34 |
| 1989 | 5,223,704,308 | 1.78% | 91,410,334 | 35 |
| 1990 | 5,316,175,862 | 1.77% | 92,471,554 | 36 |
| 1991 | 5,406,245,867 | 1.69% | 90,070,005 | 36 |
| 1992 | 5,492,686,093 | 1.60% | 86,440,226 | 37 |
| 1993 | 5,577,433,523 | 1.54% | 84,747,430 | 37 |
| 1994 | 5,660,727,993 | 1.49% | 83,294,470 | 38 |
| 1995 | 5,743,219,454 | 1.46% | 82,491,461 | 39 |
| 1996 | 5,825,145,298 | 1.43% | 81,925,844 | 39 |
| 1997 | 5,906,481,261 | 1.40% | 81,335,963 | 40 |
| 1998 | 5,987,312,480 | 1.37% | 80,831,219 | 40 |
| 1999 | 6,067,758,458 | 1.34% | 80,445,978 | 41 |
| 2000 | 6,148,898,975 | 1.34% | 81,140,517 | 41 |
| 2001 | 6,230,746,982 | 1.33% | 81,848,007 | 42 |
| 2002 | 6,312,407,360 | 1.31% | 81,660,378 | 42 |
| 2003 | 6,393,898,365 | 1.29% | 81,491,005 | 43 |
| 2004 | 6,475,751,478 | 1.28% | 81,853,113 | 43 |
| 2005 | 6,558,176,119 | 1.27% | 82,424,641 | 44 |
| 2006 | 6,641,416,218 | 1.27% | 83,240,099 | 45 |
| 2007 | 6,725,948,544 | 1.27% | 84,532,326 | 45 |
| 2008 | 6,811,597,272 | 1.27% | 85,648,728 | 46 |
| 2009 | 6,898,305,908 | 1.27% | 86,708,636 | 46 |
| 2010 | 6,985,603,105 | 1.27% | 87,297,197 | 47 |
| 2011 | 7,073,125,425 | 1.25% | 87,522,320 | 47 |
| 2012 | 7,161,697,921 | 1.25% | 88,572,496 | 48 |
| 2013 | 7,250,593,370 | 1.24% | 88,895,449 | 49 |
| 2014 | 7,339,013,419 | 1.22% | 88,420,049 | 49 |
| 2015 | 7,426,597,537 | 1.19% | 87,584,118 | 50 |
| 2016 | 7,513,474,238 | 1.17% | 86,876,701 | 50 |
| 2017 | 7,599,822,404 | 1.15% | 86,348,166 | 51 |
| 2018 | 7,683,789,828 | 1.10% | 83,967,424 | 52 |
| 2019 | 7,764,951,032 | 1.06% | 81,161,204 | 52 |
| 2020 | 7,840,952,880 | 0.98% | 76,001,848 | 53 |
| 2021 | 7,909,295,151 | 0.87% | 68,342,271 | 53 |
| 2022 | 7,975,105,156 | 0.83% | 65,810,005 | 54 |
| 2023 | 8,045,311,447 | 0.88% | 70,206,291 | 54 |
Population growth by region
The table below shows historical and predicted regional population figures in millions.[112][113][114] The availability of historical population figures varies by region.
| Region | 1500 | 1600 | 1700 | 1750 | 1800 | 1850 | 1900 | 1950 | 1999 | 2008 | 2010 | 2012 | 2050 | 2150 |
|---|---|---|---|---|---|---|---|---|---|---|---|---|---|---|
| World | 585 | 660 | 710 | 791 | 978 | 1,262 | 1,650 | 2,521 | 6,008 | 6,707 | 6,896 | 7,052 | 9,725 | 9,746 |
| Africa | 86 | 114 | 106 | 106 | 107 | 111 | 133 | 221 | 783 | 973 | 1,022 | 1,052 | 2,478 | 2,308 |
| Asia | 282 | 350 | 411 | 502 | 635 | 809 | 947 | 1,402 | 3,700 | 4,054 | 4,164 | 4,250 | 5,267 | 5,561 |
| Europe | 168 | 170 | 178 | 190 | 203 | 276 | 408 | 547 | 675 | 732 | 738 | 740 | 734 | 517 |
| Latin America[Note 1] | 40 | 20 | 10 | 16 | 24 | 38 | 74 | 167 | 508 | 577 | 590 | 603 | 784 | 912 |
| Northern America[Note 1] | 6 | 3 | 2 | 2 | 7 | 26 | 82 | 172 | 312 | 337 | 345 | 351 | 433 | 398 |
| Oceania | 3 | 3 | 3 | 2 | 2 | 2 | 6 | 13 | 30 | 34 | 37 | 38 | 57 | 51 |
| Region | 1500 | 1600 | 1700 | 1750 | 1800 | 1850 | 1900 | 1950 | 1999 | 2008 | 2010 | 2012 | 2050 | 2150 |
|---|---|---|---|---|---|---|---|---|---|---|---|---|---|---|
| Africa | 14.7 | 17.3 | 14.9 | 13.4 | 10.9 | 8.8 | 8.1 | 8.8 | 13.0 | 14.5 | 14.8 | 15.2 | 25.5 | 23.7 |
| Asia | 48.2 | 53.0 | 57.9 | 63.5 | 64.9 | 64.1 | 57.4 | 55.6 | 61.6 | 60.4 | 60.4 | 60.3 | 54.2 | 57.1 |
| Europe | 28.7 | 25.8 | 25.1 | 20.6 | 20.8 | 21.9 | 24.7 | 21.7 | 11.2 | 10.9 | 10.7 | 10.5 | 7.6 | 5.3 |
| Latin America[Note 1] | 6.8 | 3.0 | 1.4 | 2.0 | 2.5 | 3.0 | 4.5 | 6.6 | 8.5 | 8.6 | 8.6 | 8.6 | 8.1 | 9.4 |
| Northern America[Note 1] | 1.0 | 0.5 | 0.3 | 0.3 | 0.7 | 2.1 | 5.0 | 6.8 | 5.2 | 5.0 | 5.0 | 5.0 | 4.5 | 4.1 |
| Oceania | 0.5 | 0.5 | 0.4 | 0.3 | 0.2 | 0.2 | 0.4 | 0.5 | 0.5 | 0.5 | 0.5 | 0.5 | 0.6 | 0.5 |
Past population
The following table gives estimates, in millions, of population in the past. The data for 1750 to 1900 are from the UN report "The World at Six Billion"[118] whereas the data from 1950 to 2015 are from a UN data sheet.[99]
| Year | World | Africa | Asia | Europe | Latin America & Carib.[Note 1] |
North America [Note 1] |
Oceania | Notes |
|---|---|---|---|---|---|---|---|---|
| 70,000 BC | < 0.015 | [119] | ||||||
| 10,000 BC | 4 | [120] | ||||||
| 8000 BC | 5 | |||||||
| 6500 BC | 5 | |||||||
| 5000 BC | 5 | |||||||
| 4000 BC | 7 | |||||||
| 3000 BC | 14 | |||||||
| 2000 BC | 27 | |||||||
| 1000 BC | 50 | 7 | 33 | 9 | [citation needed] | |||
| 500 BC | 100 | 14 | 66 | 16 | ||||
| AD 1 | 200 | 23 | 141 | 28 | ||||
| 1000 | 400 | 70 | 269 | 50 | 8 | 1 | 2 | |
| 1500 | 458 | 86 | 243 | 84 | 39 | 3 | 3 | |
| 1600 | 580 | 114 | 339 | 111 | 10 | 3 | 3 | |
| 1700 | 682 | 106 | 436 | 125 | 10 | 2 | 3 | |
| 1750 | 791 | 106 | 502 | 163 | 16 | 2 | 2 | |
| 1800 | 1,000 | 107 | 656 | 203 | 24 | 7 | 3 | |
| 1850 | 1,262 | 111 | 809 | 276 | 38 | 26 | 2 | |
| 1900 | 1,650 | 133 | 947 | 408 | 74 | 82 | 6 | |
| 1950 | 2,525 | 229 | 1,394 | 549 | 169 | 172 | 12.7 | [121] |
| 1955 | 2,758 | 254 | 1,534 | 577 | 193 | 187 | 14.2 | |
| 1960 | 3,018 | 285 | 1,687 | 606 | 221 | 204 | 15.8 | |
| 1965 | 3,322 | 322 | 1,875 | 635 | 254 | 219 | 17.5 | |
| 1970 | 3,682 | 366 | 2,120 | 657 | 288 | 231 | 19.7 | |
| 1975 | 4,061 | 416 | 2,378 | 677 | 326 | 242 | 21.5 | |
| 1980 | 4,440 | 478 | 2,626 | 694 | 365 | 254 | 23.0 | |
| 1985 | 4,853 | 550 | 2,897 | 708 | 406 | 267 | 24.9 | |
| 1990 | 5,310 | 632 | 3,202 | 721 | 447 | 281 | 27.0 | |
| 1995 | 5,735 | 720 | 3,475 | 728 | 487 | 296 | 29.1 | |
| 2000 | 6,127 | 814 | 3,714 | 726 | 527 | 314 | 31.1 | |
| 2005 | 6,520 | 920 | 3,945 | 729 | 564 | 329 | 33.4 | |
| 2010 | 6,930 | 1,044 | 4,170 | 735 | 600 | 344 | 36.4 | |
| 2015 | 7,349 | 1,186 | 4,393 | 738 | 634 | 358 | 39.3 |
Using the above figures, the change in population from 2010 to 2015 was:
- World: +420 million
- Africa: +142 million
- Asia: +223 million
- Europe: +3 million
- Latin America and Caribbean: +35 million
- Northern America: +14 million
- Oceania: +2.9 million
Projections
This section needs additional citations for verification. (April 2020) |
Long-term global population growth is difficult to predict. The United Nations and the US Census Bureau both give different estimates – according to the UN, the world population reached seven billion in late 2011,[112] while the USCB asserted that this occurred in March 2012.[122] Since 1951 the UN has issued multiple projections of future world population, based on different assumptions. From 2000 to 2005, the UN consistently revised these projections downward, until the 2006 revision, issued on 14 March 2007, revised the 2050 mid-range estimate upwards by 273 million.[citation needed]
Complicating the UN's and others' attempts to project future populations is the fact that average global birth rates, as well as mortality rates, are declining rapidly, as the nations of the world progress through the stages of the demographic transition, but both vary greatly between developed countries (where birth rates and mortality rates are often low) and developing countries (where birth and mortality rates typically remain high). Different ethnicities also display varying birth rates.[citation needed] Both of these can change rapidly due to disease epidemics, wars and other mass catastrophes, or advances in medicine and public health.
The UN's first report in 1951 showed that during the period 1950–55 the crude birth rate was 36.9/1,000 population and the crude death rate was 19.1/1,000. By the period 2015–20 both numbers had dropped significantly to 18.5/1,000 for the crude birth rate and 7.5/1,000 for the crude death rate. UN projections for 2100 show a further decline in the crude birth rate to 11.6/1,000 and an increase in the crude death rate to 11.2/1,000.[123],[124]
The total number of births globally is currently (2015–20) 140 million/year, is projected to peak during the period 2040–45 at 141 million/year and thereafter decline slowly to 126 million/year by 2100.[7] The total number of deaths is currently 57 million/year and is projected to grow steadily to 121 million/year by 2100.[8]
2012 United Nations projections show a continued increase in population in the near future with a steady decline in population growth rate; the global population is expected to reach between 8.3 and 10.9 billion by 2050.[125][126] 2003 UN Population Division population projections for the year 2150 range between 3.2 and 24.8 billion.[68] One of many independent mathematical models supports the lower estimate,[127] while a 2014 estimate forecasts between 9.3 and 12.6 billion in 2100, and continued growth thereafter.[128][129] The 2019 Revision of the UN estimates gives the "medium variant" population as; nearly 8.6 billion in 2030, about 9.7 billion in 2050 and about 10.9 billion in 2100.[130] In December 2019, the German Foundation for World Population projected that the global population will reach 8 billion by 2023 as it increases by 156 every minute.[131] In a modeled future projection by the Institute for Health Metrics and Evaluation the global population was projected to peak in 2064 at 9.73 billion people and decline to 8.79 billion in 2100.[132] Some analysts have questioned the sustainability of further world population growth, highlighting the growing pressures on the environment,[133][134] global food supplies, and energy resources.[135][136][137]
| Year | UN est. (millions) |
Difference | USCB est. (millions) |
Difference |
|---|---|---|---|---|
| 2005 | 6,542 | – | 6,473 | – |
| 2010 | 6,957 | 415 | 6,866 | 393 |
| 2015 | 7,380 | 423 | 7,256 | 390 |
| 2020 | 7,795 | 415 | 7,643 | 380 |
| 2025 | 8,184 | 390 | 8,007 | 363 |
| 2030 | 8,549 | 364 | 8,341 | 334 |
| 2035 | 8,888 | 339 | 8,646 | 306 |
| 2040 | 9,199 | 311 | 8,926 | 280 |
| 2045 | 9,482 | 283 | 9,180 | 254 |
| 2050 | 9,735 | 253 | 9,408 | 228 |
| Year | World | Asia | Africa | Europe | Latin America/Caribbean | Northern America | Oceania |
|---|---|---|---|---|---|---|---|
| 2000 | 6,144 | 3,741 (60.9%) | 811 (13.2%) | 726 (11.8%) | 522 (8.5%) | 312 (5.1%) | 31 (0.5%) |
| 2005 | 6,542 | 3,978 (60.8%) | 916 (14.0%) | 729 (11.2%) | 558 (8.5%) | 327 (5.0%) | 34 (0.5%) |
| 2010 | 6,957 | 4,210 (60.5%) | 1,039 (14.9%) | 736 (10.6%) | 591 (8.5%) | 343 (4.9%) | 37 (0.5%) |
| 2015 | 7,380 | 4,434 (60.1%) | 1,182 (16.0%) | 743 (10.1%) | 624 (8.5%) | 357 (4.8%) | 40 (0.5%) |
| 2020 | 7,795 | 4,641 (59.5%) | 1,341 (17.2%) | 748 (9.6%) | 654 (8.4%) | 369 (4.7%) | 43 (0.6%) |
| 2025 | 8,184 | 4,823 (58.9%) | 1,509 (18.4%) | 746 (9.1%) | 682 (8.3%) | 380 (4.6%) | 45 (0.6%) |
| 2030 | 8,549 | 4,974 (58.2%) | 1,688 (19.8%) | 741 (8.7%) | 706 (8.3%) | 391 (4.6%) | 48 (0.6%) |
| 2035 | 8,888 | 5,096 (57.3%) | 1,878 (21.1%) | 735 (8.3%) | 726 (8.2%) | 401 (4.5%) | 50 (0.6%) |
| 2040 | 9,199 | 5,189 (56.4%) | 2,077 (22.6%) | 728 (7.9%) | 742 (8.1%) | 410 (4.5%) | 53 (0.6%) |
| 2045 | 9,482 | 5,253 (55.4%) | 2,282 (24.1%) | 720 (7.6%) | 754 (8.0%) | 418 (4.4%) | 55 (0.6%) |
| 2050 | 9,735 | 5,290 (54.3%) | 2,489 (25.6%) | 711 (7.3%) | 762 (7.8%) | 425 (4.4%) | 57 (0.6%) |
| 2055 | 9,958 | 5,302 (53.2%) | 2,698 (27.1%) | 700 (7.0%) | 767 (7.7%) | 432 (4.3%) | 60 (0.6%) |
| 2060 | 10,152 | 5,289 (52.1%) | 2,905 (28.6%) | 689 (6.8%) | 768 (7.6%) | 439 (4.3%) | 62 (0.6%) |
| 2065 | 10,318 | 5,256 (51.0%) | 3,109 (30.1%) | 677 (6.6%) | 765 (7.4%) | 447 (4.3%) | 64 (0.6%) |
| 2070 | 10,459 | 5,207 (49.8%) | 3,308 (31.6%) | 667 (6.4%) | 759 (7.3%) | 454 (4.3%) | 66 (0.6%) |
| 2075 | 10,577 | 5,143 (48.6%) | 3,499 (33.1%) | 657 (6.2%) | 750 (7.1%) | 461 (4.4%) | 67 (0.6%) |
| 2080 | 10,674 | 5,068 (47.5%) | 3,681 (34.5%) | 650 (6.1%) | 739 (6.9%) | 468 (4.4%) | 69 (0.7%) |
| 2085 | 10,750 | 4,987 (46.4%) | 3,851 (35.8%) | 643 (6.0%) | 726 (6.8%) | 474 (4.4%) | 71 (0.7%) |
| 2090 | 10,810 | 4,901 (45.3%) | 4,008 (37.1%) | 638 (5.9%) | 711 (6.6%) | 479 (4.4%) | 72 (0.7%) |
| 2095 | 10,852 | 4,812 (44.3%) | 4,152 (38.3%) | 634 (5.8%) | 696 (6.4%) | 485 (4.5%) | 74 (0.7%) |
| 2100 | 10,875 | 4,719 (43.4%) | 4,280 (39.4%) | 630 (5.8%) | 680 (6.3%) | 491 (4.5%) | 75 (0.7%) |
Mathematical approximations
In 1975, Sebastian von Hoerner proposed a formula for population growth which represented hyperbolic growth with an infinite population in 2025.[140] The hyperbolic growth of the world population observed until the 1970s was later correlated to a non-linear second-order positive feedback between demographic growth and technological development. This feedback can be described as follows: technological advance → increase in the carrying capacity of land for people → demographic growth → more people → more potential inventors → acceleration of technological advance → accelerating growth of the carrying capacity → faster population growth → accelerating growth of the number of potential inventors → faster technological advance → hence, the faster growth of the Earth's carrying capacity for people, and so on.[141] The transition from hyperbolic growth to slower rates of growth is related to the demographic transition.
According to the Russian demographer Sergey Kapitsa,[142] the world population grew between 67,000 BC and 1965 according to the following formula:

where
- N is current population,
- T is the current year,
- C = (1.86 ± 0.01)·1011,
- T0 = 2007 ± 1,
- = 42 ± 1.

Years for world population to double
According to linear interpolation and extrapolation of UNDESA population estimates, the world population has doubled, or will double, in the years listed in the tables below (with two different starting points). During the 2nd millennium, each doubling took roughly half as long as the previous doubling, fitting the hyperbolic growth model mentioned above. However, after 2024, it is unlikely that there will be another doubling of the global population in the 21st century.[143]

| Population (in billions) |
0.5 | 1 | 2 | 4 | 8 | 16 | ||||||
|---|---|---|---|---|---|---|---|---|---|---|---|---|
| Year | 1500 | 1804 | 1927 | 1974 | 2022 | n/a | ||||||
| Years elapsed | — | 304 | 123 | 47 | 48 | — | ||||||
| Population (in billions) |
0.375 | 0.75 | 1.5 | 3 | 6 | 12 | ||||||
|---|---|---|---|---|---|---|---|---|---|---|---|---|
| Year | 1171 | 1715 | 1881 | 1960 | 1999 | c. 2100[144] | ||||||
| Years elapsed | — | 544 | 166 | 79 | 39 | c. 100+ | ||||||
Number of humans who have ever lived
The total number of humans who have ever lived is estimated to be approximately 100 billion. Such estimates can only be rough approximations, as even modern population estimates are subject to uncertainty of around 3% to 5%.[13] Kapitsa (1996) cites estimates ranging between 80 and 150 billion.[145] The PRB puts the figure at 117 billion as of 2020, estimating that the current world population is 6.7% of all the humans who have ever lived.[146] Haub (1995) prepared another figure, updated in 2002 and 2011; the 2011 figure was approximately 107 billion.[147][148][149] Haub characterized this figure as an estimate that required "selecting population sizes for different points from antiquity to the present and applying assumed birth rates to each period".[148]
Robust population data only exist for the last two or three centuries. Until the late 18th century, few governments had ever performed an accurate census. In many early attempts, such as in Ancient Egypt and the Persian Empire, the focus was on counting merely a subset of the population for purposes of taxation or military service.[150] Thus, there is a significant margin of error when estimating ancient global populations.
Pre-modern infant mortality rates are another critical factor for such an estimate; these rates are very difficult to estimate for ancient times due to a lack of accurate records. Haub (1995) estimates that around 40% of those who have ever lived did not survive beyond their first birthday. Haub also stated that "life expectancy at birth probably averaged only about ten years for most of human history",[148] which is not to be mistaken for the life expectancy after reaching adulthood. The latter equally depended on period, location and social standing, but calculations identify averages from roughly 30 years upward.
The National Institute of Corrections estimates that that the number of people who have ever lived will rise to 121 billion by 2050, 4 billion more than their 2021 estimate.[151]
Human population as a function of food availability
Individuals from a wide range of academic fields and political backgrounds have proposed that, like all other animal populations, any human population (and, by extension, the world population) predictably grows and shrinks according to available food supply, growing during an abundance of food and shrinking in times of scarcity.[152] This idea may run counter to the popular thinking that, as population grows, food supply must also be increased to support the growing population; instead, the claim here is that growing population is the result of a growing food supply. Notable proponents of this notion include: agronomist and insect ecologist David Pimentel,[153] behavioral scientist Russell Hopfenberg (the former two publishing a study on the topic in 2001),[154] anthropologist and activist Virginia Abernethy,[155] ecologist Garrett Hardin,[156] science writer and anthropologist Peter Farb, journalist Richard Manning,[157] environmental biologist Alan D. Thornhill,[158] cultural critic and writer Daniel Quinn,[159] and anarcho-primitivist John Zerzan.[160]
Scientists generally acknowledge that at least one significant factor contributing to population growth (or overpopulation) is that as agriculture advances in creating more food, the population consequently increases—the Neolithic Revolution and Green Revolution often specifically provided as examples of such agricultural breakthroughs.[161][162][163][164][165][166] Furthermore, certain scientific studies do lend evidence to food availability in particular being the dominant factor within a more recent timeframe.[167][168][153] Other studies take it as a basic model from which to make broad population conjectures.[161] The idea became taboo following the United Nations' 1994 International Conference on Population and Development, where framing human population growth as negatively impacting the natural environment became regarded as "anti-human".[169]
Most human populations throughout history validate this theory, as does the overall current global population. Populations of hunter-gatherers fluctuate in accordance with the amount of available food. The world human population began consistently and sharply to rise, and continues to do so, after sedentary agricultural lifestyles became common due to the Neolithic Revolution and its increased food supply.[170][163][166] This was, subsequent to the Green Revolution starting in the 1940s, followed by even more severely accelerated population growth. Often, wealthier countries send their surplus food resources to the aid of starving communities; however, some proponents of this theory argue that this seemingly beneficial strategy only results in further harm to those communities in the long run. Anthropologist Peter Farb, for example, has commented on the paradox that "intensification of production to feed an increased population leads to a still greater increase in population."[171] Environmental writer Daniel Quinn has also focused on this phenomenon, which he calls the "food race", coining a term he felt was comparable, in terms of both escalation and potential catastrophe, to the nuclear arms race.
Criticism of this theory can come from multiple angles, for example by demonstrating that human population is not solely an effect of food availability, but that the situation is more complex. For instance, other relevant factors that can increase or limit human population include fresh water availability, arable land availability, energy consumed per person, heat removal, forest products, and various nonrenewable resources like fertilizers.[172] Another criticism is that, in the modern era, birth rates are lowest in the developed nations, which also have the highest access to food. In fact, some developed countries have both a diminishing population and an abundant food supply. The United Nations projects that the population of 51 countries or areas, including Germany, Italy, Japan, and most of the states of the former Soviet Union, is expected to be lower in 2050 than in 2005.[173] This shows that, limited to the scope of the population living within a single given political boundary, particular human populations do not always grow to match the available food supply. However, the global population as a whole still grows in accordance with the total food supply and many of these wealthier countries are major exporters of food to poorer populations, so that, according to Hopfenberg and Pimentel's 2001 research, "it is through exports from food-rich to food-poor areas... that the population growth in these food-poor areas is further fueled.[153] Their study thus suggests that human population growth is an exacerbating feedback loop in which food availability creates a growing population, which then causes the misimpression that food production must be consequently expanded even further.[174]
Regardless of criticisms against the theory that population is a function of food availability, the human population is, on the global scale, undeniably increasing,[175] as is the net quantity of human food produced—a pattern that has been true for roughly 10,000 years, since the human development of agriculture. The fact that some affluent countries demonstrate negative population growth fails to discredit the theory as a whole, since the world has become a globalized system with food moving across national borders from areas of abundance to areas of scarcity. Hopfenberg and Pimentel's 2001 findings support both this[153] and Daniel Quinn's direct accusation, in the early 2010s, that "First World farmers are fueling the Third World population explosion".[176]
See also
- Demographics of the world
- Anthropocene
- Birth control
- Coastal population growth
- Demographic transition
- Doomsday argument
- Family planning
- Food security
- Human overpopulation
- Megacity
- Natalism
- One-child policy
- Population decline
- Population dynamics
- Population growth
- Two-child policy
Lists:
- List of countries and dependencies by population
- List of countries by past and projected future population
- List of countries by population growth rate
- List of countries by population in 1900
- List of countries and dependencies by population density
- List of largest cities
- Lists of organisms by population – for non-human global populations
- List of population concern organizations
- List of religious populations
- List of sovereign states and dependencies by total fertility rate
Historical:
Explanatory notes
- ^ This is by total speakers, not first-language or native speakers.
- ^ Excludes Mexico, Central America and the Caribbean, which are included here under Latin America.
- ^ The Antarctic Treaty System limits the nature of national claims in Antarctica. Of the territorial claims in Antarctica, the Ross Dependency has the largest population.
- ^ Has limited international recognition as a country. Area for the purposes of these calculations is that claimed, not controlled, by the State of Palestine.
- ^ Has limited international recognition as a country. Area for the purposes of these calculations is that controlled, not claimed, by Taiwan.
References
Citations
- ^ a b "World Population Prospects 2022, Graphs / Profiles". United Nations Department of Economic and Social Affairs, Population Division. 2022.
- ^ Jean-Noël Biraben (1980), "An Essay Concerning Mankind's Evolution". Population, Selected Papers. Vol. 4. pp. 1–13. Original paper in French:(b) Jean-Noël Biraben (1979)."Essai sur l'évolution du nombre des hommes". Population. Vol. 34 (no. 1). pp. 13–25.
- ^ "World Population Prospects". United Nations. Archived from the original on 19 September 2016. Retrieved 15 September 2016.
- ^ a b c "World Population Prospects, Standard Projections, Archive, 2019 Revision". United Nations Department of Economic and Social Affairs, Population Division. 2019.
- ^ Ortiz-Ospina, Esteban; Roser, Max (9 May 2013). "World Population Growth". Our World in Data. Archived from the original on 13 October 2016. Retrieved 13 October 2016.
- ^ Cave, Damien; Bubola, Emma; Sang-Hun, Choe (22 May 2021). "Long Slide Looms for World Population, With Sweeping Ramifications". The New York Times. ISSN 0362-4331. Archived from the original on 28 December 2021. Retrieved 23 May 2021.
- ^ a b "World Population Prospects 2019, Births file". United Nations Department of Economic and Social Affairs. 2019.
- ^ a b "World Population Prospects 2019, Deaths file". United Nations Department of Economic and Social Affairs. 2019.
- ^ a b "World", The World Factbook, Central Intelligence Agency, 19 October 2021, retrieved 1 November 2021
- ^ the compound "world population" becomes common from c. the 1930s, adapted from early 20th-century "world's population"; pre-20th century authors use "population of the world".
- ^ "The population of the world, which Sir W. P. in 1682, stated at only 320 millions, has been estimated by some writers at about 730 million, by others, at upwards of 900 million; Mr. Wallace, of Edinburgh, conjectured it might amount to 1 billion, and this number has since generally been adopted who have noticed the subject;" The Monthly Magazine 4 (July–December 1797), p. 167.
- ^ 600 million: Simon Gray, The Happiness of States (1818), p. 356 Archived 6 June 2019 at the Wayback Machine. 800 million: Gordon Hall, Samuel Newell, The Conversion of the World (1818), p. 10 Archived 6 June 2019 at the Wayback Machine. 800 to 1000 million: John Redman Coxe, Considerations Respecting the Recognition of Friends in Another World (1845), p. 21 (footnote with references).
- ^ a b "[E]ven recent demographic data is accurate only from 3 to 5%, although in demography traditionally more digits are indicated than those having a meaning. This is partially due to the ethical difficulty in rounding off numbers that supposedly represent real people, officially counted during a census". Sergei P. Kapitza, "The phenomenological theory of world population growth", Physics-Uspekhi 39(1) 57–71 (1996).
- ^ Luc-Normand Tellier (2009). Urban world history: an economic and geographical perspective. p. 26. ISBN 978-2-7605-1588-8.
- ^ Ralph Thomlinson, 1975, Demographic Problems: Controversy over population control, 2nd Ed., Dickenson Publishing Company, Ecino, CA, ISBN 0-8221-0166-1.
- ^ Dr. Kenneth W. Harl (1998). "Population estimates of the Roman Empire". Tulane.edu. Archived from the original on 7 May 2016. Retrieved 8 December 2012.
- ^ "Plague, Plague Information, Black Death Facts, News, Photos". National Geographic. Archived from the original on 22 July 2013. Retrieved 3 November 2008.
- ^ "History of Europe – Demographic and agricultural growth". Encyclopædia Britannica. 2012. Archived from the original on 20 December 2012. Retrieved 17 December 2012.
- ^ "Historical Estimates of World Population". Census.gov. Archived from the original on 9 July 2012. Retrieved 12 November 2016.
- ^ a b Biraben, Jean-Noël (1979). "Essai sur l'évolution du nombre des hommes". Population. 34 (1): 13–25. doi:10.2307/1531855. JSTOR 1531855. S2CID 143406315. Retrieved 11 February 2022.
- ^ Jay, Peter (17 July 2000). "A Distant Mirror". TIME Europe. 156 (3). Archived from the original on 25 July 2008. Retrieved 9 August 2014.
- ^ Horst R. Thieme (2003). Mathematics in population biology. Princeton University Press. p. 285. ISBN 978-0-691-09291-1.
- ^ Graziella Caselli; Gillaume Wunsch & Jacques Vallin (2005). Demography: Analysis and Synthesis, Four Volume Set: A Treatise in Population. Academic Press. p. 34. ISBN 978-0-12-765660-1.
- ^ a b Nishijima, Sadao (1986), "The economic and social history of Former Han", in Twitchett, Denis; Loewe, Michael, Cambridge History of China: Volume I: the Ch'in and Han Empires, 221 B.C. – A.D. 220, Cambridge: Cambridge University Press, pp 595–96.
- ^ "Qing China's Internal Crisis: Land Shortage, Famine, Rural Poverty". Columbia University: Asia for Educators. 2009. Archived from the original on 8 July 2011. Retrieved 9 July 2013.
- ^ "History of Europe – Demographics". Encyclopædia Britannica. Archived from the original on 23 July 2013. Retrieved 9 July 2013.
- ^ "China's Population: Readings and Maps". Columbia University: East Asian Curriculum Project. Archived from the original on 19 July 2011. Retrieved 18 December 2012.
- ^ "The Columbian Exchange". University of North Carolina. Archived from the original on 26 July 2011. Retrieved 18 December 2012.
- ^ Collingham, Lizzie (2006). Vindaloo: the Portuguese and the chilli pepper. Curry: A Tale of Cooks and Conquerors. Oxford: Oxford University Press. pp. 47–73. ISBN 978-0-19-988381-3.
- ^ "Super-Sized Cassava Plants May Help Fight Hunger in Africa". Ohio State University. 24 May 2006. Archived from the original on 8 December 2013. Retrieved 9 July 2013.
- ^ Brabazon, James (2000). Albert Schweitzer: a biography. Syracuse University Press. p. 242. ISBN 978-0-8156-0675-8.
- ^ "U.S. News & World Report: How many people were here before Columbus? Pick a number". 18 August 1997. Archived from the original on 5 March 2008. Retrieved 9 August 2019.
- ^ Snow, D. R (16 June 1995). "Microchronology and Demographic Evidence Relating to the Size of Pre-Columbian North American Indian Populations". Science. 268 (5217): 1601–1604. Bibcode:1995Sci...268.1601S. doi:10.1126/science.268.5217.1601. PMID 17754613. S2CID 8512954.
- ^ Arthur C. Aufderheide; Conrado Rodríguez-Martín & Odin Langsjoen (1998). The Cambridge encyclopedia of human paleopathology. Cambridge University Press. p. 205. ISBN 978-0-521-55203-5.
- ^ "The Story Of... Smallpox – and other Deadly Eurasian Germs". Public Broadcasting Service. 2005. Archived from the original on 29 January 2018. Retrieved 24 April 2013.
- ^ Austin Alchon, Suzanne (2003). A pest in the land: new world epidemics in a global perspective. University of New Mexico Press. p. 31. ISBN 978-0-8263-2871-7. Archived from the original on 18 May 2016. Retrieved 15 November 2015.
- ^ "World Demographics Profile 2012". Index Mundi. Archived from the original on 7 June 2012. Retrieved 22 May 2012.
- ^ "By 2050, 70% of the world's population will be urban. Is that a good thing?". Fast Co. Design. 2012. Archived from the original on 12 May 2012. Retrieved 1 May 2012.
- ^ Population crises and cycles in history – A review by Claire Russell and W.M.S. Russell, Vicnet.net.au, archived from the original on 5 April 2011, retrieved 26 March 2015
- ^ Buer, Mabel C. (1926). Health, Wealth and Population in the Early Days of the Industrial Revolution. London: George Routledge & Sons. p. 30. ISBN 978-0-415-38218-2.
- ^ "The Foundling Hospital". BBC History. 5 October 2012. Archived from the original on 17 June 2013. Retrieved 22 April 2013.
- ^ "Modernization – Population Change". Encyclopædia Britannica. Archived from the original on 6 April 2009. Retrieved 6 February 2013.
- ^ Graziella Caselli; Gillaume Wunsch & Jacques Vallin (2005). Demography: Analysis and Synthesis, Four Volume Set: A Treatise in Population. Academic Press. p. 42. ISBN 978-0-12-765660-1.
- ^ "Victorian Medicine – From Fluke to Theory". BBC History. 1 February 2002. Archived from the original on 5 March 2013. Retrieved 17 February 2013.
- ^ "A portrait of Britain in 2031". The Independent. 24 October 2007. Archived from the original on 9 December 2017. Retrieved 17 February 2013.
- ^ "UK population breaks through 60m". BBC News. 24 August 2006. Archived from the original on 8 February 2009. Retrieved 14 April 2012.
- ^ "US population through history". About.com. Archived from the original on 13 January 2012. Retrieved 14 April 2012.
- ^ Jay Winter, Emmanuel Sivan (2000). War and Remembrance in the Twentieth Century. Cambridge University Press. p. 64. ISBN 978-0521794367. Archived from the original on 4 September 2015. Retrieved 20 July 2015.
- ^ Mark Harrison (2002). Accounting for War: Soviet Production, Employment, and the Defence Burden, 1940–1945. Cambridge University Press. p. 167. ISBN 978-0-521-89424-1.
- ^ "Vladimir Putin vows to reverse Russian population decline". The Daily Telegraph. 13 February 2012. Archived from the original on 24 April 2012. Retrieved 13 April 2012.
- ^ "Russia's Population Decline Said To Have 'Stopped'". Radio Free Europe/Radio Liberty. 27 May 2013. Retrieved 15 June 2013.
- ^ Schran, Peter (1978). "China's demographic evolution 1850–1953 reconsidered". The China Quarterly. 75 (75): 639–646. doi:10.1017/S0305741000042594. JSTOR 652987. S2CID 154294204.
- ^ "Reintegrating India with the World Economy" (PDF). Peterson Institute for International Economics. 2003. Archived (PDF) from the original on 4 March 2012. Retrieved 8 November 2012.
- ^ "The World Factbook – Central Intelligence Agency". cia.gov. Archived from the original on 27 September 2011. Retrieved 8 January 2017.
- ^ "Java (island, Indonesia)". Encyclopædia Britannica. Archived from the original on 10 November 2022. Retrieved 16 November 2022.
- ^ Jorge Durand (March 2004). "From Traitors to Heroes: 100 Years of Mexican Migration Policies". University of Guadalajara. Archived from the original on 5 May 2011. Retrieved 16 July 2013.
- ^ "Population and Housing Census: Mexico 2010" (PDF). University of Minnesota. 3 March 2011. Archived (PDF) from the original on 3 November 2013. Retrieved 16 July 2013.
- ^ Heinsohn, Gunnar (7 January 2008). "Kenya's Violence: Exploding population". The New York Times. Archived from the original on 15 July 2014. Retrieved 7 July 2013.
- ^ Nations, United. "World population to reach 8 billion on 15 November 2022". United Nations. Retrieved 14 November 2022.
- ^ "The World at Six Billion: Introduction" (PDF). United Nations. 1999. Archived from the original (PDF) on 5 February 2016. Retrieved 14 July 2013.
- ^ "U.S. Census Bureau – World POPClock Projection". July 2013. Archived from the original on 18 November 2011. Retrieved 18 February 2018. The number on this page is automatically updated daily.
- ^ "Population seven billion: UN sets out challenges". BBC News. 26 October 2011. Archived from the original on 26 October 2011. Retrieved 27 October 2011.
- ^ Coleman, Jasmine (31 October 2011). "World's 'seven billionth baby' is born". The Guardian. London. Archived from the original on 30 September 2013. Retrieved 31 October 2011.
- ^ "7 billion people is a 'serious challenge". United Press International. 31 October 2011. Archived from the original on 3 November 2011. Retrieved 9 November 2011.
- ^ a b "World set to reach 8 billion people on 15 November 2022". United Nations Population Fund. Retrieved 8 October 2022.
- ^ a b "World Population Prospects 2019, Total Population – Both Sexes file, Medium Variant tab". United Nations Department of Economic and Social Affairs. 2019.
- ^ a b *"Ch. 5: Population Size and Composition" (PDF). World Population Prospects, the 2000 Revision. Vol. III. United Nations Population Division. p. 171. Retrieved 3 July 2010.
- "Executive Summary" (PDF). World Population Prospects: The 2002 Revision Volume III: Analytical Report. 2002. Retrieved 3 July 2010.
- "World Population to 2300" (PDF). New York: United Nations Department of Economic and Social Affairs: Population Division. 2004. pp. 3, 14. Archived (PDF) from the original on 19 September 2018. Retrieved 3 July 2010.
- "World Population: 1950–2050". United States Census Bureau. June 2010. Archived from the original on 5 October 2013. Retrieved 3 July 2010.
- "2009 World Population Data Sheet" (PDF). Washington, DC: Population Reference Bureau. 2009. Archived (PDF) from the original on 22 April 2010. Retrieved 3 July 2010.
- ^ a b "Key Findings" (PDF). Long-Range Population Projections. New York: United Nations: Department of Economic and Social Affairs. 2003. Retrieved 3 July 2010.
{{cite book}}:|work=ignored (help) - ^ "Total fertility estimates, 1950–2010". UN Population Division. April 2011. Archived from the original on 7 June 2012. Retrieved 14 June 2012.
- ^ "World Population Prospects, the 2008 Revision – Frequently Asked Questions". Population Division of the Department of Economic and Social Affairs of the United Nations Secretariat. 10 November 2010. Archived from the original on 24 February 2015. Retrieved 26 March 2015.
- ^ "World population to reach 8 billion this year, as growth rate slows" Archived 16 July 2022 at the Wayback Machine, UN News, 11 July 2022.
- ^ "World Health Statistics 2016: Monitoring health for the SDGs Annex B: tables of health statistics by country, WHO region and globally" (PDF). World Health Organization. 2016. p. 110. Archived (PDF) from the original on 17 May 2018. Retrieved 3 August 2018.
- ^ a b "World - The World Factbook". CIA World Fact Book. Central Intelligence Agency. 20 February 2024. Retrieved 24 February 2024.
- ^ Janneh, Abdoulie (April 2012). "General debate on national experience in population matters: adolescents and youth" (PDF). United Nations Economic Commission for Africa. Archived (PDF) from the original on 10 November 2013. Retrieved 19 February 2014.
- ^ "WHO, 2020 Life Expectancy". World Health Organization. Retrieved 27 July 2022.
- ^ "Children per woman". Our World in Data. Retrieved 1 November 2021.
- ^ "Global weight gain more damaging than rising numbers". BBC. 18 June 2012. Archived from the original on 4 February 2013. Retrieved 12 February 2013.
- ^ "World Economic Outlook (October 2021)". Imf.org. Retrieved 1 November 2021.
- ^ "Poverty headcount ratio at $1.90 a day (2011 PPP) (% of population) | Data". World Bank. Retrieved 1 November 2021.
- ^ Food and Agriculture Organization of the United Nations, The State of Food Insecurity in the World Archived 11 June 2014 at the Wayback Machine. WorldHunger.org. 2012. Retrieved 26 April 2012.
- ^ "Literacy Rate, Adult Total (% of people ages 15 and above)". The World Bank. September 2021.
- ^ "Number of internet and social media users worldwide as of January 2024". Statista. 31 January 2024. Archived from the original on 12 February 2024.
- ^ Chin, Josh (4 March 2011). "World's Most Typical Person: Han Chinese Man". Wall Street Journal. Archived from the original on 6 June 2019. Retrieved 18 November 2011.
- ^ Ghosh, Iman (15 February 2020). "Ranked: The 100 Most Spoken Languages Around the World". Visual Capitalist. Retrieved 1 November 2021.
- ^ "Religious Composition by Country, 2010–2050". Pew Research Center. 2 April 2015.
- ^ "Regions in the world by population (2020)". Retrieved 5 October 2020.
- ^ a b "Antarctica". The World Factbook. 19 June 2014. Retrieved 18 March 2015.
- ^ United Nations. Department of Economic and Social Affairs. World Population Prospects 2022. Summary of Results (PDF). New York.
- ^ "USA: Combined Metropolitan Areas". CityPopulation.de. August 2021. Retrieved 19 November 2021.
- ^ a b "Spotlight on family planning as India surpasses China as world's most populous country". france24.com. 14 April 2023. Retrieved 14 April 2023.
- ^ "2023年国民经济回升向好 高质量发展扎实推进" [Economy continues to recover in 2023, high-quality development progress steadily]. National Bureau of Statistics of China (in Chinese). Retrieved 17 January 2024.
- ^ "Population Clock". Census.gov. Archived from the original on 17 November 2015. Retrieved 18 April 2020.
- ^ "Mid Year Population (Thousand People)". Badan Pusat Statistik – Indonesia. Retrieved 22 November 2023.
- ^ a b "World Population Prospects 2019". United Nations.
- ^ "IBGE | Projeção da população". Ibge.gov.br. Archived from the original on 4 February 2020. Retrieved 22 November 2019.
- ^ "Monthly Statidtical Bulletin – Bangladesh" (PDF). 2022-05-12-10-42-55414488d843db66462b5410cb439c22.pdf. Bangladesh Bureau of Statistics. February 2022. Archived (PDF) from the original on 8 June 2022. Retrieved 8 June 2022.
- ^ Times, The Moscow (30 May 2022). "Russia Reports 147M Population in 2021". Moscow Times. Retrieved 2 June 2022.
- ^ "World Population Day: India will overtake China in 2023, says the UN". bbc.com. 11 July 2022. Retrieved 14 April 2023.
- ^ a b "World Population Prospects: The 2015 Revision". UN Population Division. Archived from the original on 22 December 2015. Retrieved 19 January 2016.. Linked to at Download Files, where it states that the figures are for 1 July of the given year.
- ^ a b "Countries – The World Factbook". cia.gov. Retrieved 15 November 2022.
- ^ "UNData app". United Nations. Retrieved 15 November 2022.
- ^ a b Demetriou, Danielle (17 April 2013). "Japan's population suffers biggest fall in history". The Daily Telegraph. London. Archived from the original on 21 May 2013. Retrieved 22 July 2013.
- ^ "World Population Clock (under World Pop Milestone section)". Worldometer. 2022.
- ^ "The limits of a Green Revolution?". BBC News. 29 March 2007. Archived from the original on 28 July 2011. Retrieved 1 August 2010.
- ^ "The Real Green Revolution". Energybulletin.net. Archived from the original on 22 April 2008. Retrieved 1 August 2010.
- ^ Roser, Max (18 June 2019). "Two centuries of rapid global population growth will come to an end". Our World in Data.
- ^ Ron Nielsen (2006). The Little Green Handbook. New York: Picador. ISBN 978-0-312-42581-4.
- ^ "UN population estimates and projections, database query, August 2009". United Nations. 11 March 2009. Archived from the original on 19 August 2010. Retrieved 1 August 2010.
- ^ Randers, Jorgen (2012). 2052: A Global Forecast for the Next Forty Years. Vermont: Chelsea Green Publishing. p. 62.
- ^ World population to keep growing this century, hit 11 billion by 2100 Archived 4 December 2016 at the Wayback Machine. UWToday. 18 September 2014
- ^ "World Population by Year". Worldometers.info. Retrieved 18 July 2023.
- ^ a b "World Population Prospects: The 2008 Revision" (PDF). Population Division of the Department of Economic and Social Affairs of the United Nations Secretariat. June 2009. Archived (PDF) from the original on 19 March 2013. Retrieved 20 June 2013.
- ^ "The World at Six Billion". United Nations. 12 October 1999. Archived from the original on 9 July 2013. Retrieved 1 August 2010.
- ^ "Population Growth over Human History". University of Michigan. 4 January 2006. Archived from the original on 24 July 2011. Retrieved 9 March 2013.
- ^ a b Figures include the former Soviet countries in Europe. Caselli, Graziella; Gillaume Wunsch; Jacques Vallin (20 December 2005). Demography: Analysis and Synthesis, Four Volume Set: A Treatise in Population. Academic Press. p. 42. ISBN 978-0-12-765660-1.
- ^ a b "UN report – 2004 data" (PDF). Archived from the original (PDF) on 5 February 2016. Retrieved 1 August 2010.
- ^ "World Population Prospects The 2015 Revision". Archived from the original (PDF) on 20 March 2014.
- ^ "The World at Six Billion". UN Population Division. Archived from the original on 5 March 2016., Table 2
- ^ Fewer than 15,000 individuals, according to the Toba catastrophe theory, though this theory has been criticized by some scientists. See: "Toba super-volcano catastrophe idea "dismissed"". BBC News. 30 April 2013. Archived from the original on 7 January 2015. Retrieved 21 March 2015.
- ^ An approximation based on figures from different sources as listed at the US Census Bureau's Historical Estimates of World Population Archived 2 May 2019 at the Wayback Machine; see also *Kremer, Michael (1993). "Population Growth and Technological Change: One Million B.C. to 1990". The Quarterly Journal of Economics. 108 (3): 681–716. doi:10.2307/2118405. JSTOR 2118405.
- ^ An approximation based on figures from different sources as listed at the US Census Bureau's Total Midyear Population for the World: 1950–2050 Archived 21 May 2017 at the Wayback Machine
- ^ "Notes on the World POPClock and World Vital Events". US Census Bureau. Archived from the original on 2 October 2013. Retrieved 12 February 2013.
- ^ "World Population Prospects 2019, Crude Birth Rate file". United Nations Department of Economic and Social Affairs. 2019.
- ^ "World Population Prospects 2019, Crude Death Rate file". United Nations Department of Economic and Social Affairs. 2019.
- ^ "World Population Prospects, the 2012 Revision – "Low variant" and "High variant" values". UN. 2012. Archived from the original on 1 July 2014. Retrieved 15 June 2013.
- ^ "World population projected to reach 9.6 billion by 2050 – UN report". UN News Centre. 14 June 2013. Archived from the original on 23 August 2013. Retrieved 16 June 2013.
- ^ "A model predicts that the world's populations will stop growing in 2050". ScienceDaily.com. 4 April 2013. Archived from the original on 2 January 2020. Retrieved 3 June 2013.
- ^ Carrington, Damien (18 September 2014). "World population to hit 12bn in 2100 – with 70% chance of continuous rise". The Guardian. Archived from the original on 20 September 2014. Retrieved 21 September 2014.
- ^ Gerland, P.; Raftery, A. E.; Ev Ikova, H.; Li, N.; Gu, D.; Spoorenberg, T.; Alkema, L.; Fosdick, B. K.; Chunn, J.; Lalic, N.; Bay, G.; Buettner, T.; Heilig, G. K.; Wilmoth, J. (14 September 2014). "World population stabilization unlikely this century". Science. 346 (6206). AAAS: 234–7. Bibcode:2014Sci...346..234G. doi:10.1126/science.1257469. ISSN 1095-9203. PMC 4230924. PMID 25301627.
- ^ "World Population Prospects 2019: Highlights" (PDF). Archived (PDF) from the original on 3 July 2019. Retrieved 8 July 2019.
- ^ Silk, John (21 December 2019). "World's population to hit 7.75 billion in 2019". Deutsche Welle. Retrieved 17 July 2020.
- ^ "World population in 2100 could be 2 billion below UN forecasts, study suggests". The Guardian. 15 July 2020. Retrieved 15 July 2020.
- ^ Stokstad, Erik (5 May 2019). "Landmark analysis documents the alarming global decline of nature". Science. AAAS. Retrieved 19 July 2020.
Driving these threats are the growing human population, which has doubled since 1970 to 7.6 billion, and consumption. (Per capita of use of materials is up 15% over the past 5 decades.)
- ^ Crist, Eileen; Ripple, William J.; Ehrlich, Paul R.; Rees, William E.; Wolf, Christopher (2022). "Scientists' warning on population" (PDF). Science of the Total Environment. 845: 157166. Bibcode:2022ScTEn.845o7166C. doi:10.1016/j.scitotenv.2022.157166. PMID 35803428. S2CID 250387801.
- ^ Peter P. Rogers; Kazi F. Jalal & John A. Boyd (2008). An Introduction To Sustainable Development. Earthscan. p. 53. ISBN 978-1849770477.
- ^ "Overpopulation's Real Victim Will Be the Environment". Time. 26 October 2011. Archived from the original on 18 February 2013. Retrieved 18 February 2013.
- ^ Zehner, Ozzie (2012). Green Illusions. Lincoln and London: University of Nebraska Press. pp. 187–331. Archived from the original on 29 November 2019. Retrieved 10 April 2020.
- ^ a b "World Population Prospects: The 2019 Revision" (XLS). Population Division of the Department of Economic and Social Affairs of the United Nations Secretariat. June 2019. Retrieved 8 July 2019.
- ^ "World Population – Total Midyear Population for the World: 1950–2050". Census.gov. July 2015. Archived from the original on 21 May 2017. Retrieved 7 March 2016.
- ^ Sebastien von Hoerner (1975). "Population Explosion and Interstellar Expansion". Journal of the British Interplanetary Society. 28 (28): 691–712. Bibcode:1975JBIS...28..691V.
- ^ Introduction to Social Macrodynamics. Archived 10 February 2012 at the Wayback Machine. Andrey Korotayev et al. For a rigorous mathematical analysis of this issue, see "A Compact Mathematical Model of the World System Economic and Demographic Growth, 1 CE – 1973 CE". Archived 17 February 2019 at the Wayback Machine.
- ^ Kapitsa, Sergei P. (1996). "The phenomenological theory of world population growth". Physics-Uspekhi. 39 (1): 57–71. Bibcode:1996PhyU...39...57K. doi:10.1070/pu1996v039n01abeh000127. S2CID 250877833. Archived from the original on 11 May 2009. Retrieved 26 July 2013.
- ^ Lutz, Wolfgang; Sanderson, Warren; Scherbov, Sergei (19 June 1997). "Doubling of world population unlikely" (PDF). Nature. 387 (6635): 803–805. Bibcode:1997Natur.387..803L. doi:10.1038/42935. PMID 9194559. S2CID 4306159.
- ^ "No way to stop human population growth?". www.science.org.
- ^ Sergei P. Kapitza, "The phenomenological theory of world population growth", Physics-Uspekhi 39(1) 57–71 (1996), citing K. M. Weiss, Human Biology 56637 (1984) and N. Keyfitz, Applied Mathematical Demography (New York: Wiley, 1977).
- ^ "How Many People Have Ever Lived on Earth?". PRB. Retrieved 1 November 2021.
- ^ Curtin, Ciara (1 March 2007). "Fact or Fiction?: Living People Outnumber the Dead". Scientific American. 297 (3). Scientific American, Inc. (published September 2007): 126. Bibcode:2007SciAm.297c.126C. doi:10.1038/scientificamerican0907-126. PMID 17784634. Retrieved 4 August 2008. Note: text of paper publication slightly different from text of on-line publication.
- ^ a b c Haub, Carl (November–December 2002). "How Many People Have Ever Lived on Earth?" (PDF). Population Today. 30 (8). Population Reference Bureau: 3–4. Archived (PDF) from the original on 12 August 2011. Retrieved 4 August 2008.
- ^ Haub, Carl (October 2011). "How Many People Have Ever Lived on Earth?". Population Reference Bureau. Archived from the original on 24 April 2013. Retrieved 29 April 2013.
- ^ Kuhrt, A. (1995). The Ancient Near East, c. 3000–330 BCE. Vol. 2. London: Routledge. p. 695.
- ^ "How Many People Have Ever Lived on Earth?". National Institute of Corrections. Retrieved 4 March 2024.
- ^ Bystroff, Chistopher (2021). "Footprints to singularity: A global population model explains late 20th century slow-down and predicts peak within ten years". PLoS ONE 16(5): e0247214. doi:10.1371/journal.pone.0247214
- ^ a b c d Hopfenberg, Russell and Pimentel, David, "Human Population Numbers as a Function of Food Supply", Environment, Development and Sustainability, vol. 3, no. 1, March 2001, pp. 1–15
- ^ "Human Carrying Capacity is Determined by Food Availability" (PDF). Russel Hopfenberg, Duke University. Archived from the original (PDF) on 21 September 2020. Retrieved 10 January 2023.
- ^ Abernathy, Virginia, Population Politics ISBN 0-7658-0603-7
- ^ Hardin, Garrett (1974). "Lifeboat Ethics: the Case Against Helping the Poor". Psychology Today. 8: 38–43.
- ^ Manning, Richard (7 September 2011). "Richard Manning on the Green Revolution and the End of Cheap Oil" (Interview). Interviewed by Sally Erickson and Timothy Scott Bennett. Retrieved 15 October 2013 – via YouTube.
- ^ Food Production & Population Growth, video with Daniel Quinn and Alan Thornhill
- ^ Quinn, Daniel, Ishmael Bantam/Turner, 1995, ISBN 0613080939
- ^ Zerzan, John (2 April 2008). On Modernity and the Technosphere (Speech). Binghamton University.
- ^ a b Gilland, Bernard (2006). "Population, nutrition and agriculture". Population and Environment, 28(1), 1.
- ^ Bocquet-Appel, Jean-Pierre (2011). "When the world's population took off: the springboard of the Neolithic Demographic Transition". Science, 333(6042), 560–561.
- ^ a b Li, Xiaoqiang; Dodson, John; Zhou, Jie; Zhou, Xinying (1 June 2009). "Increases of population and expansion of rice agriculture in Asia, and anthropogenic methane emissions since 5000BP". Quaternary International. Great Arc of Human Dispersal. 202 (1): 41–50. Bibcode:2009QuInt.202...41L. doi:10.1016/j.quaint.2008.02.009.
- ^ Kopnina, Helen; Washington, Haydn (2016). "Discussing why population growth is still ignored or denied". Chinese Journal of Population Resources and Environment. 14 (2): 133–143. Bibcode:2016CJPSE..14..133K. doi:10.1080/10042857.2016.1149296. hdl:1887/44662. Archived from the original on 4 January 2023.
- ^ "What Causes Overpopulation?" Euroscientist. Euroscience: "When agriculture advances, and it becomes easier to feed the population, it continues to grow."
- ^ a b "The Development of Agriculture". National Geographic. 2022.
- ^ Cohen, Joel E. (1995). Population growth and earth's human carrying capacity. Science, 269(5222), 341–346.
- ^ Fanta, V., Šálek, M., Zouhar, J., Sklenicka, P., & Storch, D. (2018). Equilibrium dynamics of European pre-industrial populations: the evidence of carrying capacity in human agricultural societies. Proceedings of the Royal Society B: Biological Sciences, 285(1871), 20172500.
- ^ Henderson, Kirsten, & Loreau, Michel (2019). "An ecological theory of changing human population dynamics". People and Nature, 1(1), 32.
- ^ GJ Armelagos, AH Goodman, KH Jacobs Population and environment – 1991 link.springer.com
- ^ Farb, Peter: 1978, Humankind. Boston, Houghton Mifflin.
- ^ Van Den Bergh, Jeroen, & Rietveld, Piet (2004). "Reconsidering the limits to world population: meta-analysis and meta-prediction". BioScience, 54(3), 195–204.
- ^ Rosa, Daniele (2019). "Nel 2050 gli italiani saranno 20 milioni meno secondo l'Onu [Translation: In 2050 the Italians will be 20 million less, according to the UN]". Affaritaliani. Uomini & Affari Srl.
- ^ Salmony, Steven E. (2006). "The Human Population: Accepting Species Limits". Environmental Health Perspectives, 114(1), A 17. doi:10.1289/ehp.114-a17.
- ^ Daniel Quinn (1996). The Story of B, pp. 304–305, Random House Publishing Group, ISBN 0553379011.
- ^ Quinn, Daniel: "The Question (ID Number 122)". Retrieved October 2014 from "Archived copy". Archived from the original on 4 March 2016. Retrieved 18 October 2014.
{{cite web}}: CS1 maint: archived copy as title (link).
General and cited sources
 This article incorporates public domain material from The World Factbook. CIA.
Further reading
- Cohen, Joel E. (1995). How Many People Can the Earth Support?. New York: W. W. Norton. ISBN 978-0-393-31495-3.
- Guinnane, Timothy W. (2023). "We Do Not Know the Population of Every Country in the World for the Past Two Thousand Years". The Journal of Economic History 83(3): 912–938. ISSN 0022-0507.
- "World Population Prospects, the 2010 Revision". United Nations Population Division. Retrieved 25 June 2013.
- "World Population Prospects, the 2012 Revision". United Nations Population Division. Retrieved 19 May 2014.
- "World Population History Graph" World population graph 10,000 BC – AD 1950.
- "World". The World Factbook. US Central Intelligence Agency (CIA). Retrieved 6 November 2012.
- "The World in Balance" (transcript). Two-part PBS Nova episode on world population. 20 April 2004. Retrieved 19 July 2013.
- "Global population: Faces of the future". The Economist. 22 June 2013. Retrieved 25 June 2013.
- Hopfenberg, Russell, and David Pimentel. "Human population numbers as a function of food supply." Environment, development and sustainability 3 (2001): 1–15.
External links
| External videos | |
|---|---|
Organizations
- The Day of 6 Billion and 7 Billion – Official homepages maintained by UNFPA
- Population Reference Bureau – News and issues related to population
- Berlin Institute for Population and Development
Statistics and maps
- HiveGroup.com – World population statistics presented in a treemap interface
- Win.tue.nl – World countries mapped by population size
Population clocks
| Major topics | |
|---|---|
| Society and population | |
| Publications | |
| Lists | |
Events and organizations |
|
| Related topics | |
| Authority control databases: National |
|---|