Population development of Duisburg
This article shows the population development of Duisburg in a table and graph.
On December 31, 2015, the " official population " for Duisburg was 491,231 (only main residences and after comparison with the other state offices ) according to an update by the State Office for Information and Technology NRW (IT.NRW ).
Population development
overview
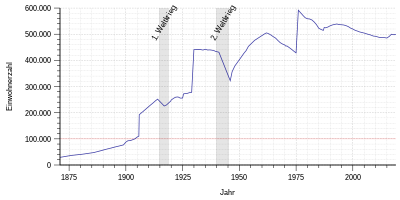
Continuous settlement of Duisburg can be assumed since the first century AD. In the Middle Ages and at the beginning of the modern era , the city did not exceed 4,000 inhabitants due to the relocation of the Rhine and the loss of its importance as a trading town and later due to wars, epidemics and famine. In 1800 the Klevian city had about 4500 inhabitants, and thus fewer inhabitants than the Klevian cities Wesel and Kleve with 9000 and 7000 inhabitants respectively. Nevertheless, Duisburg was a medium-sized city for the circumstances at the time.
Later than in industrial cities such as Krefeld , Barmen , Elberfeld and Düsseldorf , with industrialization in Duisburg, strong population growth did not begin until the second half of the 19th century. For a long time Duisburg was the largest city in the Ruhr area. In 1903 the city of Duisburg exceeded the limit of 100,000 inhabitants, which made it a major city .
On October 1, 1905, the first major incorporation took place ( Meiderich 33,690 inhabitants in 1900 and Ruhrort 12,406 inhabitants in 1900). In 1929 the city had almost 280,000 inhabitants.
On August 1, 1929, the city of Hamborn (126,043 inhabitants in 1925, 132,547 inhabitants in 1929) and several places from the Angermund district were incorporated. By 1961 the population rose to 500,000.
On January 1, 1975, the population of Duisburg with the incorporation of Rheinhausen (67,610 inhabitants 1974), Walsum (47,433 inhabitants 1974), Homberg (36,140 inhabitants 1974), Rumeln-Kaldenhausen (14,493 inhabitants 1970) and the district Baerl of the municipality of Rheinkamp reached its all-time high. While the State Office for Data Processing and Statistics in North Rhine-Westphalia gives the maximum number of 599,799 people in 1975, the city administration has 608,158. Until the 1980s, it was 10th among the West German cities, ahead of Bremen and Hanover .
At the end of 2011, the city with 488,005 inhabitants was 15th among German cities and 5th within North Rhine-Westphalia. According to the prognosis of the state office, a decline to 449,700 inhabitants is to be expected by 2025.
In 1970, around 650,000 people lived in the area of today's city of Duisburg. The proportion of foreigners at that time was around 5 percent. This increased to 20.8 percent by 2016.
The following overview shows the number of inhabitants according to the respective territorial status. Up to 1810 these are mostly estimates, then census results (¹) or official updates by the city administration (until 1970) and the State Statistical Office (from 1971). From 1840 the information relates to the “customs clearance population”, from 1871 to the “local population”, from 1925 to the resident population and since 1987 to the “population at the place of the main residence”. Before 1840, the number of inhabitants was determined according to inconsistent survey methods.
From 1714 to September 30, 1905
The first census in Duisburg took place on November 19, 1714 under the name “Specification of all resident landlords and incoles, including the same families and domestics, their profession, handling and trade”.
Of the 2983 people living within the city walls, 170 belonged to the university. 456 people lived in the council villages and the courtyards outside the city walls, so that the entire city had a population of 3609. Of these, 961 were men, 1066 women and 1582 children.
The strongest trade group comprised the cloth factory with 114 people. 14 monks and 18 nuns, 46 carters, 41 cloth weavers, 38 bakers and beer taverns, 37 wool weavers and wool spinners, 27 tailors, 24 linen weavers and 4 cloth traders lived in the city. There were 173 maids, 94 male servants and 92 day laborers. Only 23 people were reindeer.
The following information relates to the inhabitants until 1864 without the so-called Ratsdörfer and the Feldmark of Duisburg (today's Hochfeld and Dellviertel).
Taking into account the Ratsdörfer and the Feldmark, the population of the city grew from 3609 inhabitants in 1714 to 11,856 inhabitants in 1850 to 18,496 inhabitants in 1861 and 21,332 in 1864.
|
|
|
¹ census result
From 1905 to 1928
The following table shows the population after the incorporation of Ruhrort and Meiderich on October 1, 1905.
With the incorporation of the two cities, the Duisburg urban area covered an area of 7,073 hectares. When the empire was founded in 1871, Alt-Duisburg, Ruhrort and Meiderich had a combined population of almost 50,000. By the end of 1929 the population grew five and a half times. By the turn of the century, the vast majority of immigrants came from the Rhineland, Belgium and the Netherlands. Three quarters of the population had not yet reached the age of 40. Of these, however, only about 50 percent were of working age.
The Lord Mayor Karl Jarres described the increase in the population as frightening, as there was not enough space available for residential development. The city had only about 300 hectares available for rebuilding. Karl Jarres therefore suggested expanding the urban area to include the cities of Homberg and Rheinhausen on the left bank of the Rhine as well as the northern part of the Düsseldorf district and the city of Hamborn.
|
|
|
¹ census result
Source: City of Duisburg
From 1929 to 1974
The following overview shows the population after the incorporation of Hamborn (1929 = 129,828 inhabitants) and parts of the Angermund office on August 1, 1929.
The plan to also incorporate areas on the left bank of the Rhine and to divide the area belonging to the Düsseldorf district between the cities of Düsseldorf and Duisburg in equal parts between the two cities was rejected, as was the plan for a Ruhr estuary city .
As a concession to Hamborn, the new city was initially named Duisburg-Hamborn . The name was changed to Duisburg in 1935.
|
|
|
¹ census result
Sources: City of Duisburg (until 1970), State Office for Information and Technology in North Rhine-Westphalia (from 1971)
From 1975
As a result of the Ruhr Area Law , the cities and communities Walsum , Rheinhausen , Homberg , Rumeln-Kaldenhausen and Baerl were incorporated into the municipal reorganization on January 1, 1975 . The Düsseldorf law adds areas of the city of Angermund and the municipality of Wittlaer to the city of Duisburg. Some areas of the city of Rheinhausen and the communities of Kapellen and Rumeln-Kaldenhausen are incorporated into Krefeld on this occasion . The expansion of the city of Duisburg turned out to be far weaker than was actually planned. The cities and municipalities of Moers , Kamp-Lintfort , Rheinberg , Neukirchen-Vluyn and Kapellen , which would have driven the population of the city to over 700,000, were able to successfully defend themselves against complete incorporation.
Up until the mid-1980s, Duisburg was one of the ten largest cities in what is now the Federal Republic of Germany.
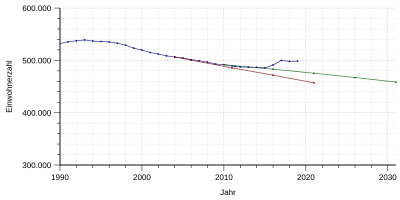
Within ten years of incorporation, the city lost about twelve percent of its population. Although the population increased again around 1990, the city has been losing population again since 1993, albeit at a slower pace. Compared to 1960, the city lost about 35% of its inhabitants in relation to its area before the municipal territorial reform. Without incorporation, the city would only have 340,000 inhabitants today. No other city in the Ruhr area has seen such a huge decline in its population. The reasons for the decrease are less due to the decline in the birth rate, but primarily to the massive relocation of many parts of the population.
While the city was still in tenth place among the largest German cities in 1975, by 2011 it had fallen back to 15th place behind Dresden , Hanover , Leipzig and Nuremberg .
On December 31, 2012, the " official population " for Duisburg was 486,816 based on the 2011 census based on updates by the State Office for Data Processing and Statistics North Rhine-Westphalia (only main residences and after comparison with the other state offices).
|
|
|
¹ census result
Source: State Office for Information and Technology in North Rhine-Westphalia
Population forecast
In their 2006 “Guide to Demographic Change 2020”, in which the Bertelsmann Foundation provides data on the development of the population of 2,959 municipalities in Germany, a 9.8 percent decline in Duisburg's population (49,449 people) is predicted between 2003 and 2020 . The predicted population decline in the large cities of the Ruhr area is more pronounced in Duisburg than in Essen and Dortmund.
Population 1996–2003 (%) | Duisburg −4.9 | Food −3.6 | Dortmund −1.2 |
Population 2003–2020 (%) | Duisburg −9.8 | Food −6.3 | Dortmund −2.3 |
Absolute population development 2003-2020 - forecast for Duisburg:
|
Source: Bertelsmann Foundation
Absolute population development 2009–2030 - forecast for Duisburg (main residences). During this period, the population is expected to decrease by 33,140 people or 6.7%.
|
Source: Bertelsmann Foundation
In March 2016, Deutsche Postbank AG published a study conducted by Michael Bräuninger, professor at Helmut Schmidt University , entitled Housing Atlas 2016 - Living in the City , in which a population forecast for 36 major German cities for the year 2030 is carried out. It also explicitly takes into account the immigration in the context of the refugee crisis in Germany from 2015 . For Duisburg, despite the influx of refugees, a population decline of 6.00% is predicted from 2015 to 2030.
Population structure
The largest groups of foreigners legally registered in Duisburg on December 31, 2016 came from Turkey (34,682), Romania (8,463), Bulgaria (8,816), Syria (7,185), Poland (5,558), Italy (3,594), Serbia (2,541 ), Greece (2,311), Bosnia-Herzegovina (1,894) and Macedonia (1,531).
In 2015, the proportion of citizens with a migration background was 29.5%.
| population | As of December 31, 2016 |
|---|---|
| Residents with main residence | 502.634 |
| of which male | 249,674 |
| Female | 252.960 |
| German | 398.217 |
| of which male | 193.265 |
| Female | 204,952 |
| Foreigners | 104,417 |
| of which male | 56,409 |
| Female | 48.008 |
| Proportion of foreigners in percent | 20.8 |
Source: City of Duisburg
| population | As of December 31, 2018 |
|---|---|
| Residents with main residence | 502.939 |
| of which male | 250.167 |
| Female | 252,772 |
| German | 393,468 |
| of which male | 191.496 |
| Female | 201,972 |
| Foreigners | 109,471 |
| of which male | 58,671 |
| Female | 50,800 |
| Proportion of foreigners in percent | 21.8 |
Source: City of Duisburg
Naturalizations
The following table shows the development of the naturalization of foreigners. They acquired German citizenship in the respective year by handing over a certificate of naturalization.
| year | Naturalizations |
|---|---|
| 2000 | 3363 |
| 2001 | 2765 |
| 2002 | 1979 |
| 2003 | 2019 |
| 2004 | 1591 |
| 2005 | 1183 |
| 2006 | 1306 |
| 2007 | 1468 |
| 2008 | 1172 |
| 2009 | 1044 |
| 2010 | 1156 |
| 2011 | 1319 |
| 2012 | 1304 |
| 2013 | 1206 |
| 2014 | 1235 |
| 2015 | 717 |
Source:
age structure
The following overview shows the age structure as of December 31, 2010 (main residences).
| Age from ... to | population | Percentage |
|---|---|---|
| 0-4 | 20,639 | 4.2 |
| 5-14 | 45.606 | 9.3 |
| 15-19 | 26,815 | 5.5 |
| 20 - 24 | 29,833 | 6.1 |
| 25-29 | 28,668 | 5.9 |
| 30-39 | 59,594 | 12.2 |
| 40-49 | 78.096 | 15.9 |
| 50 - 59 | 69.001 | 14.1 |
| 60-64 | 26,957 | 5.5 |
| over 65 | 104,350 | 21.3 |
| total | 489,559 | 100.0 |
Source: State Office for Information and Technology in North Rhine-Westphalia
Townships
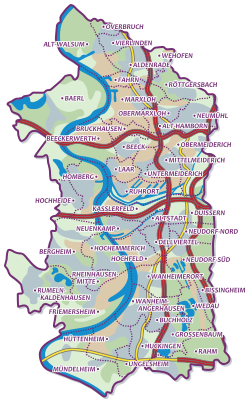
Before the municipal reorganization on January 1st, 1975, the Duisburg city area consisted of 6 city districts with a total of 33 city districts.
At the census on May 27, 1970, the city had an area of 143.32 square kilometers and 454,839 people. The number of foreigners living in Duisburg was 25,135 (5.5%), the total proportion of people with a migration background was only slightly higher.
The figures in the table below refer to May 27, 1970 (main residences).
| Surname | Districts | Area in km² |
of inhabitants number |
Inhabitants per km² |
|---|---|---|---|---|
| District I | Old town, Dellviertel Neuenkamp-Kaßlerfeld, Duissern, Neudorf-Nord, Neudorf-Süd | 26.20 | 101,342 | 3,868 |
| District II | Hochfeld, Wanheimerort | 8.77 | 53,302 | 6,078 |
| District III | Bissingheim, Wedau, Rahm, Großenbaum, Buchholz, Huckingen, Ungelsheim, Wanheim-Angerhausen, Hüttenheim, Ehingen, Serm, Mündelheim |
49.65 | 80.995 | 1,631 |
| District IV | Ruhrort, Laar, Beeckerwerth, Beeck | 18.57 | 41,088 | 2.213 |
| District V | Lower Meiderich, Mediterranean Meiderich, Upper Meiderich | 15.17 | 65.166 | 4,296 |
| District VI | Bruckhausen, Alt-Hamborn, Marxloh, Fahrn, Obermarxloh, Schmidthorst-Neumühl | 24.96 | 112,946 | 4,525 |
| Duisburg | 143.32 | 454.839 | 3,174 |
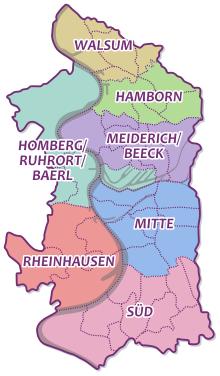
Since January 1, 1975, the urban area has consisted of seven urban districts. They are divided into a total of 46 districts. See the list of districts and districts of Duisburg .
The population figures in the following table refer to December 31, 2011 (main residences).
| Surname | Area in km² |
of inhabitants number |
Inhabitants per km² |
Number of foreigners |
Foreigners in% |
|---|---|---|---|---|---|
| Hamborn | 20.84 | 70,862 | 3,400 | 14,800 | 20.9 |
| Homberg / Ruhrort / Baerl | 37.10 | 40,015 | 1,079 | 4,904 | 12.3 |
| Meiderich / Beeck | 30.28 | 71,391 | 2,358 | 14,422 | 20.2 |
| center | 34.98 | 104,900 | 2,999 | 20,000 | 19.1 |
| Rheinhausen | 38.68 | 76,694 | 1,983 | 9,557 | 12.5 |
| south | 49.84 | 72,577 | 1,456 | 5,965 | 8.2 |
| Walsum | 21.10 | 50,399 | 2,389 | 5,960 | 11.8 |
| Duisburg | 232.82 | 486.838 | 2,091 | 75,608 | 15.5 |
The population figures in the following table refer to December 31, 2016 (main residences).
| Surname | Area in km² |
of inhabitants number |
Inhabitants per km² |
Number of foreigners |
Foreigners in% |
|---|---|---|---|---|---|
| Hamborn | 20.84 | 76.144 | 3,654 | 23,150 | 30.4 |
| Homberg / Ruhrort / Baerl | 37.10 | 40,444 | 1,090 | 6,446 | 15.9 |
| Meiderich / Beeck | 30.28 | 73,725 | 2,435 | 19,654 | 26.7 |
| center | 34.98 | 110,831 | 3,168 | 28,038 | 25.3 |
| Rheinhausen | 38.68 | 77,681 | 2.008 | 12,759 | 16.4 |
| south | 49.84 | 73.041 | 1,466 | 7,201 | 9.9 |
| Walsum | 21.10 | 50,768 | 2.406 | 7.169 | 14.1 |
| Duisburg | 232.82 | 502.634 | 2.159 | 104,417 | 20.8 |
Sources: City of Duisburg
The number of residents has increased in all districts since 2014. The proportion of foreigners has increased from 15.5% in 2011 to 20.8% at the end of 2016. According to an article in the Rheinische Post dated March 28, 2017, 36.4% in Duisburg now have a migration background. In the Hochfeld district this proportion is 70.7%, in Duisburg-Marxloh it is 66.7%.
literature
- Karl Friedrich Wilhelm Dieterici (ed.): Communications from the Statistical Bureau in Berlin , 1848–1861
- Imperial Statistical Office (Ed.): Statistical Yearbook for the German Empire , 1880–1918
- Statistisches Reichsamt (Ed.): Statistical yearbook for the German Reich , 1919–1941 / 42
- German Association of Cities (Ed.): Statistical Yearbook of German Communities , 1890 ff.
- Ernst Ambrosius: The density of people on the German Lower Rhine , Engelhorn, Stuttgart, 1891
- Federal Statistical Office (Ed.): Statistical Yearbook for the Federal Republic of Germany , 1952 ff.
- Bertelsmann Stiftung (Ed.): Guide to Demographic Change 2020. Analyzes and action plans for cities and municipalities. Bertelsmann Stiftung Publishing House, Gütersloh 2006, ISBN 3-89204-875-4
Individual evidence
- ↑ Landesbetrieb Information und Technik NRW: Official population figures ( Memento of the original from September 28, 2011 in the Internet Archive ) Info: The archive link was inserted automatically and has not yet been checked. Please check the original and archive link according to the instructions and then remove this notice.
- ^ Hermann Waterkamp: The population of Duisburg, Walter Bacmeisters National Verlag Essen, 1941
- ↑ 487,839 - City of Duisburg residents by Germans and foreigners, by districts and districts on December 31, 2014 . Retrieved October 4, 2017
- ↑ 494.445 - City of Duisburg: residents by Germans and foreigners, by districts and districts on December 31, 2015. (pdf) Retrieved October 4, 2017 .
- ↑ Bertelsmann Foundation: Population projection 2003-2020 ( Memento of the original from March 8, 2008 in the Internet Archive ) Info: The archive link was inserted automatically and has not yet been checked. Please check the original and archive link according to the instructions and then remove this notice.
- ↑ Bertelsmann Foundation: Population forecast ( Memento of the original from December 14, 2013 in the Internet Archive ) Info: The archive link was inserted automatically and has not yet been checked. Please check the original and archive link according to the instructions and then remove this notice.
- ↑ Press release Deutsche Post AG: Postbank study "Housing Atlas 2016 - Living in the City": Where population growth causes prices to rise , published on March 3, 2016, accessed on March 3, 2016
- ↑ City of Duisburg: Duisburg quarterly figures (PDF), accessed on February 26, 2017
- ↑ IT.NRW - Publication Service: Extended Search. In: webshop.it.nrw.de. Retrieved November 18, 2016 .
- ^ Office for statistics and elections of the city of Duisburg: Duisburger number mirror 005/71
- ^ Duisburg.de: Residents by Germans and foreigners, by districts and districts on December 31, 2011 (PDF; 15 kB)
- ↑ Duisburg.de: residents by Germans and foreigners, by districts and districts on December 31, 2016 (PDF; 15 kB)
- ↑ http://www.rp-online.de/nrw/staedte/duisburg/mehr-als-jeder-dritte-mit-migrationsverbindungen-aid-1.6717219 More than every third person with a migration background, Rheinische Post of March 28, 2017


