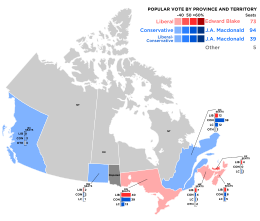
Canadian General Election 1882
%
40
30th
20th
10
0
31.10
27.83
12.56
2.88
25.62
Gains and losses
The Canadian general election in 1882 ( English 5th Canadian General Election , French 5e élection fédérale canadienne ) was the 5th election and took place on June 20, 1882. 211 deputies were elected the Canadian House of Commons (Engl. House of Commons , fr. Chambre des Communes ).
The vote
The Conservative Party of Prime Minister Sir John A. Macdonald was with the Liberal-Conservatives maintain their majority. The Liberal Party , led by Edward Blake , saw some seat gains but failed to come back to power.
The turnout was 70.3%.
Results
Overall result
| Political party | Chairman | candidates data |
Seats 1878 |
Seats 1882 |
+/- | be right | Share of voters |
+/- | |
|---|---|---|---|---|---|---|---|---|---|
| Conservative Party | John Macdonald | 118 | 85 | 94 | + 9 | 143,684 | 27.83% | + 1.55% | |
| Liberal Conservative Party 1 | 50 | 49 | 39 | - 10 | 64,860 | 12.56% | - 3.22% | ||
| Liberal Party | Edward Blake | 112 | 63 | 73 | + 10 | 160,547 | 31.10% | - 1.95% | |
| Independent | 7th | 5 | 1 | - 4th | 8,227 | 1.59% | - 1.12% | ||
| Nationalist Conservatives | 1 | 1 | 1 | 1,084 | 0.21% | + 0.14% | |||
| Independent liberals | 3 | 1 | 2 | + 1 | 5,740 | 1.11% | + 0.12% | ||
| Independent Conservatives | 2 | 2 | 1 | - 1 | 927 | 0.18% | + 0.18% | ||
| not known | 121 | 131.178 | 25.41% | + 4.48% | |||||
| total | 414 | 206 | 211 | + 5 | 516.247 | 100.0% | |||
1 The Liberal Conservatives and the Conservatives formed a parliamentary group in the House of Commons
Acclamations
27 MPs were elected by acclamation due to a lack of opposing candidates :
- British Columbia: 2 Liberal Conservatives
- Manitoba: 1 Conservative
- Ontario: 2 Conservatives
- Québec: 11 Conservatives, 1 Independent Conservative, 4 Liberal Conservatives, 3 Liberals
- New Brunswick: 1 Liberal Conservative, 1 Independent
- Nova Scotia: 1 Conservative
Result by provinces
| Political party | BC | MB | ON | QC | NB | NS | PE | total | ||
|---|---|---|---|---|---|---|---|---|---|---|
| Conservative Party | Seats | 3 | 2 | 39 | 38 | 4th | 8th | 94 | ||
| Percentage ownership % | 38.4 | 13.6 | 27.0 | 37.7 | 25.6 | 23.0 | 17.1 | 27.8 | ||
| Liberal Conservative Party | Seats | 3 | 1 | 13 | 12 | 3 | 5 | 2 | 39 | |
| Percentage ownership % | 15.8 | 38.9 | 9.1 | 10.4 | 7.1 | 25.8 | 25.4 | 12.6 | ||
| Liberal Party | Seats | 2 | 40 | 12 | 7th | 8th | 4th | 73 | ||
| Percentage ownership % | 10.6 | 25.3 | 31.9 | 21.5 | 36.8 | 38.7 | 40.7 | 31.1 | ||
| Independent | Seats | 1 | 1 | |||||||
| Percentage ownership % | 1.7 | 0.8 | 0.4 | 4.8 | 1.6 | |||||
| Nationalist Conservatives | Seats | 1 | 1 | |||||||
| Percentage ownership % | 1.0 | 0.2 | ||||||||
| Independent liberals | Seats | 1 | 1 | 2 | ||||||
| Percentage ownership % | 0.7 | 1.5 | 6.2 | 1.1 | ||||||
| Independent Conservatives | Seats | 1 | 1 | |||||||
| Percentage ownership % | 0.9 | 0.2 | ||||||||
| not known | Percentage ownership % | 35.2 | 22.2 | 29.6 | 27.1 | 23.9 | 7.7 | 16.8 | 25.4 | |
| Total seats | 6th | 5 | 92 | 65 | 16 | 21st | 6th | 211 | ||
Web links
- Elections Canada (Electoral Authority)
Individual evidence
- ^ Voter Turnout at Federal Elections and Referendums. Elections Canada, February 18, 2013, accessed July 3, 2015 .


