Canadian General Election 1896
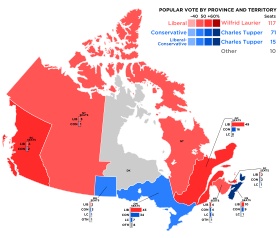
The 8th Canadian general election (Engl. 8th Canadian General Election , French. 8e élection fédérale canadienne ) was held on 23 June 1896. 213 deputies were elected the Canadian House of Commons (Engl. House of Commons , fr. Chambre des Communes ). The previously ruling Conservatives achieved more votes than the Liberals , but overall they won fewer seats because they lost decisive votes to factions in numerous constituencies. Wilfrid Laurier , leader of the Liberals, became the new prime minister .
The vote
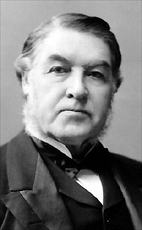
The ruling Conservative Party had been disorganized since the death of John Macdonald in 1891, with four chairmen in five years. It was also seen as corrupt and wasteful. The Conservatives and their affiliated Liberal Conservatives were led by Charles Tupper , former Prime Minister of Nova Scotia . In February 1896, Tupper had introduced a bill to clarify the Manitoba school issue, but failed because of a filibuster of an alliance of liberals and extreme Protestants led by Dalton McCarthy . Then Tupper called a new election on April 24th.
Tupper argued that the main issue of the election campaign was not the conflict between English-speaking Protestants and Francophone Catholics, but the future of Canadian industry. He called on the conservatives to unite. However, these were so divided over the Manitoba school issue that Tupper was confronted with a wave of criticism at election events. Several splinter groups formed that competed with the conservatives and gave them decisive votes in numerous constituencies.
The Liberal Party traditionally stood for radical change and free trade, but appeared far more conservative in 1896, which enabled it to attract moderate voters to its side. The most important change was Wilfrid Laurier's support for Macdonald's National Policy , a protectionist industrial policy that was approved by powerful businessmen in Montreal and Toronto . While the Conservatives won the most votes with 46.5% (versus 45% of the Liberals), they only won around half of the seats in the English-speaking part of Canada, while the Liberals celebrated a landslide victory in Québec .
Although Laurier had clearly won the election, Tupper initially refused to relinquish power. He took the position that Laurier could not bring a majority capable of governing behind him. When Tupper tried to appoint ministers, Governor General Lord Aberdeen intervened . He dismissed the previously incumbent Prime Minister and entrusted Laurier with forming a government. Tupper called this practice unconstitutional.
The turnout was 62.9%.
Results
Overall result
| Political party | Chairman | candidates data |
Seats 1891 |
Seats 1896 |
+/- | be right | Share of voters |
+/- | |
|---|---|---|---|---|---|---|---|---|---|
| Liberal Party | Wilfrid Laurier | 190 | 90 | 117 | + 27 | 401.425 | 41.37% | - 3.85% | |
| Conservative Party | Charles Tupper | 190 | 97 | 71 | - 26th | 430,874 | 44.40% | + 1.44% | |
| Liberal Conservative Party 1 | 17th | 20th | 15th | - 5th | 36,541 | 3.77% | - 1.85% | ||
| Nationalists | 5 | 1 | - 1 | 14,121 | 1.46% | + 1.46% | |||
| Independent Conservatives | 4th | 3 | 4th | + 1 | 12,209 | 1.26% | - 0.68% | ||
| Patrons of Industry | 31 | 2 | + 2 | 38,275 | 3.94% | + 3.94% | |||
| McCarthy candidate | Dalton McCarthy | 11 | 2 | + 2 | 12,861 | 1.33% | + 1.33% | ||
| Independent | 18th | 2 | 1 | - 1 | 13,870 | 1.43% | + 0.61% | ||
| Independent liberals | 1 | 1 | 1 | 2,353 | 0.24% | - 0.48% | |||
| Protestant Protective Association | 5 | 6.233 | 0.64% | + 0.64% | |||||
| not known | 1 | 1,622 | 0.17% | - 2.01% | |||||
| Nationalist Conservatives | 1 | - 1 | |||||||
| total | 473 | 215 | 213 | - 2nd | 970.384 | 100.0% | |||
1 The Liberal Conservatives and the Conservatives formed a parliamentary group in the House of Commons
Acclamations
4 MPs were elected by acclamation due to a lack of opposing candidates :
- Ontario: 1 Patron of Industry
- Québec: 1 Conservative, 2 Liberals
Result by provinces and territories
| Political party | BC | NW | MB | ON | QC | NB | NS | PE | total | ||
|---|---|---|---|---|---|---|---|---|---|---|---|
| Liberal Party | Seats | 4th | 3 | 2 | 43 | 49 | 4th | 10 | 2 | 117 | |
| Percentage ownership % | 51.2 | 46.0 | 31.0 | 40.5 | 53.8 | 42.5 | 31.9 | 51.5 | 41.4 | ||
| Conservative Party | Seats | 2 | 1 | 3 | 34 | 16 | 4th | 9 | 2 | 71 | |
| Percentage ownership % | 48.8 | 43.9 | 45.1 | 40.9 | 45.2 | 31.5 | 65.4 | 40.5 | 44.4 | ||
| Liberal Conservative Party | Seats | 1 | 7th | 5 | 1 | 1 | 15th | ||||
| Percentage ownership % | 8.0 | 4.0 | 0.4 | 17.5 | 2.2 | 8.5 | 2.2 | ||||
| Independent Conservatives | Seats | 4th | 4th | ||||||||
| Percentage ownership % | 3.0 | 1.3 | |||||||||
| Patrons of Industry | Seats | 2 | 2 | ||||||||
| Percentage ownership % | 7.6 | 8.3 | 0.7 | 3.9 | |||||||
| McCarthy candidate | Seats | 1 | 1 | 2 | |||||||
| Percentage ownership % | 8.3 | 2.4 | 1.3 | ||||||||
| Independent | Seats | 1 | 1 | ||||||||
| Percentage ownership % | 10.0 | 1.4 | 8.6 | 0.5 | 1.4 | ||||||
| Independent liberals | Seats | 1 | 1 | ||||||||
| Percentage ownership % | 0.6 | 0.2 | |||||||||
| Nationalists | Percentage ownership % | 3.2 | 0.5 | 1.5 | |||||||
| Protestant Protective Association | Percentage ownership % | 1.5 | 0.6 | ||||||||
| not known | Percentage ownership % | 0.4 | 0.2 | ||||||||
| Total seats | 6th | 4th | 7th | 92 | 65 | 14th | 20th | 5 | 213 | ||
Web links
- Elections Canada (Electoral Authority)
- Stephen Azzi: Election 1896 ( English, French ) In: The Canadian Encyclopedia . Retrieved June 22, 2015.
Individual evidence
- ^ Voter Turnout at Federal Elections and Referendums. Elections Canada, February 18, 2013, accessed July 4, 2015 .


