Canadian General Election 1900
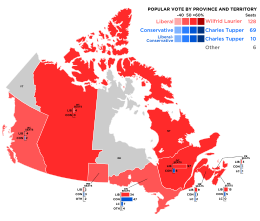
The 9th Canadian general election (Engl. 9th Canadian General Election , French. 9e élection fédérale canadienne ) was held on November 7, 1900. 213 deputies were elected the Canadian House of Commons (Engl. House of Commons , fr. Chambre des Communes ). The Liberal Party was able to expand the absolute majority it had won four years earlier.
The vote
The ruling Liberal Party of Prime Minister Wilfrid Laurier , the first Francophone head of government in the country, had won an absolute majority of the parliamentary seats in 1896, although at the time it had received fewer votes than the Conservative Party and the Liberal Conservatives associated with it .
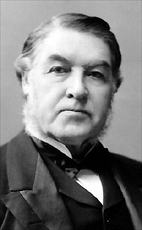
In the 1900 election, the Liberals were the first party to win more than 50% of the vote, thereby increasing their majority in parliament. The opposition conservatives around Charles Tupper suffered slight losses.
The turnout was 77.4%.
Results
Overall result
| Political party | Chairman | candidates data |
Seats 1896 |
Seats 1900 |
+/- | be right | Share of voters |
+/- | |
|---|---|---|---|---|---|---|---|---|---|
| Liberal Party | Wilfrid Laurier | 209 | 117 | 128 | + 11 | 477,758 | 50.25% | + 8.88% | |
| Conservative Party | Charles Tupper | 193 | 71 | 69 | - 2nd | 410,953 | 43.22% | - 1.18% | |
| Liberal Conservative Party 1 | 11 | 15th | 10 | - 5th | 27,377 | 2.88% | - 0.89% | ||
| Independent | 12 | 1 | 3 | + 2 | 13,307 | 1.40% | - 0.03% | ||
| Independent Conservatives | 4th | 4th | 1 | - 3 | 10,081 | 1.06% | - 0.20% | ||
| Independent liberals | 3 | 1 | 1 | 4,895 | 0.51% | + 0.27% | |||
| Independent Labor | 1 | 1 | + 1 | 3,441 | 0.36% | + 0.36% | |||
| Labor Party | 3 | 2,924 | 0.31% | + 0.31% | |||||
| not known | 1 | 27 | 0.01% | - 0.17% | |||||
| Other groupings | 4th | - 4th | |||||||
| total | 437 | 213 | 213 | 950.763 | 100.0% | ||||
1 The Liberal Conservatives and the Conservatives formed a parliamentary group in the House of Commons
Result by provinces and territories
| Political party | BC | NW | MB | ON | QC | NB | NS | PE | total | ||
|---|---|---|---|---|---|---|---|---|---|---|---|
| Liberal Party | Seats | 4th | 4th | 2 | 34 | 57 | 9 | 15th | 3 | 128 | |
| Percentage ownership % | 49.1 | 55.1 | 42.9 | 46.7 | 56.3 | 51.9 | 51.7 | 51.8 | 50.3 | ||
| Conservative Party | Seats | 2 | 3 | 47 | 8th | 3 | 5 | 1 | 69 | ||
| Percentage ownership % | 40.9 | 44.9 | 35.3 | 44.9 | 43.6 | 35.6 | 44.9 | 39.4 | 43.2 | ||
| Liberal Conservative Party | Seats | 7th | 2 | - | 1 | 10 | |||||
| Percentage ownership % | 3.8 | 8.1 | 3.4 | 8.8 | 2.9 | ||||||
| Independent | Seats | 1 | 2 | 3 | |||||||
| Percentage ownership % | 13.5 | 1.7 | 0.2 | 0.3 | 1.4 | ||||||
| Independent Conservatives | Seats | 1 | - | 1 | |||||||
| Percentage ownership % | 1.7 | 4.2 | 1.1 | ||||||||
| Independent liberals | Seats | 1 | 1 | ||||||||
| Percentage ownership % | 1.1 | 0.5 | |||||||||
| Independent Labor | Seats | 1 | 1 | ||||||||
| Percentage ownership % | 8.2 | 0.4 | |||||||||
| Total seats | 6th | 4th | 7th | 92 | 65 | 14th | 20th | 5 | 213 | ||
Web links
- Elections Canada (Electoral Authority)
Individual evidence
- ^ Voter Turnout at Federal Elections and Referendums. Elections Canada, February 18, 2013, accessed July 4, 2015 .


